Live Reports
The Live Reports provide a live visual representation of the traffic load across network links. Graphs are similar to that of MRTG, with the aim of providing a simple way to see exactly how much inbound and outbound traffic was generated for each device. | SNMP base Live report graphs are not available for virtual Firewalls (vdom). |
Interface/Zone Reports (Live Reports For all devices) Click the Interface/Zone Reports link in the sub tab to see the Interface wise live reports
for all devices, for the last 24 hours, over a 5-minute average. Interface/Zone Live Reports Dashboard (Last 24 Hours) screen opens up. In that screen you will find Device - Interface details table. It will list all the devices and their interfaces. Click the Show All link or + tree icon to the left of the device in the list. Hide All link or - tree icon will display the list of devices and the numbers of interface the device has. The expanded table lists the Device Name, Interface Name, Bandwidth IN, and Bandwidth OUT. Bandwidth IN and Bandwidth Out will display the bandwidth usage of the interface in percentage and the average speed in Kbps/Mbps/Gbps. Click on the Live Reports link below the device in the list to view the live reports for that device alone. Click on the individual interfaces names of the device in the list to view the only the live reports of the interface of the device. Configure SNMP protocol settings for your Firewall device The procedure to configure the SNMP protocol settings of Firewall devices in the Firewall Analyzer is given below: - Click Interface/Zone Reports > Click Configure SNMP protocol for Live reports. "Try now." link. Add Live Settings page appears.
- In that, the devices are listed in the Device Name drop down list. Select the device as required.
- Below the Device Name, the IP Address of the selected device will appear.
- Select the SNMP VersionV1 or V2 or V3 using the respective radio button.
- Version 1 (V1):
- Enter the SNMP Community of the device in the text box
- Enter the SNMP Port of the device in the text box
- Version 2 (V2):
- Enter the SNMP Community of the device in the text box
- Enter the SNMP Port of the device in the text box
- Version 3 (V3):
- Enter the SNMP Community of the device in the text box
- Enter the SNMP Port of the device in the text box
- Enter the User Name of the device in the text box
- Enter the Context Name of the device in the text box
- Authentication:
- Select the Protocol for authentication from the drop down list (MD5, SHA).
- Enter the Password for authentication in the text box
- Encryption:
- Select the Protocol for encryption from the drop down list (DES, AES).
- Enter the Password for encryption in the text box
- Select the reports in the Select Reports section. In that section, the Report Name and Protocol are listed.
- Select Interface Live Report using the check box. Select the Protocol for the report. On selecting the Interface Live Report, Interval field will appear with the drop down list. You can select 1 minute or 5 minutes or 10 minutes granularity in Live reports by choosing appropriate interval.
- Select Live VPN Users report using the check box. Select the Protocol for the report. This report will be listed only if the device has the provision to get the Live VPN Users using SNMP protocol. Otherwise, this report option will not be there.
- The Apply to other similar devices section, contains list of devices of the same vendor type as the selected device with the check boxes to select, along with Select All devices option. If you want to apply the same credentials (Community, Port, etc.,) to other similar firewalls, please select them.
- Click Save button to save the configuration and Cancel button to cancel the operation. Upon saving the form, the details are stored in the database and a sample SNMP query is made to test connection. If the SNMP credentials are not valid, you can skip saving the Live Settings.
| If SNMP query is not successful, error message will be displayed on top of the page. Upon error, ensure the credentials provided are correct. Also ensure you have provided Management access through the source interface for SNMP protocol. |
Once the 'Live Settings' is added successfully, the Edit | Disable | Delete SNMP options are displayed to respective devices in Interface Live Reports Dashboard. The Live Reports and Interface Live Reports are populated with SNMP data. Using the SNMP parameters configured, all the devices will be queried to get interface details. To configure/enable SNMP protocol in individual Firewall devices, refer the respective device configuration documents. Fortigate, Netscreen, Cisco PIX, Cisco ASA, Cisco Firewalls using ASDM tool Once the SNMP settings is done for Live Reports, we skip the syslog data and use SNMP data for Live Reports. To switch to syslog option either disabling or deleting the SNMP settings. You could find this option to the right of device name in Interface/Zone Live Reports dashboard. Configuring SNMP parameters for specific interfaces Before the interface name, you will find  icon. Click the icon to set the Interface Details specific to this interface. Configure Interface Details screen pops-up. On the top you will see two options, one is User Input and the other is Get from SNMP query with radio buttons. icon. Click the icon to set the Interface Details specific to this interface. Configure Interface Details screen pops-up. On the top you will see two options, one is User Input and the other is Get from SNMP query with radio buttons. By default User Input radio button is selected. If you want to manually enter the interface details, carryout in this screen as given below: In the User Input screen, Device Name, Interface Name will be displayed. Besides the name of the interface, you will find edit icon. Click the icon to change the interface name as per your requirement. The result will take effect immediately. You can enter the Interface IP, Interface IP, Up Link Speed (in Kbps/Mbps/Gbps), and Down Link Speed (in Kbps/Mbps/Gbps) values manually. Select the Get from SNMP query radio button if you want the application to automatically query the interface through SNMP and fetch the interface details. In the Get from SNMP queryscreen, Device Name will be displayed and you can enter the Device IP Address, SNMP Community and SNMP Port. Enter the the SNMP Community and SNMP Port parameters. Using the SNMP parameters configured, the specific interface will be queried to get interface details. Click Save button to save the configuration and Cancel button to cancel the operation. | SNMP base Live report graphs are populated based on SNMP OID's ifInOctets and ifOutOctets. As these OID's are incremental counters we do not plot graph at a point when any of these counters gets reset. |
Live Reports of Each Firewall Device On the top right side of the Report screen, there will be two combo boxes. They are: Refresh The Refresh combo box lets to enable or disable refreshing of the Live reports and lets you to choose the refreshing interval of the Live reports. There will be three field values for filtering. They are: - Never Refresh
- Refresh Every 1 Min
- Refresh Every 5 Min
- Refresh Every 10 Min
Export as The Export as combo box lets you choose the format of the reports for export. There will be two formats for exporting. They are: Click on the PDF to export this report to PDF. Click on the CSV to export this report to CSV format (comma separated values). Click the Live Reports link present inside the list of reports for a device, to see the live reports for that device alone, over all the time periods described above. The graphs for each device shows the minimum, maximum, and average amount of incoming and outgoing traffic through that device, over several time periods. Traffic is broken down into the last day, last week, last month, and last year, with an average granularity of 5 minutes, 30 minutes, 2 hours, and 1 day respectively.The incoming and outgoing bandwidth can be viewed in Kbps/Mbps/Gbps. Drill down from each of the graphs in the live report to see the following
details: | Graph | Description |
|---|
| Inbound/Outbound Traffic Conversations | The inbound/outbound conversations for all hosts across this device. This data is available only for the last day's traffic over a 5-minute average granularity. | | Top Hosts | The top hosts contributing to inbound/outbound traffic across this device. Drill down from this graph to see the corresponding conversations for each host, during the selected time period. | | Top Protocol Groups | The top protocol groups used in inbound/outbound traffic across this device. Drill down from this graph to see the corresponding conversations using each protocol group, during the selected time period. | | Top Users | The top users contributing to inbound/outbound traffic across this device. Drill down from this graph to see the corresponding conversations for each user, during the selected time period. |
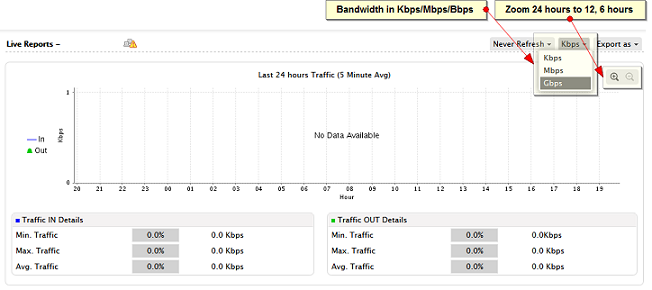
Live traffic for the 24 hour period can be zoomed to 12 hour and 6 hour periods. | Live Reports will not be available for devices whose logs do not contain the "duration" field.
For example: WatchGuard, SonicWall, Astaro, IP Filter Linux Firewall, etc... |
Live Reports of Each Squid Proxy Device On the top right side of the Report screen, there will be two combo boxes. They are: Refresh The Refresh combo box lets to enable or disable refreshing of the Live reports and lets you to choose the refreshing interval of the Live reports. There will be three field values for filtering. They are: - Never Refresh
- Refresh Every 1 Min
- Refresh Every 5 Min
- Refresh Every 10 Min
Export as The Export as combo box lets you choose the format of the reports for export. There will be two formats for exporting. They are: Click on the PDF to export this report to PDF. Click on the CSV to export this report to CSV format (comma separated values). Click the Live Reports link present inside the list of reports for a device, to see the live reports for that device alone, over specific time periods. The graphs for each device shows the minimum, maximum, and average amount of outgoing traffic through that device, over several time periods. Traffic is broken down into the last day, last week, last month, and last year, with an average granularity of 5 minutes, 30 minutes, 2 hours, and 1 day respectively. Live traffic for the 24 hour period can be zoomed to 12 hour and 6 hour periods. The outgoing bandwidth can be viewed in Kbps/Mbps/Gbps. | Live Reports will not be available for devices whose logs do not contain the "duration" field. |
| 

