QEngine - Product End Of Life Cycle Plan
ManageEngine has announced Product End of Life Cycle for QEngine. It will not be available for purchase or active support. If you have any queries regarding the transition, please feel free to contact qengine-support@manageengine.com.
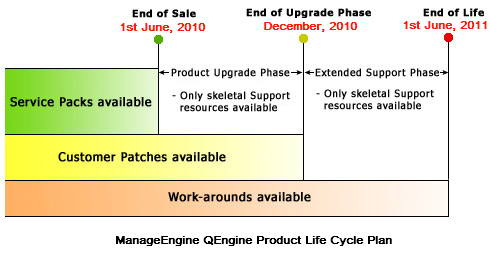
End of Sale: QEngine will not be available for purchase or active support after 1st of June, 2010.
Extended Support Phase: During this phase, support is provided only to customers who have valid AMS. Feature enhancements will not be taken up.
End Of Life (EOL) Phase: This phase pertains to the product releases that are neither available on the web site nor supported. Only online help is available in the Web site. Technical support is no longer available for all Editions.