Product End of Life Announcement
ManageEngine has stopped all further development in the VQManager product and has discontinued sales and distribution of the product. We regret for the inconvenience caused to the customers.
Dear VQManager Customers,
It has been a pleasure serving you so far; we hope that you had a good experience with the product.
With great regret, we would like to inform you that ManageEngine has stopped all further development in the VQManager product and has discontinued sales and distribution of the product.
We understand difficultly this poses for existing customers who are using VQManager. We deeply regret the inconvenience caused due to this.
For existing customer covered under the period of annual maintenance and support, we will honor the support contract. We will provide product support till your contract expires or January 31, 2013 whichever is earlier, but there will be no new enhancements of features.
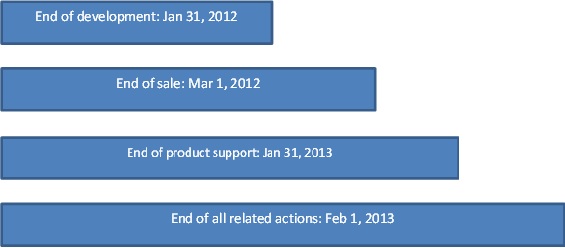
Details of the end-of-life of VQManager are given below:
If you have any queries, do contact us by e-mail on vqmanager-support [at] manageengine [dot] com.
Regards,
Team VQManager