Dashboard
Dashboard is the home page for AD360. It provides a quick snapshot of all essential aspects of the integrated components in a polished graphical display. The graphical representation helps you to grasp the most important information quickly from the home page itself and take necessary actions with the help of the product.
Under Dashboard, each component of AD360 has its own tab. You can also add your own custom tab combining the widgets from the integrated components.
Follow the links to learn more about the respective topics:
- Default tabs
- Custom tabs and widgets
- Embedding dashboard and widgets
- To switch between dashboard view of different domains
Default tabs
By default, AD360 contains different tabs for each integrated component under the dashboard. The following information is displayed under each tab:
ADManager Plus
The dashboard of this component displays vital information about domain users, machines, and other AD objects like groups and OUs. The following reports are viewable under this tab:
- User Reports
- System Reports
- Other Reports
ADAudit Plus
Audit data of all configured domains can be viewed from the dashboard of this component. The display information is grouped by domains and desired/undesired audit activities like logon failures, account management, etc. The following reports are viewable under this tab:
- User Logon
- Group Management
- Domain Policy Changes
ADSelfService Plus
The dashboard of this component provides a comprehensive view of users’ password and account status, enrollment data, and users' self-service actions. The following reports are viewable under this tab:
- User Reports
- Enrollment Reports
- Audit Reports
M365 Manager Plus
The dashboard of this component gives you a bird’s eye view of all important Microsoft 365 statistics that you need to track. The following reports are viewable under this tab:
- Top Senders/Recipients
- License by Service
- Mailbox Traffic Summary
- Groups
- Group Sizes
ExchangeReporter Plus
An essential snapshot of all the important details of your Exchange environment is captured under the dashboard of this component. The following reports are viewable under this tab:
- Server Storage Usage
- Mailbox Size
- Organization Traffic Summary
- Top Server Traffic
RecoveryManager Plus
This component's dashboard gives you a snapshot of the number of backups and restorations carried out with it.
The following information can be viewed under this tab:
- Number of available backups
- Scheduled time of the next backup
- Number of monitored objects
- A graphical representation of the number of backed-up objects
- A graphical representation of the number of restored objects
SharePoint Manager Plus
The dashboard of this component gives you a bird’s eye view of all critical Microsoft SharePoint statistics that you need to track.
The following reports are viewable under this tab:
- SharePoint site activities
- Site Collections with size
- Users with most audits
- Site collections with most audits
Custom tabs and widgets
The custom tabs provide true integration between the components by combining reports in graphical format from various components under a single tab. This allows you to group together important widgets from different components, say password expired users in AD and Microsoft 365 from ADManager Plus and M365 Manager Plus components respectively, under a single tab.
A widget is a report that is presented in graphical format for easy understanding. You can add multiple widgets from different components in a custom tab.
To add a custom tab, follow the steps given below:
- Log in to AD360 as an administrator.
- Under Dashboard, click the Settings icon at the top right corner and select Manage Dashboard.

- Click Add Tab. In the Add Tab pop up, enter the Tab Name and click Add.
- Once you have added an tab, you can add widgets under that tab from any component. Just click Add Widget, select a component and a widget.
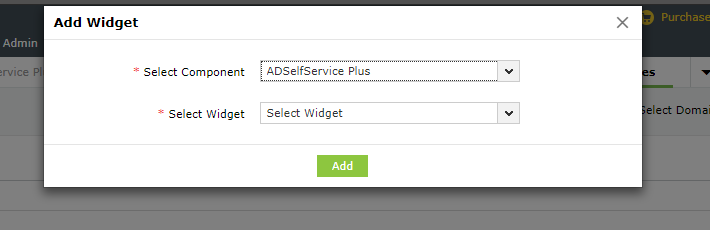
- Once you have added the tabs and necessary widgets, click Done.
- To edit or remove a widget, click the Settings icon → Manage Dashboard. Then, hover the mouse over top right corner of the widget. Click the Edit icon or Delete icon to change the name of or remove the widget.

- To delete a custom tab, click the Settings icon → Manage Dashboard. Then, hover the mouse near the tab. Click the Delete icon to remove the tab.

- Once you’ve made the required changes, click Done.
Embedding dashboard and widgets
You can embed the entire dashboard or a particular widget of AD360 in another web page or a wiki.
To embed a dashboard:
- Under the Dashboard tab, click the Settings icon → Embed Dashboard.

- Copy the HTML snippet and paste it in your web page.
- Under the Dashboard, select a custom tab.
- Click the arrow icon at the top right corner of a widget, and select Embed Widget.

- Copy the HTML snippet and paste it in your web page.
To embed a widget:
To switch between dashboard view of different domains
The dashboard can show the above information for only one domain at a time. To change the dashboard view to display the information of another domain, please do the following:
- Go to Dashboard (home page of AD360).
- In the top right corner of Dashboard, you can find a drop down menu 'Select Domain to View'.
- Choose the domain of your choice from the drop down menu to view all the essential information pertaining to that domain.