Auto Analysis
The Auto Analysis feature in Analytics Plus allows you to turn raw data into insights within minutes. It utilizes generative AI, machine learning, and natural language processing to comprehend the metadata and data structure to generate reports and dashboards accordingly.
This feature serves as a guide, emphasizing the most critical aspects of the data and making the analysis easier when handling large volumes of information. Additionally, it is highly customizable to address specific analytical needs.
Analytics Plus provides the following auto-analysis option:
Auto analysis
Analytics Plus allows you to auto-generate reports and dashboards effortlessly. You can customize the reports later based on your evolving requirements. Follow the steps below to do this.
Invoking the Auto Analysis option
New table
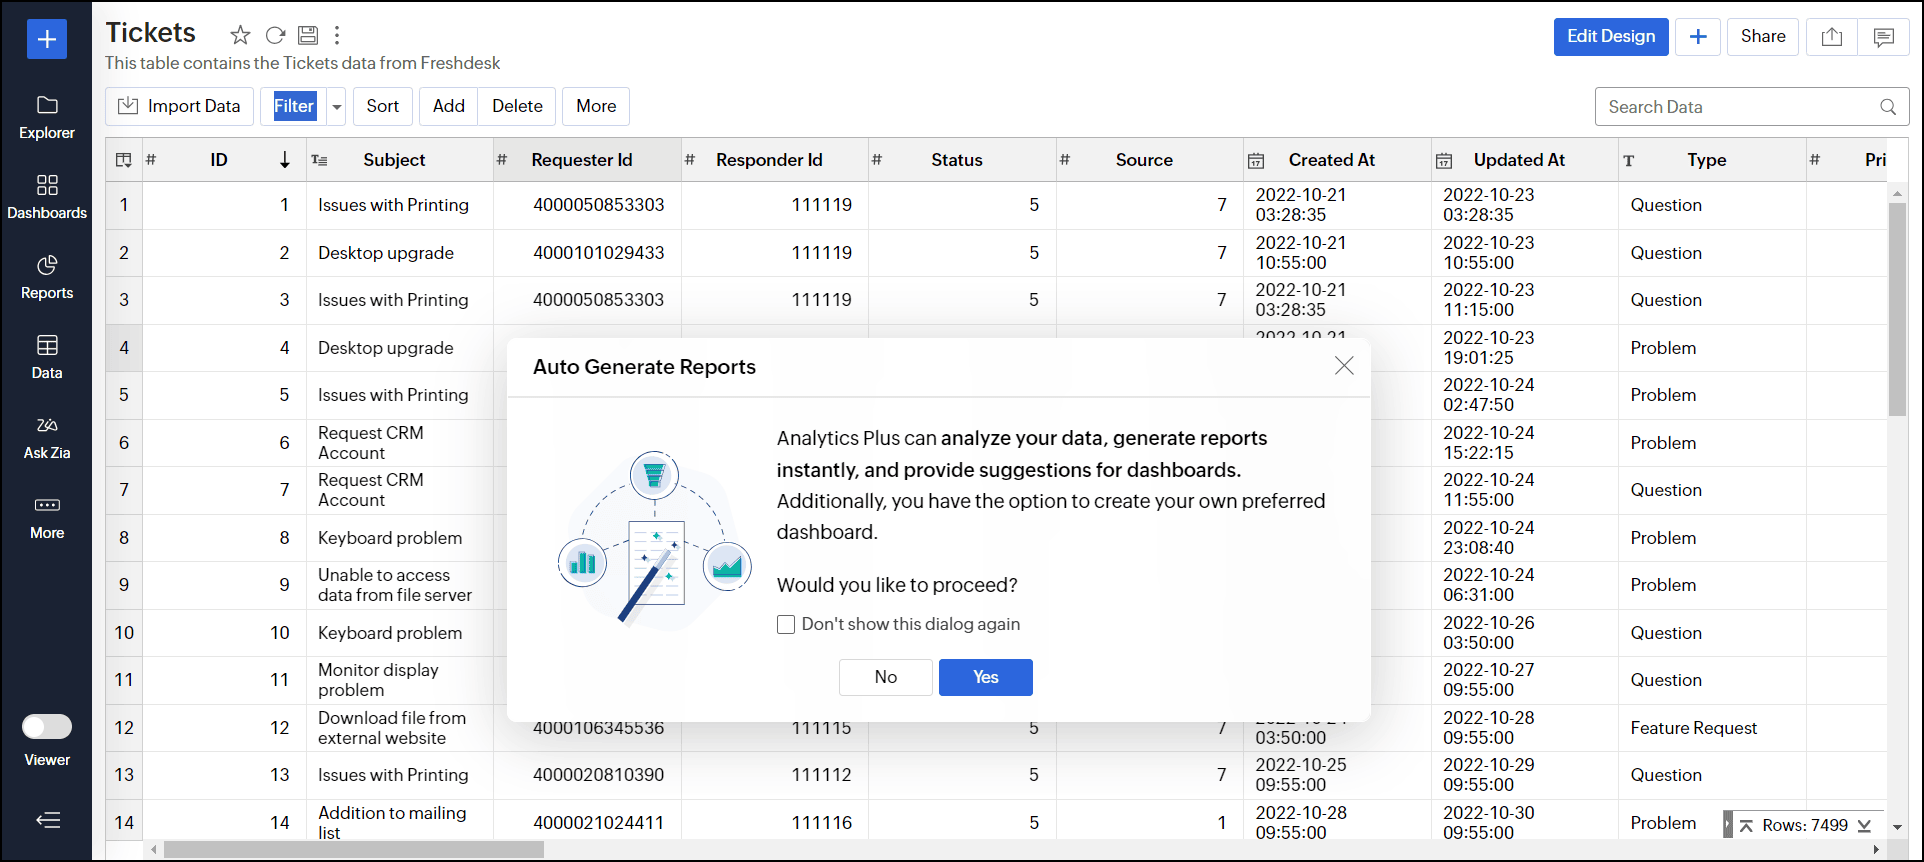
After successfully importing data into a new table, Analytics Plus will prompt you to auto-generate reports and dashboards. In the pop-up that appears, click Yes to proceed.
Existing table
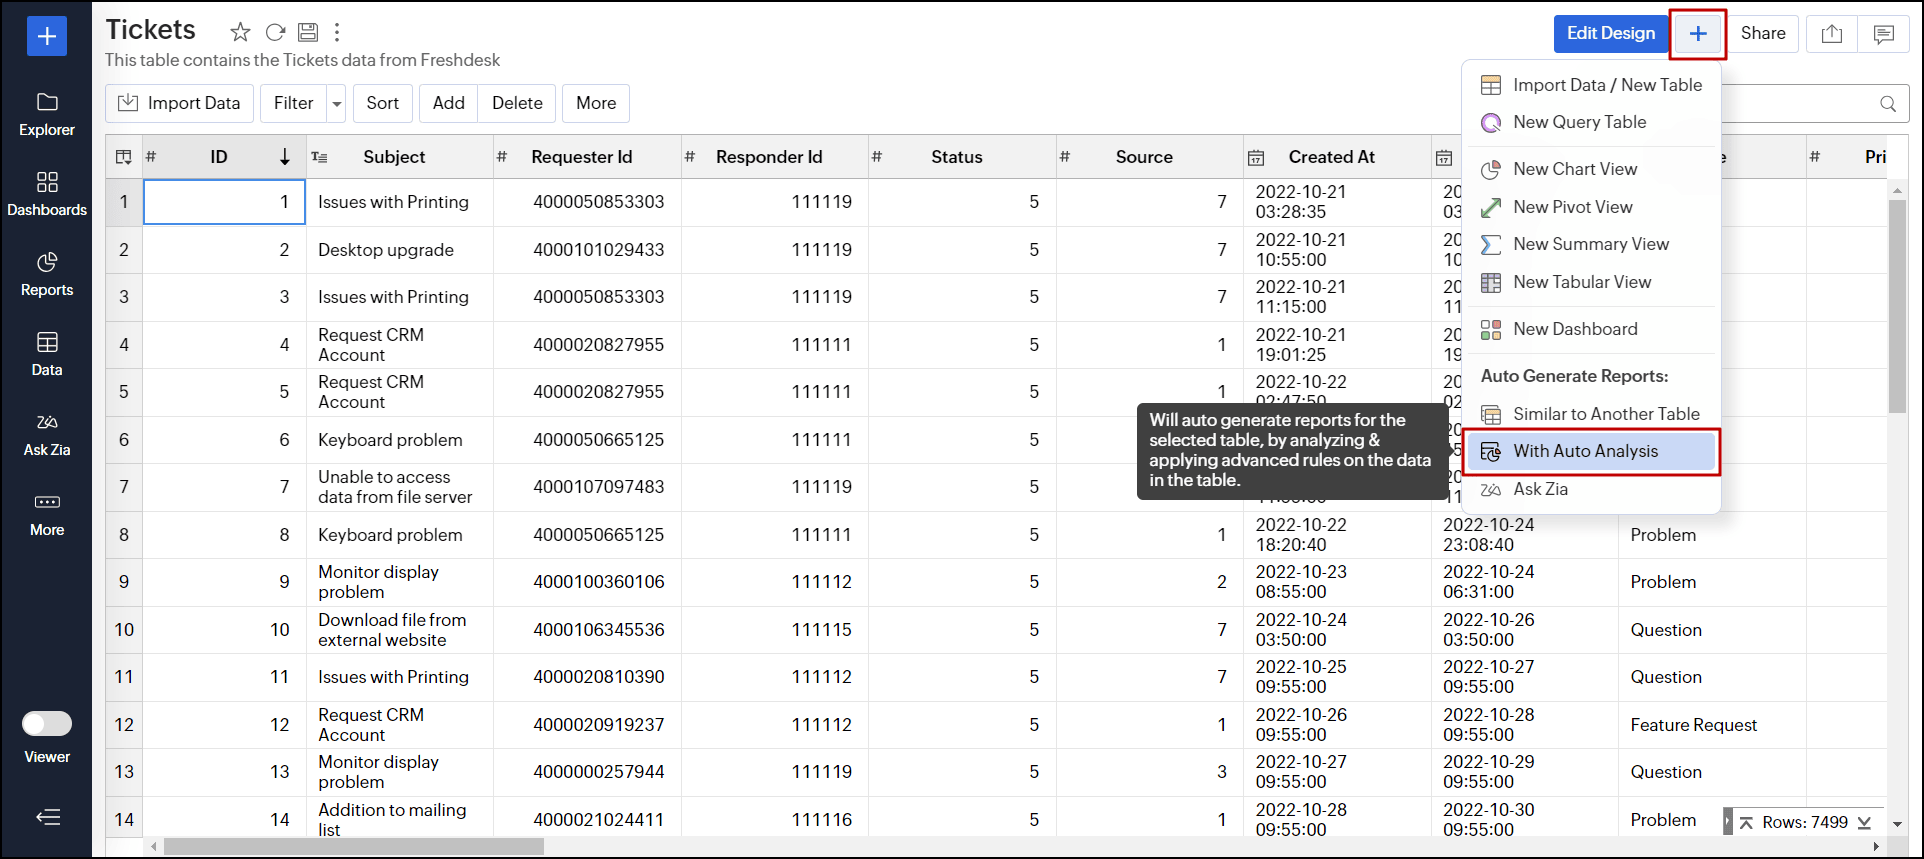
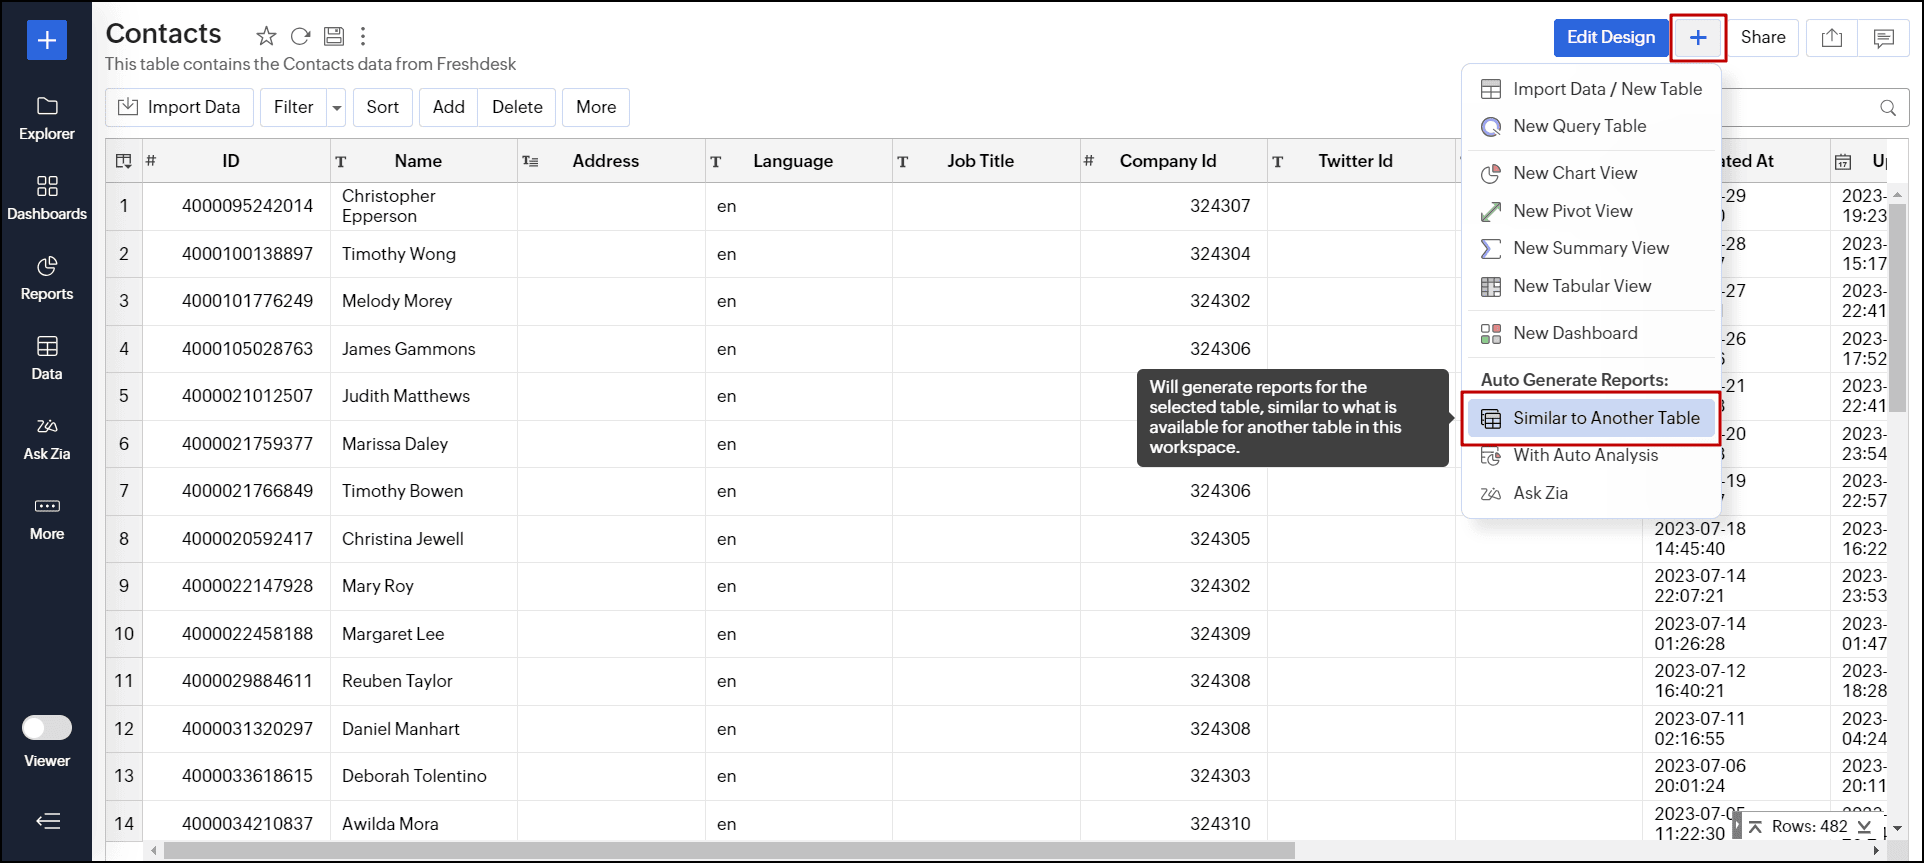
From the table view: Open the desired table for which you need to auto-generate reports and dashboards, click the + (Create New) button, and choose the With Auto Analysis option.
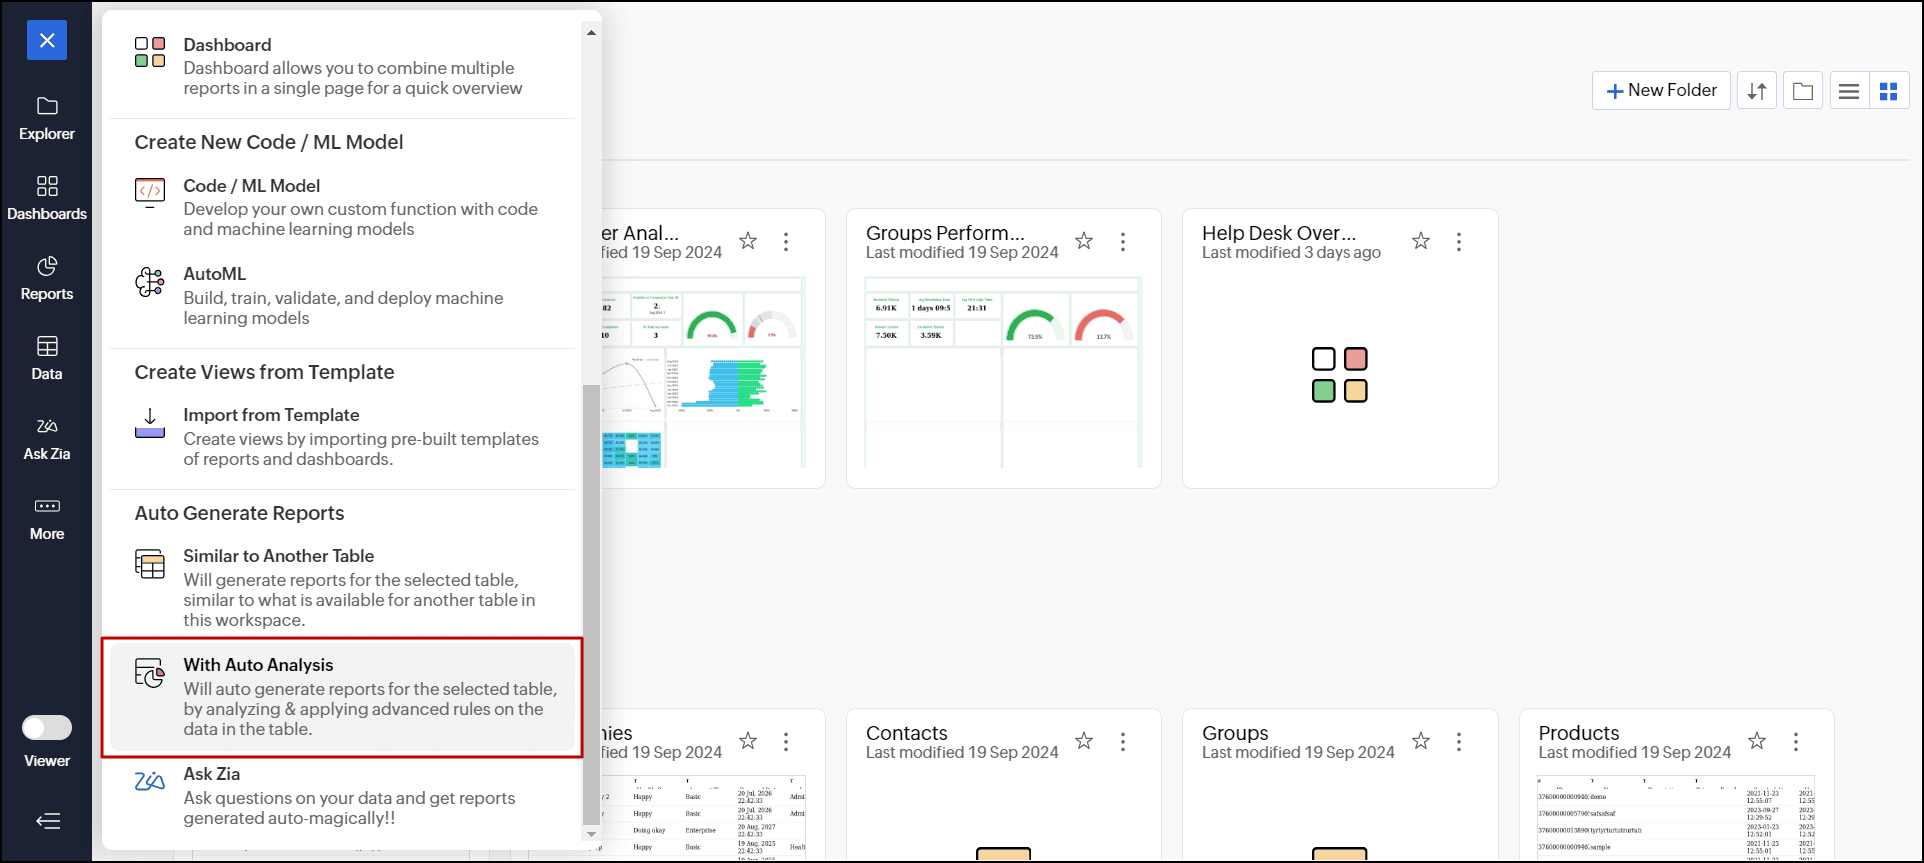
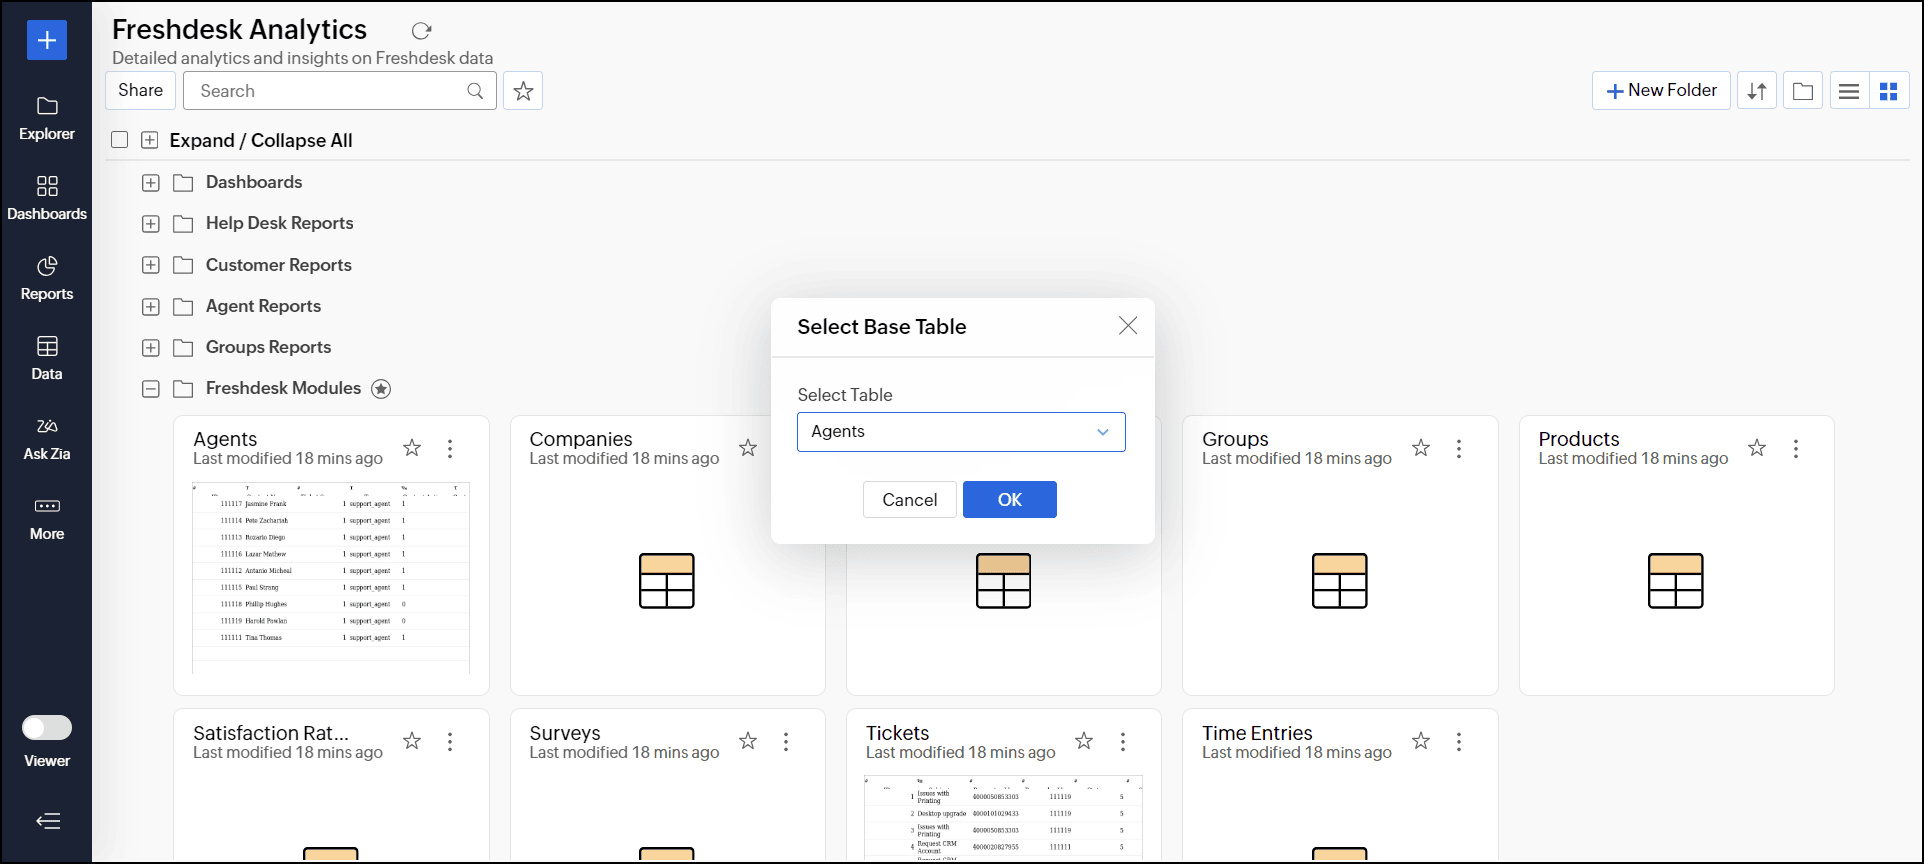
From the Explorer window: Open the desired workspace, click the + (Create) button on the left side panel, and choose the With Auto Analysis option. In the pop-up that appears, select the desired table and click OK.
Working with auto-generate reports and dashboards
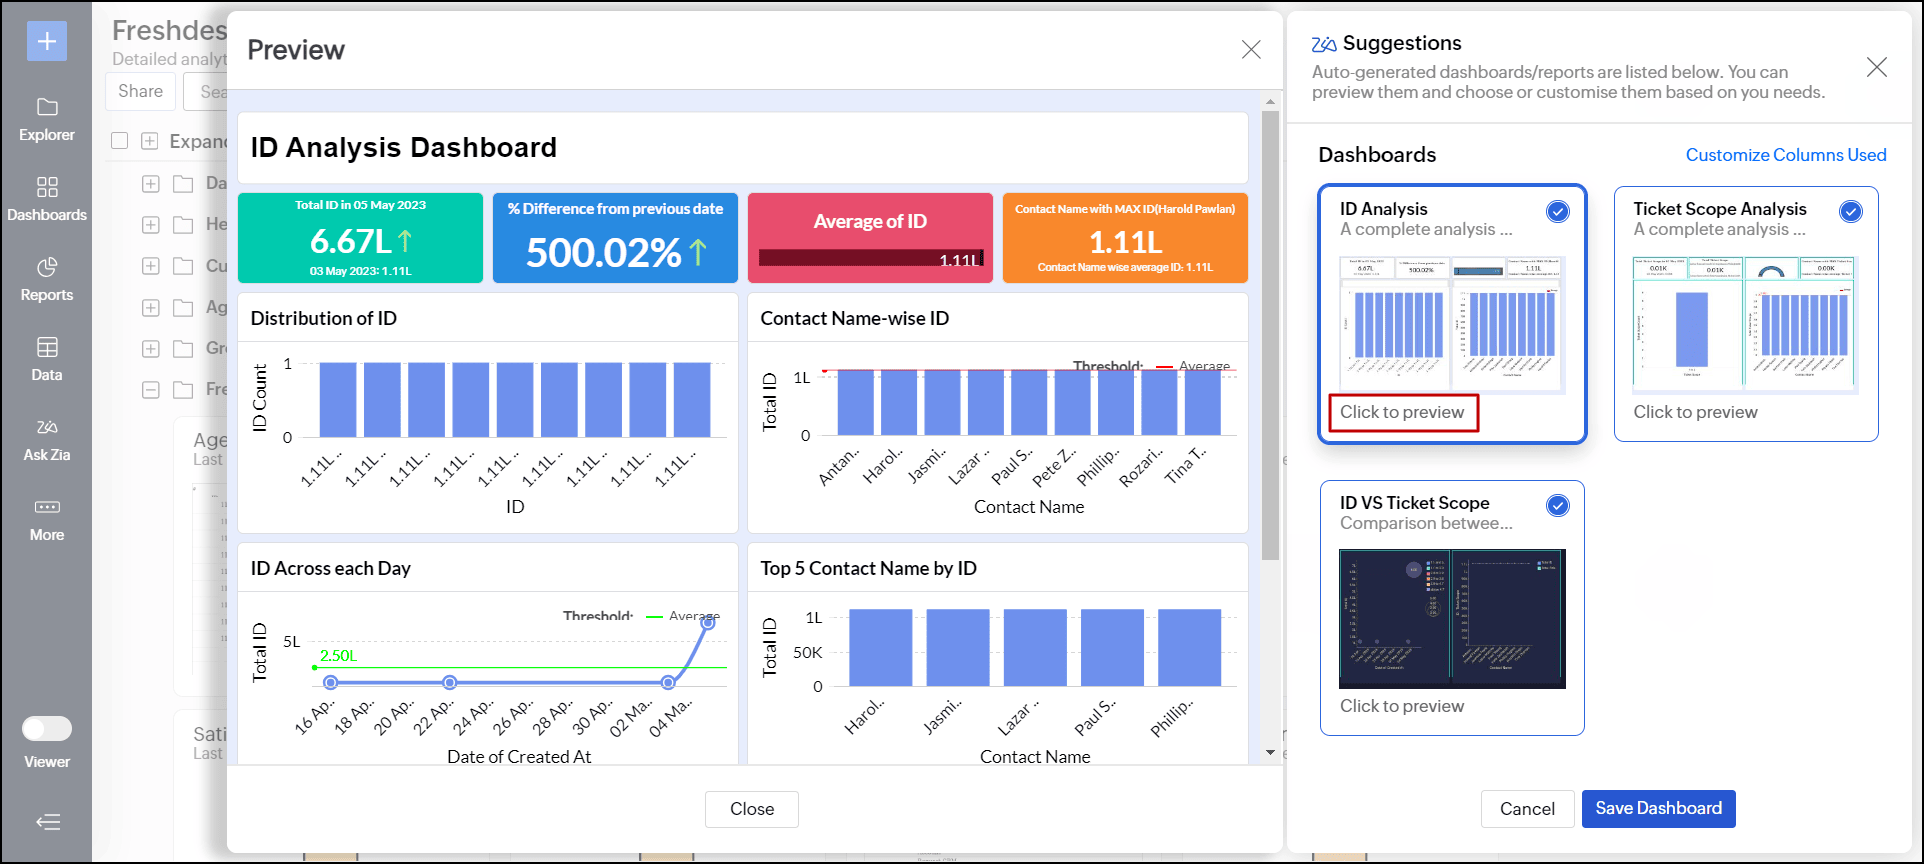
Analytics Plus analyzes the schema of the table data, identifies key metrics, measures, dimensions, and date columns, and automatically generates reports and dashboards.
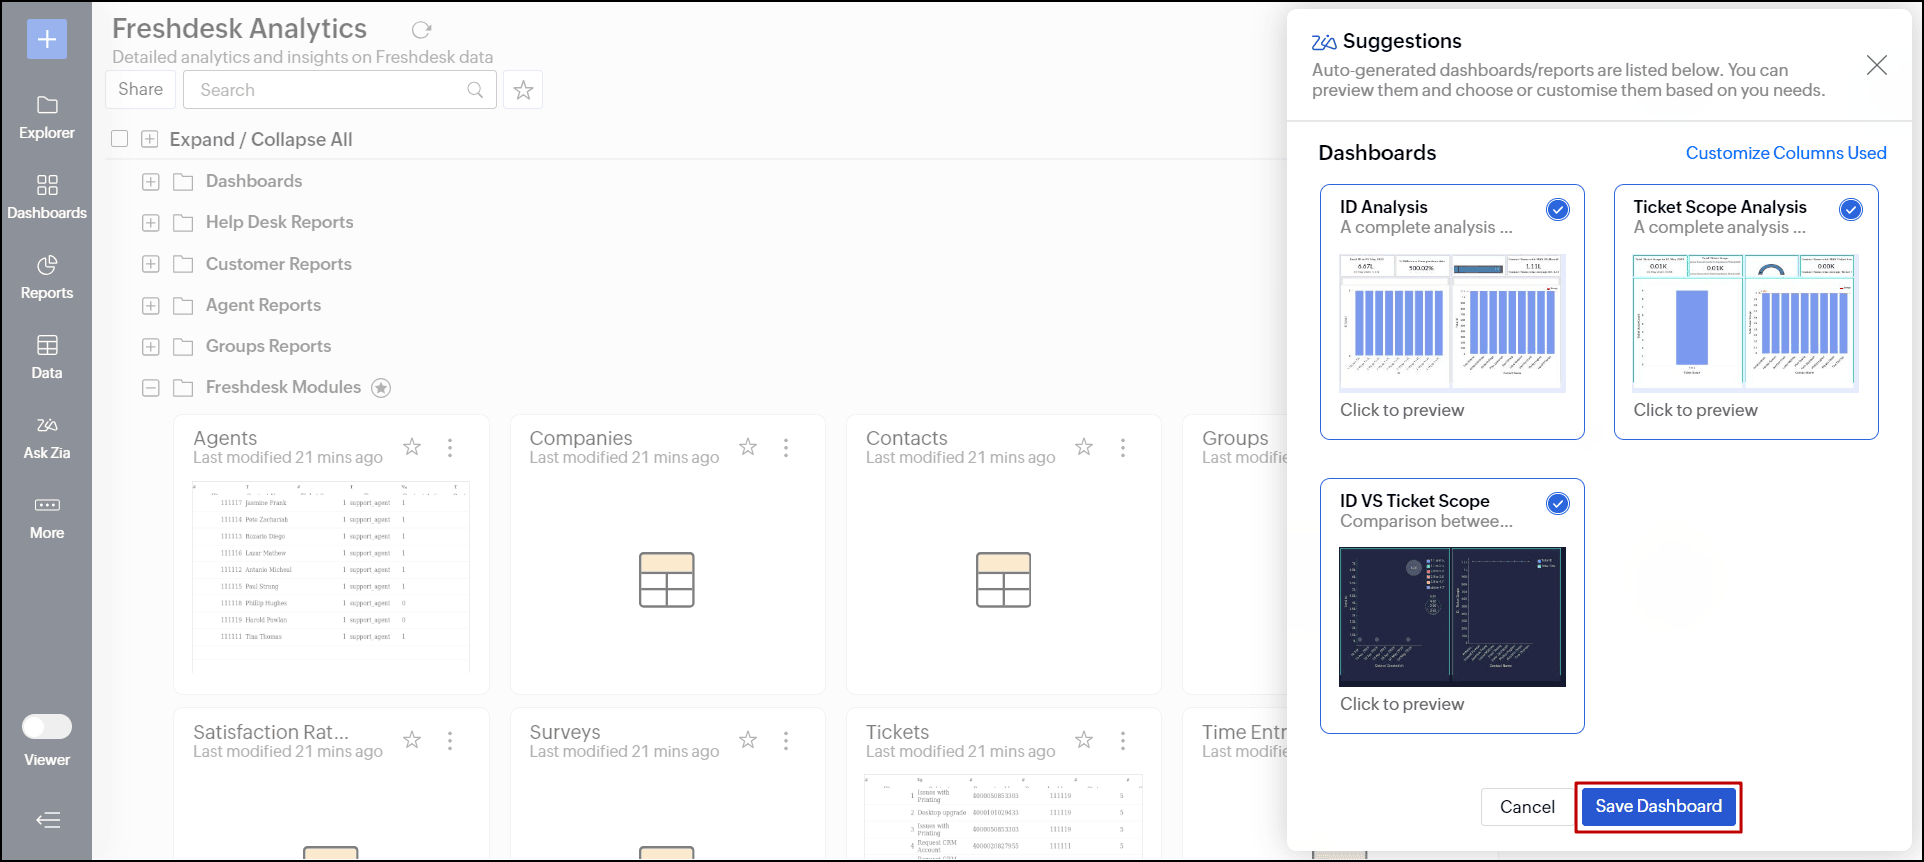
Click the Click to preview link at the bottom of each dashboard for a quick glimpse of the reports included in the dashboard.
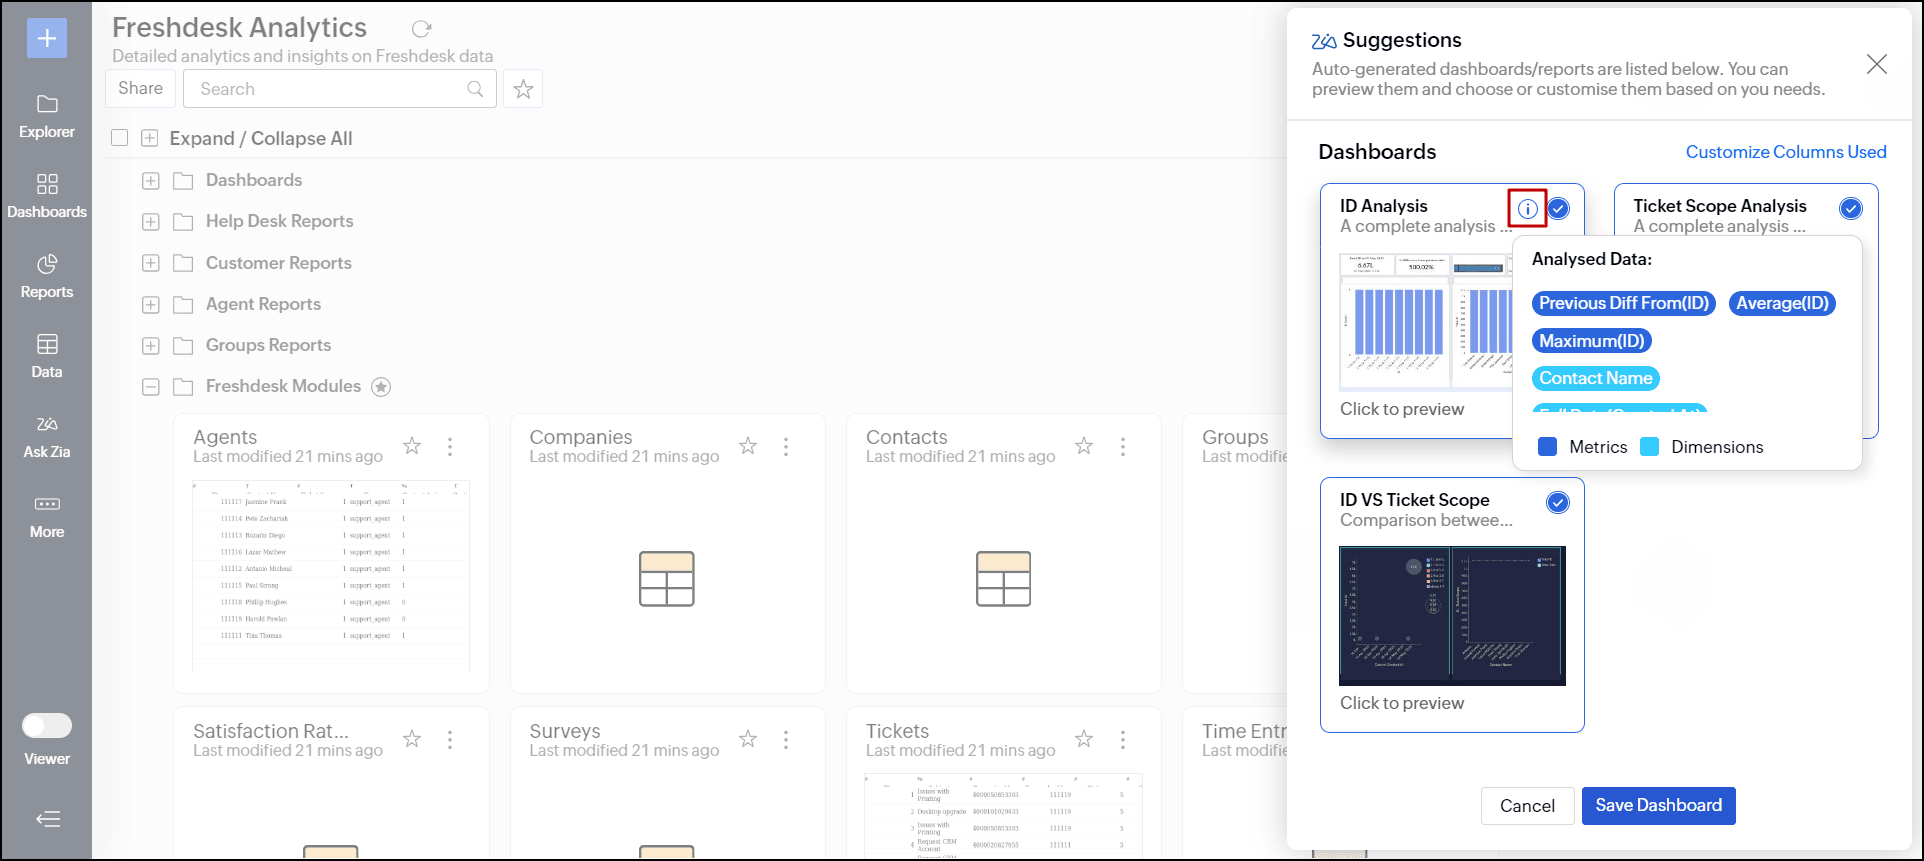
Click the info icon that appears when hovering over the desired dashboard to view a list of functions applied to the data. Functions applied to Metric columns are highlighted in dark blue, while Dimension columns are marked in aqua blue.
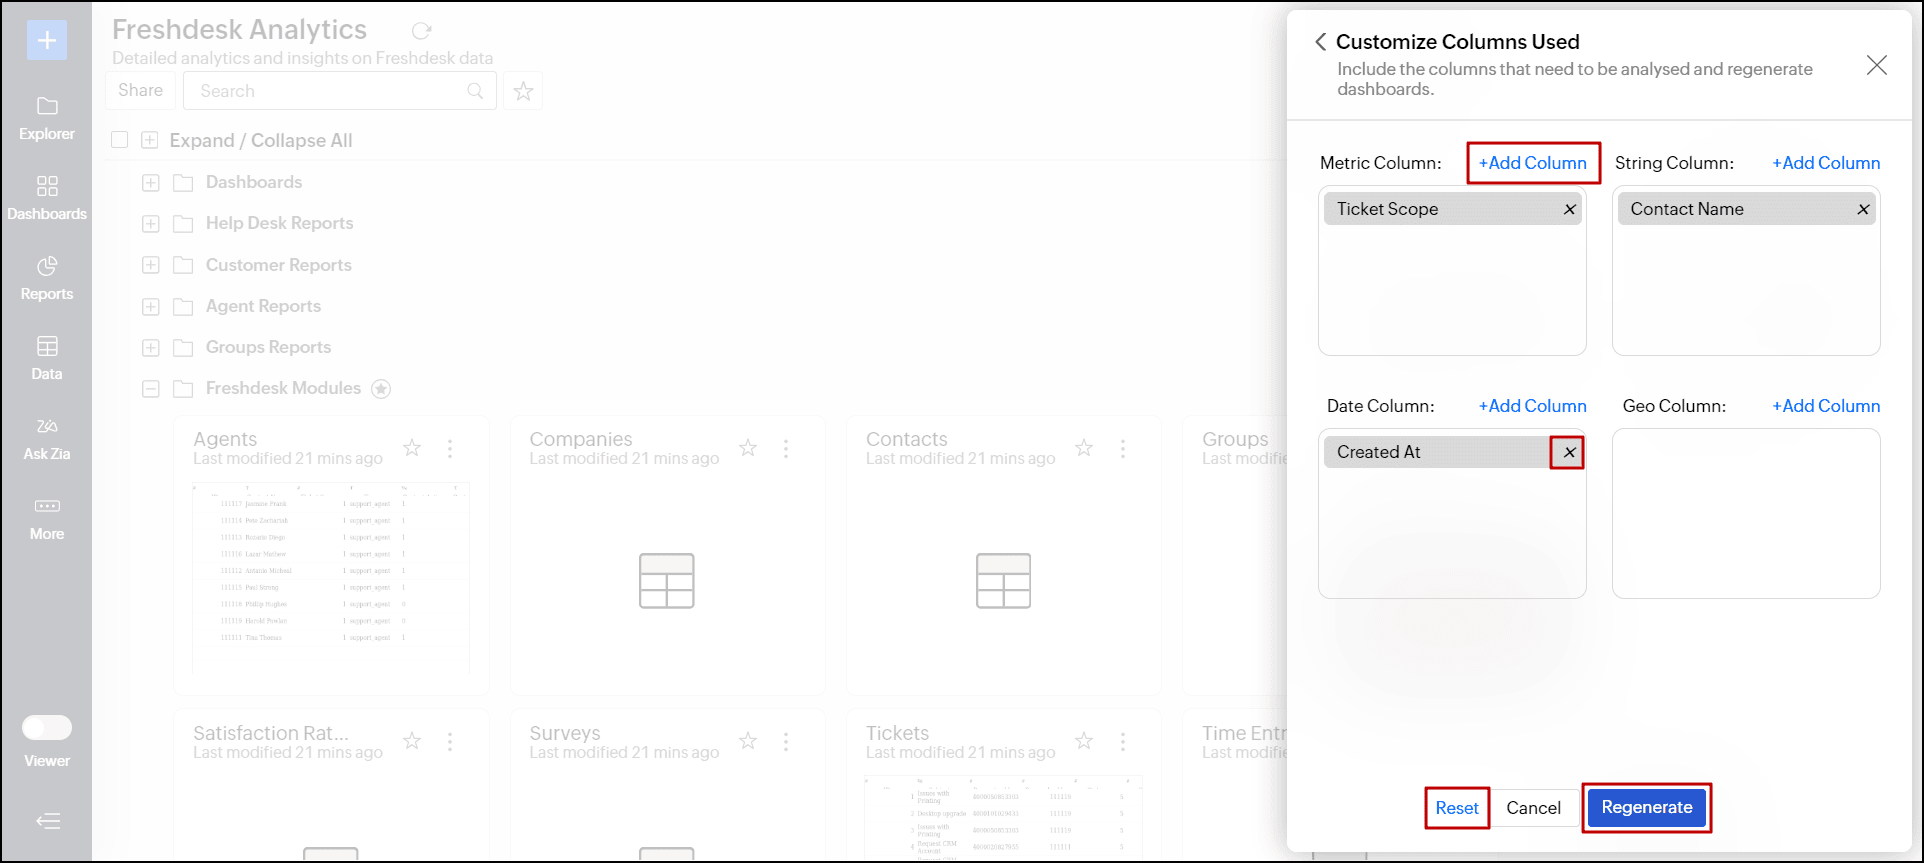
Analytics Plus empowers you to customize the columns used for analysis through the Customize Columns Used option.
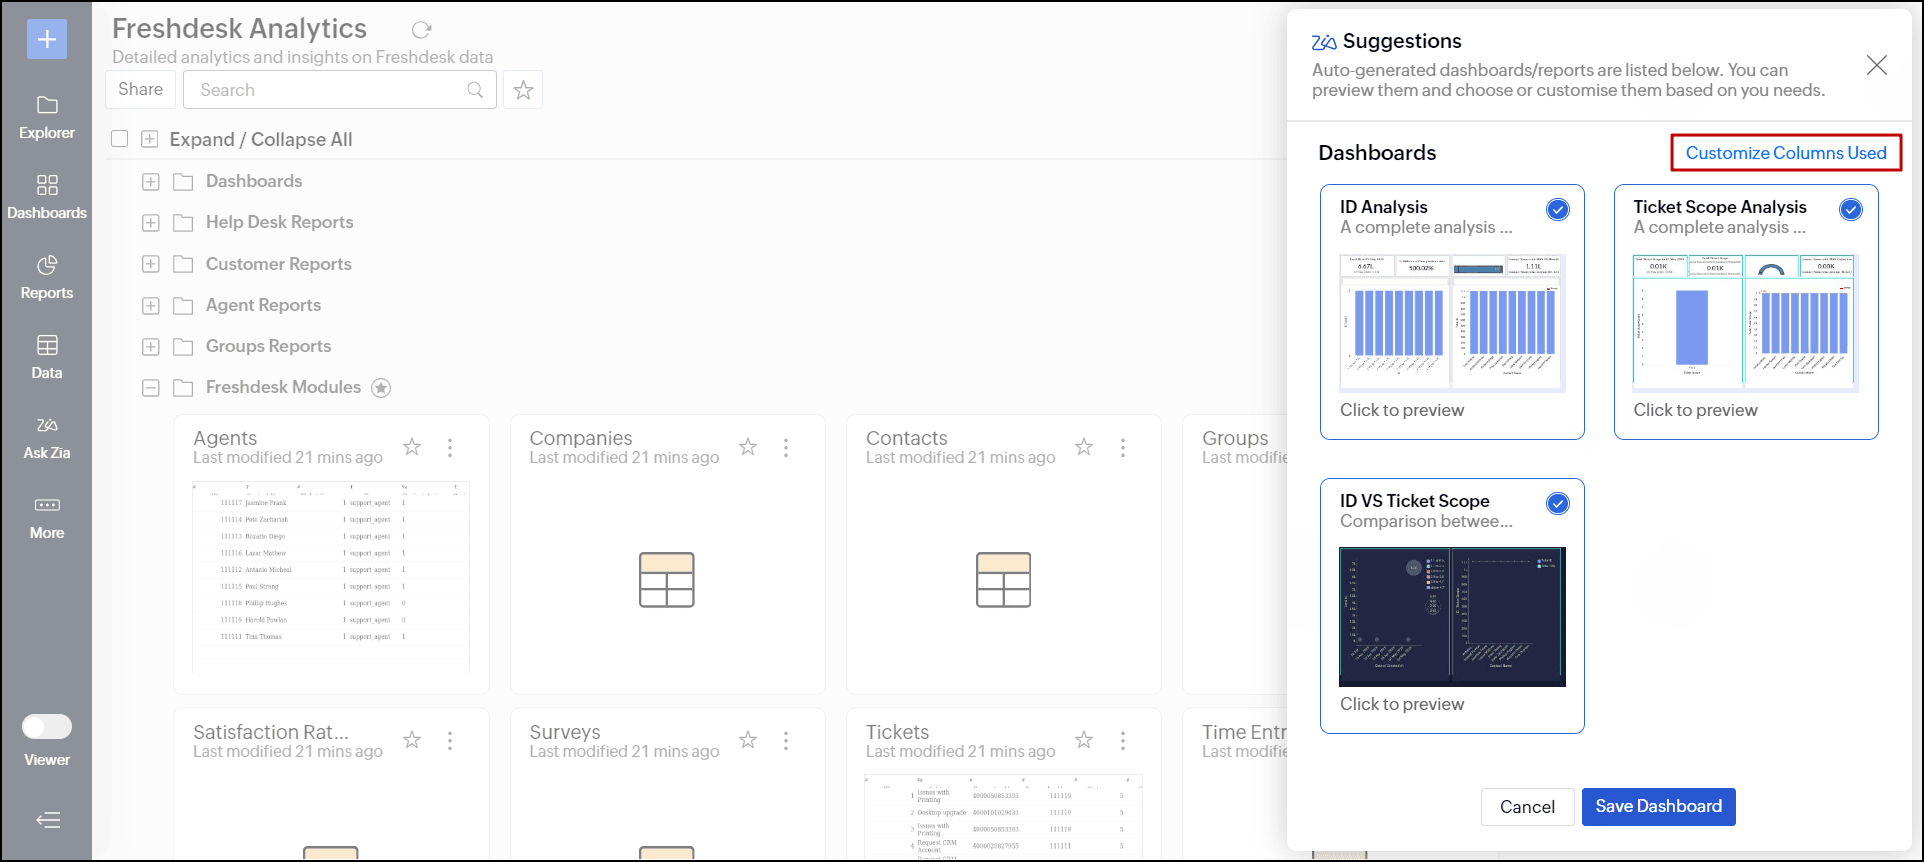
Columns are categorized based on their data type for easy navigation. Click + Add Column to include additional columns in your analysis, and use the remove icon to exclude any columns from the report. Click Regenerate to generate dashboards based on the changes made. Click the Reset link to revert to the original settings.
Finally, select the desired dashboard and click the Save button to add the reports and dashboards to the workspace.
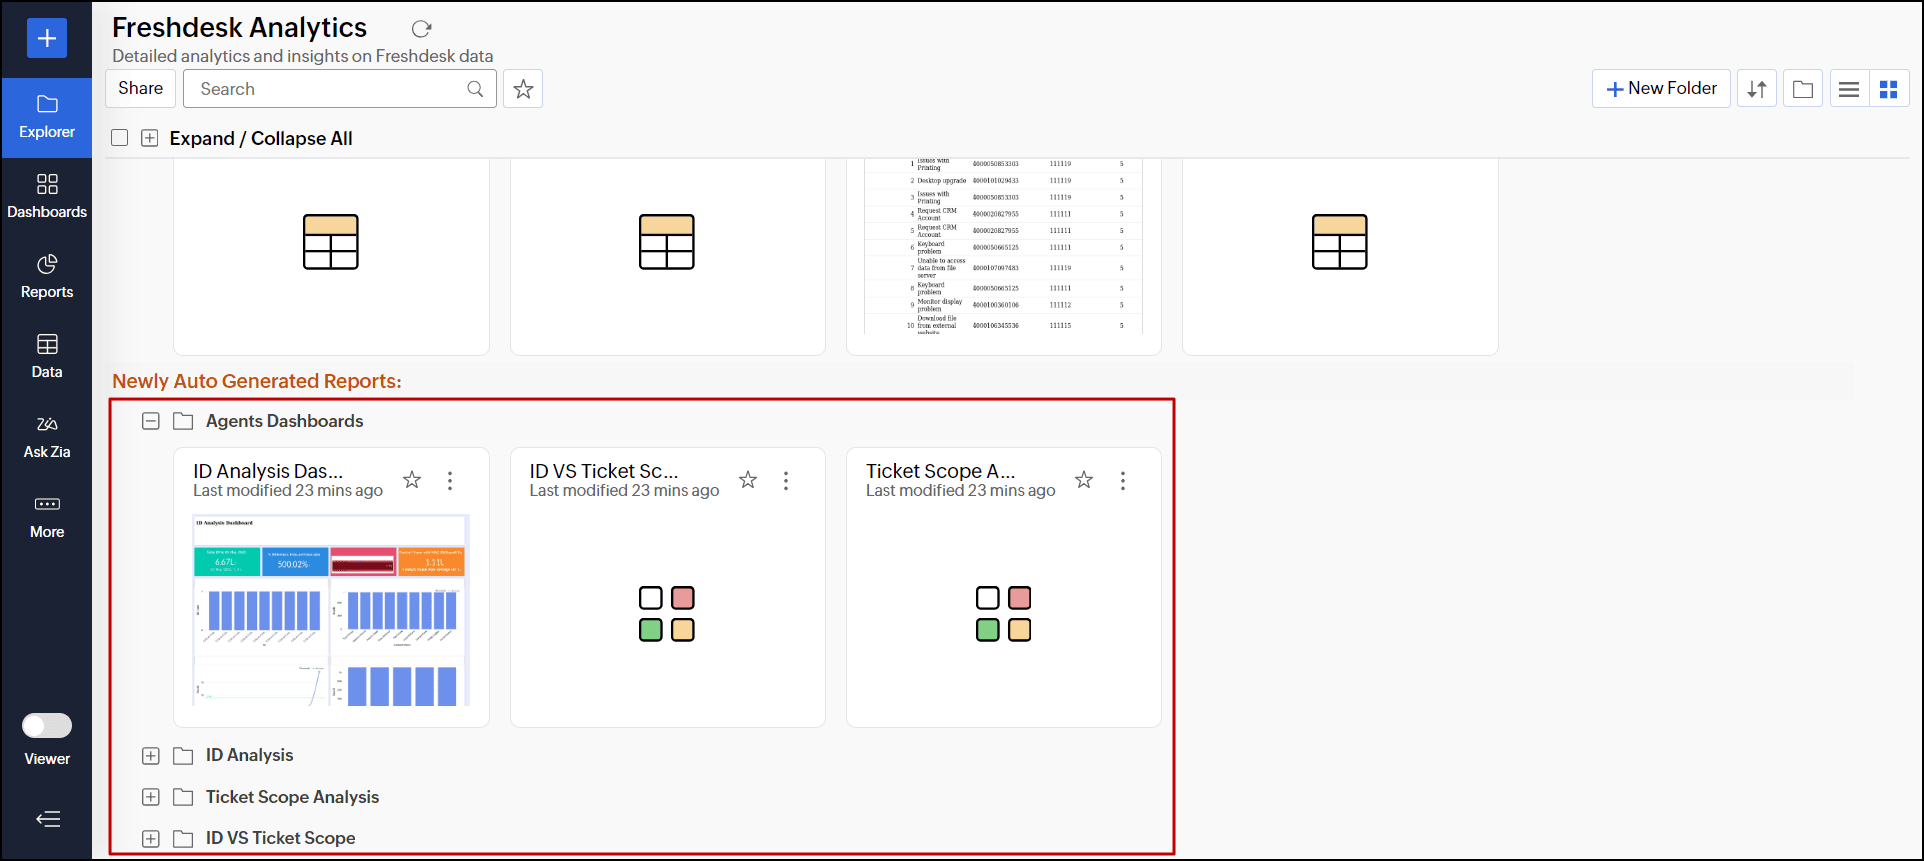
The auto-generated reports and dashboards are organized into folders.
Similar to another table
The Similar to Another Table option simplifies the report creation process by allowing you to recreate existing reports without having to start from scratch. For instance, if you import a new data set into Analytics Plus that closely mirrors an existing one and wish to create similar reports for the new data set. You can now utilize the Similar to Another Table feature to regenerate reports using the existing ones.
Prerequisites
The following are the prerequisites to use the Similar to Another Table option.
- Structural similarity: Both the source and destination tables must be structurally similar. This means that the destination table should have the same column names and data types as the source table.
- Column availability: The columns used for report creation in the source table must also be present in the destination table. If the destination table contains additional columns not found in the source table, reports will only be generated for the columns that exist in the source table.
Generate reports
- Open the desired table for which you need to generate reports.
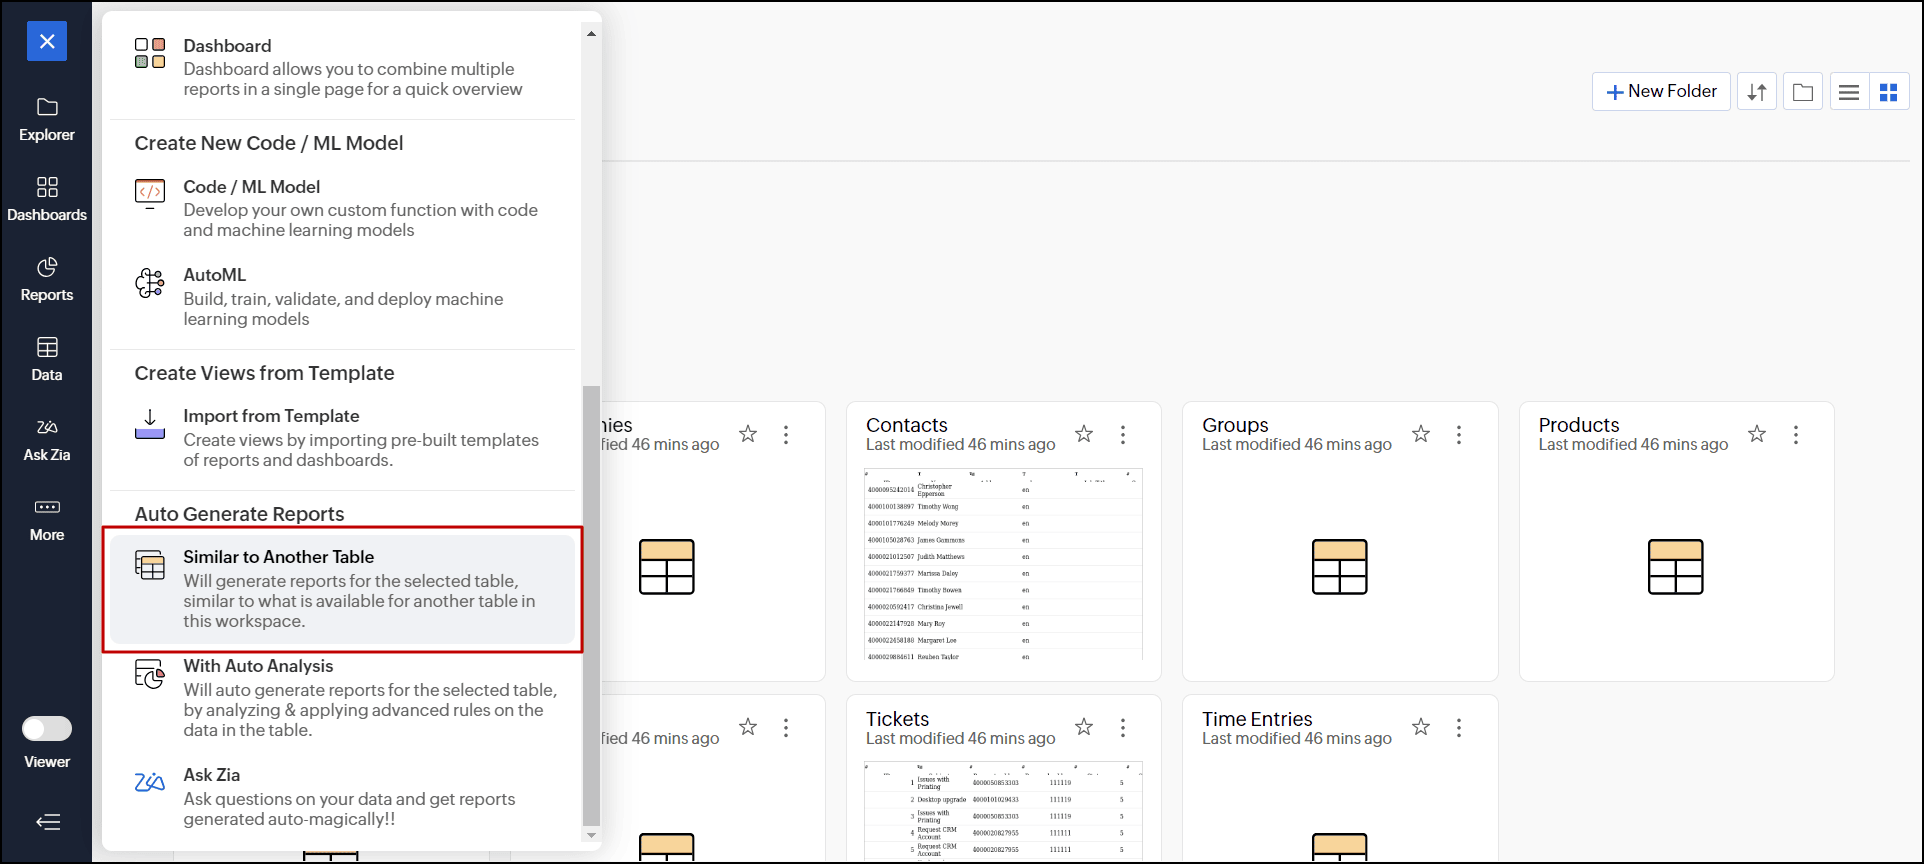
- Click the + (Create New) button and choose the Similar to Another Table option.
You can also do this from the Explorer window, click the + (Create) button on the left side panel, and choose the Similar to Another Table option. In the pop-up that appears, select the table for which you need to generate reports from the Select table to generate reports drop-down.
- Select the source table whose reports and dashboards you wish to recreate using the Select reference table drop-down.
- Choose a destination folder where the reports must be saved from the Folder to save generated reports drop-down.
- In case formula columns have been created over the source table, you can choose to recreate them in the destination table by selecting the Formula Column and Aggregate Formula checkboxes.
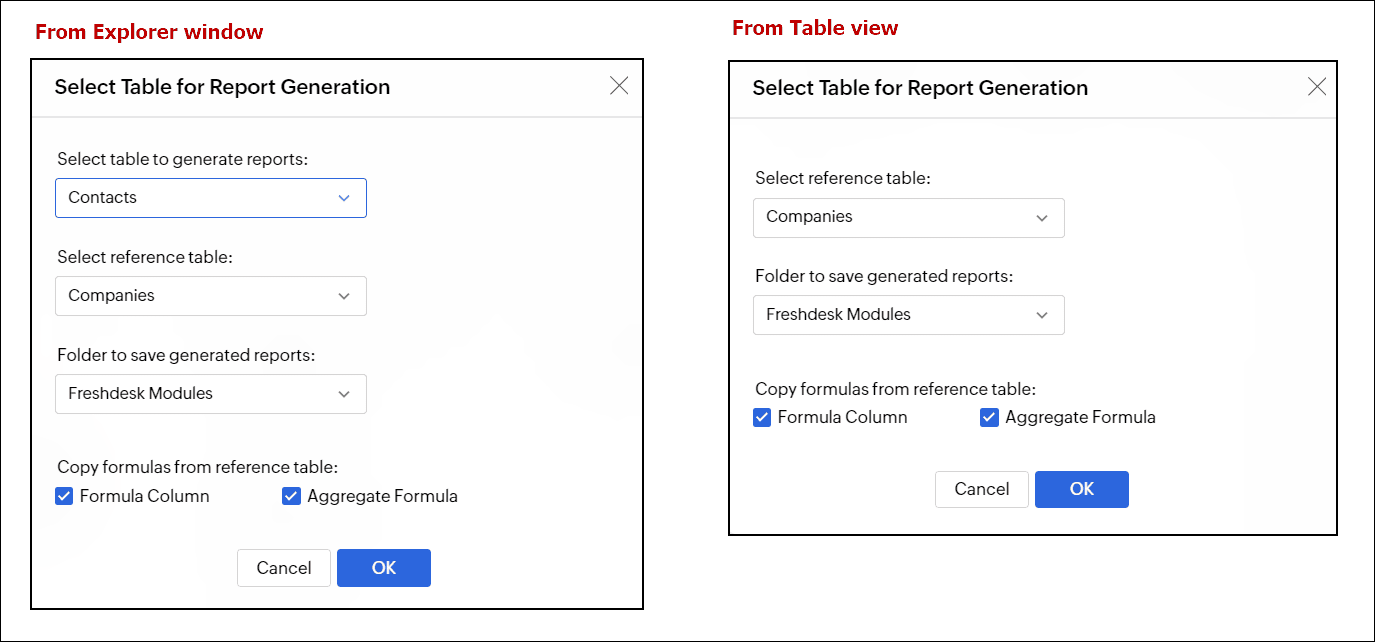
- Click OK.
Once the report creation is successful, a Report Creation Summary dialog will appear, displaying the number of reports and dashboards generated. The created reports and dashboards will be organized within the specified folders.
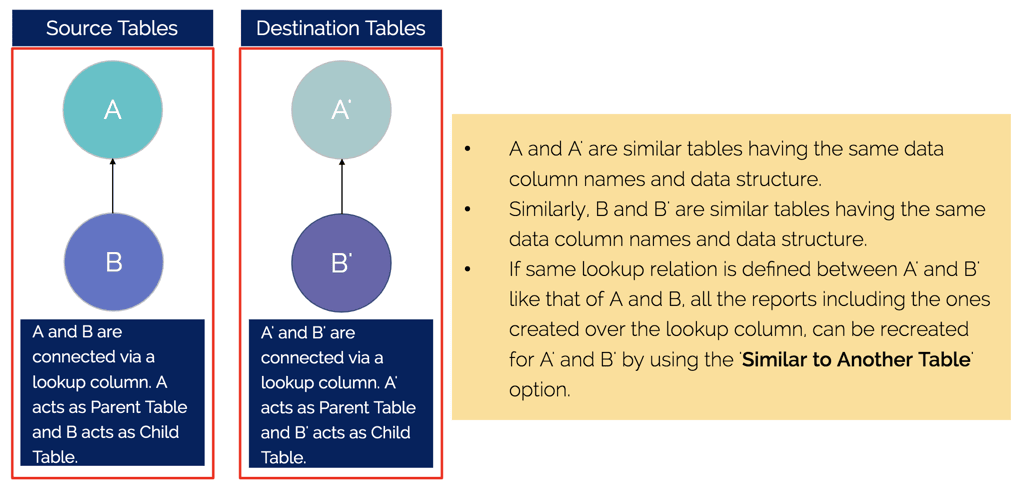
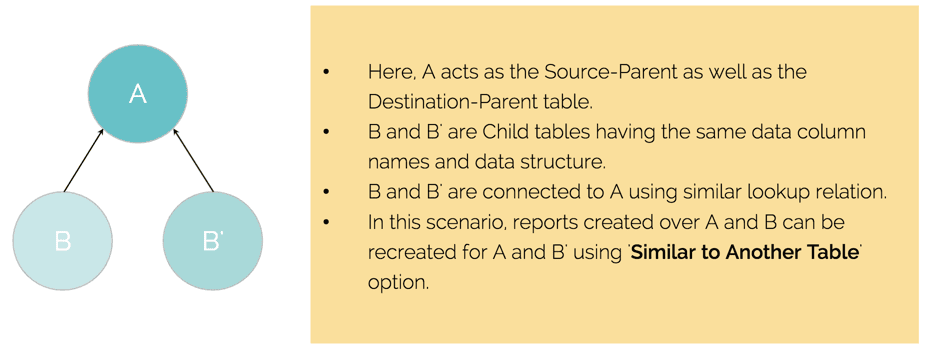
Creating reports for tables connected using lookup columns
For tables that are interconnected using lookup columns, the below conditions should be met to use the Similar to Another Table option.
- The source and destination tables should be structurally similar (same data type and column names).
- The lookup relation defined between the source tables must be defined between the destination tables to replicate reports successfully.
Troubleshooting tips
For Similar to Another Table
- Error message: Only One Table Found. Report generation is not possible. Only table found in the workspace is <Table_Name>. Require at least another table to generate similar reports.
Reason: This issue arises because there is only one table in your workspace. The Similar to Another Table function requires at least two tables with the same structure to be present in the workspace.
- Error message: Unable to generate reports. Report generation failed due to table structure mismatch. Columns are mismatching between <Table_Name_1> and <Table_Name_2>. Please verify the column names and data types in both the tables.
Reason: This issue occurs because your source and destination tables do not share the same structure, meaning their column names and data types are different. Make sure that both tables have identical structures and matching column names. For more information, please refer to the Similar to Another Table section.

