Creating Summary Views
Analytics Plus allows you to summarize large amounts of data dynamically for easy analysis. With the intuitive drag-and-drop interface, you can easily transform data into interactive and meaningful summaries.
Creating a summary view
To create a summary view in Analytics Plus, follow the steps below:
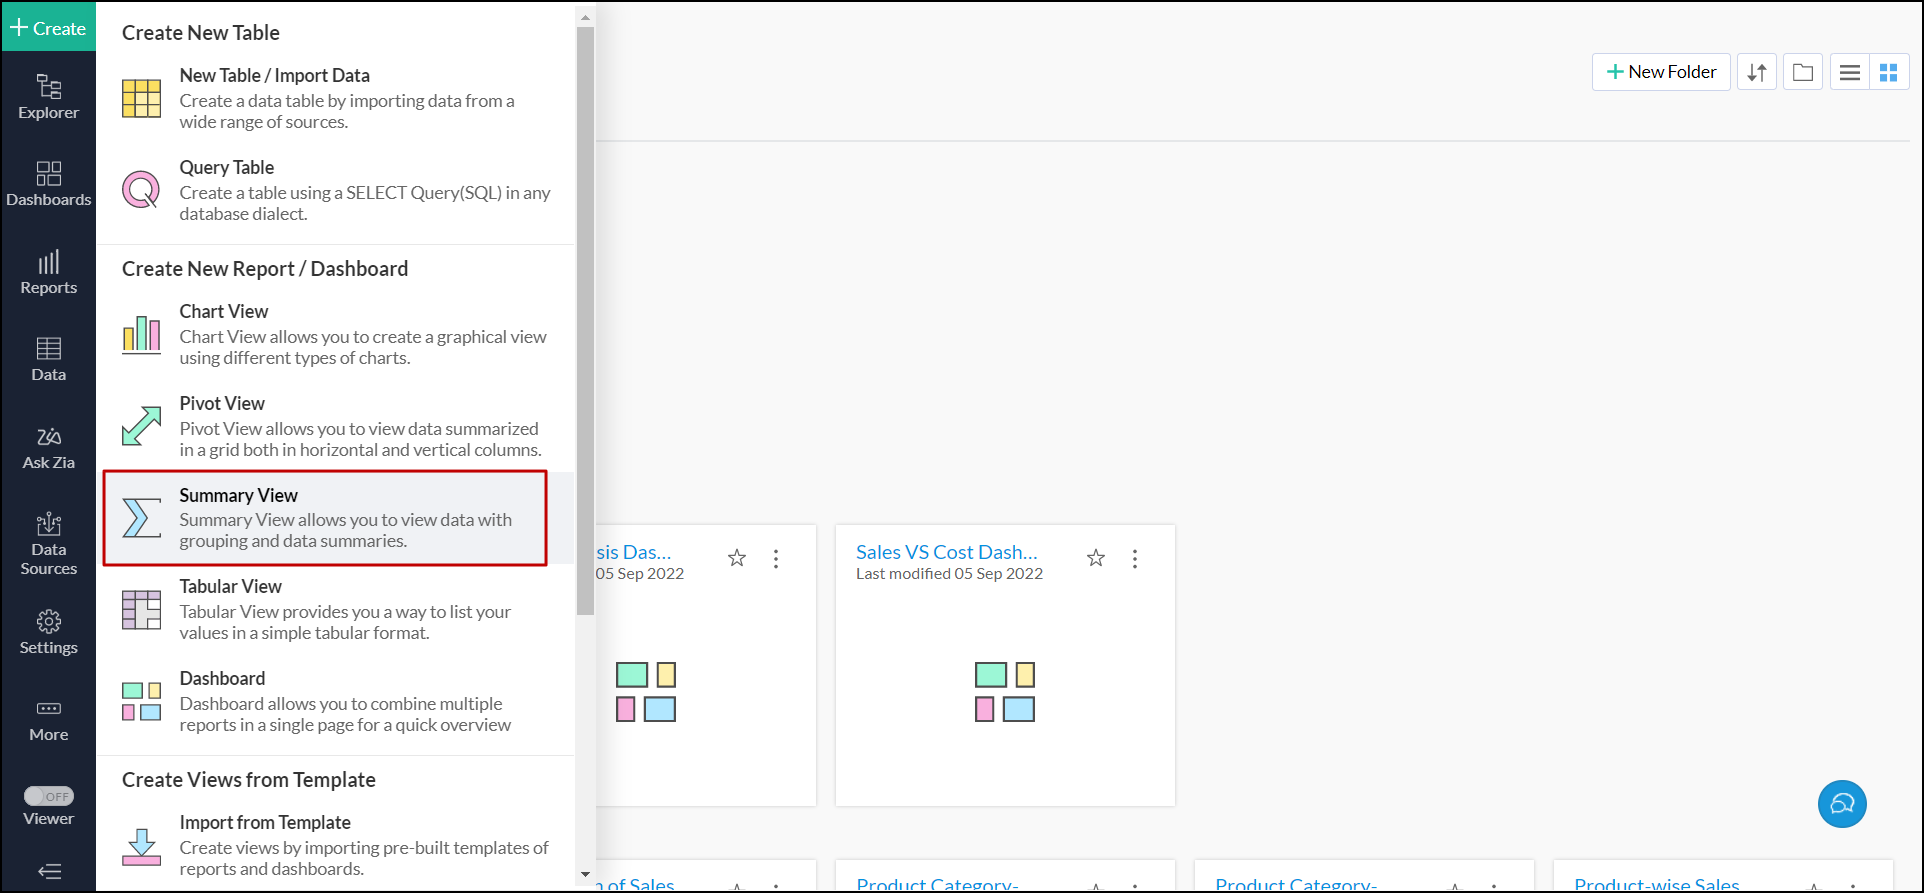
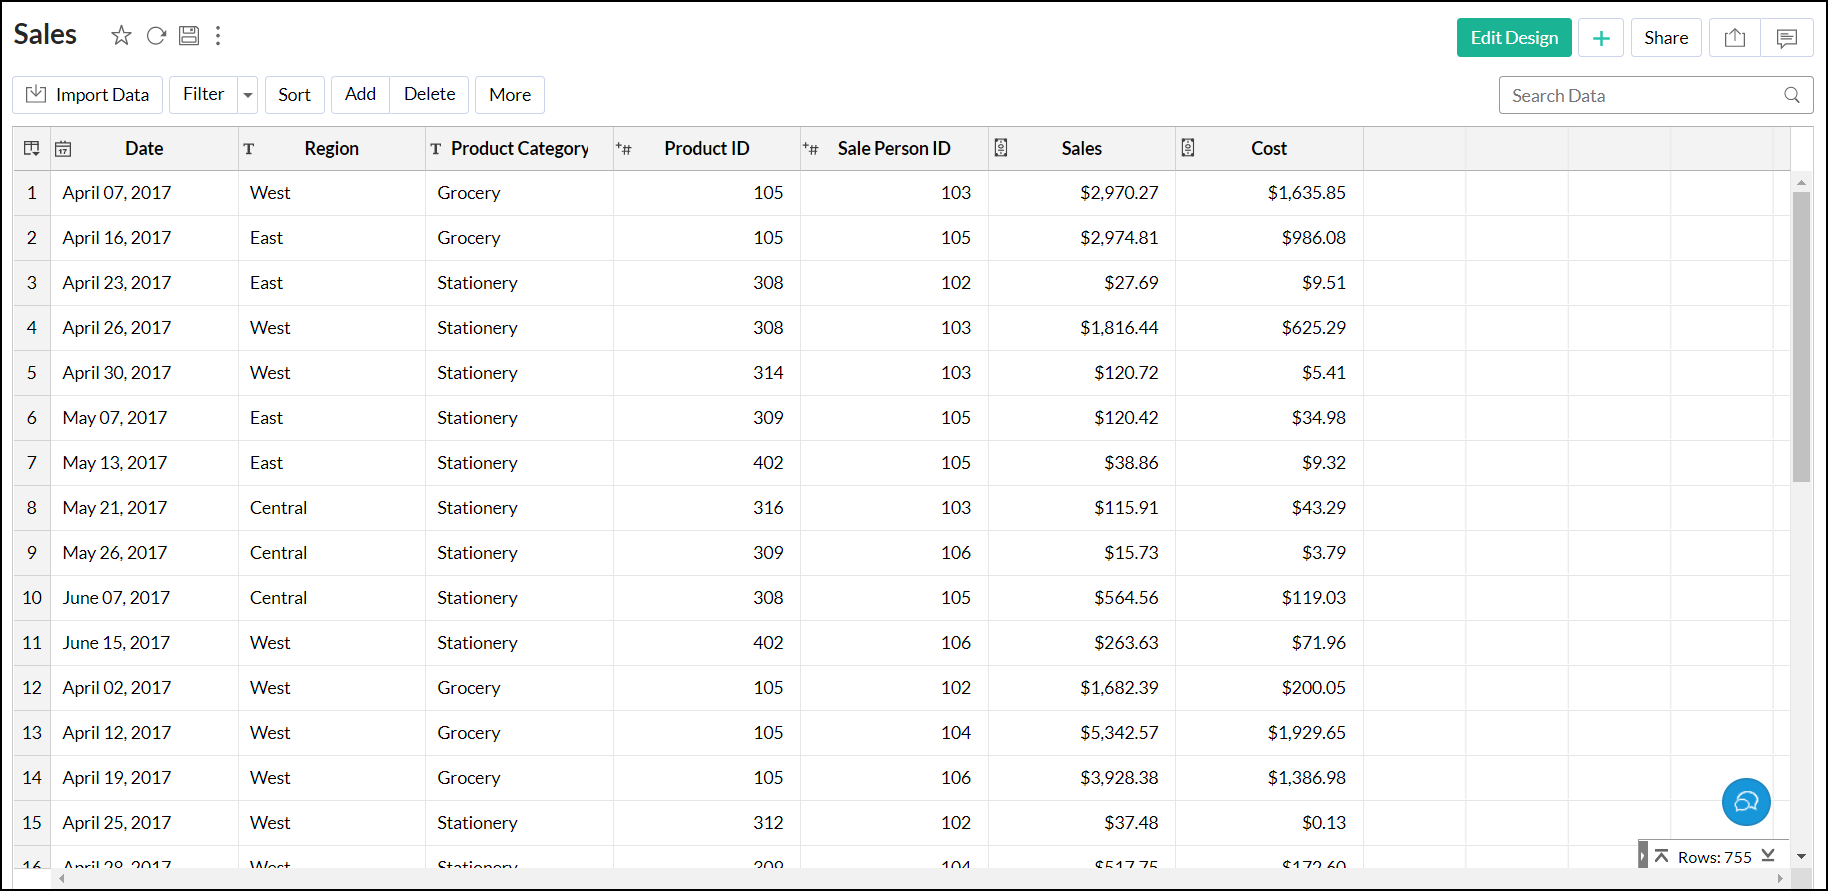
- Open the required workspace, click + Create from the side pane, and choose Summary View.
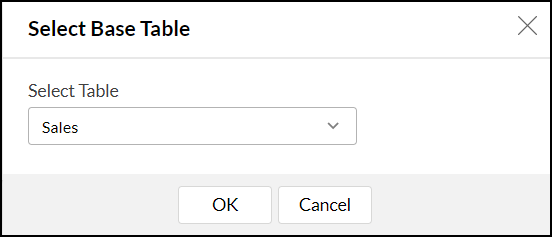
- In the pop-up that appears, choose the required table from the drop-down, and click OK.
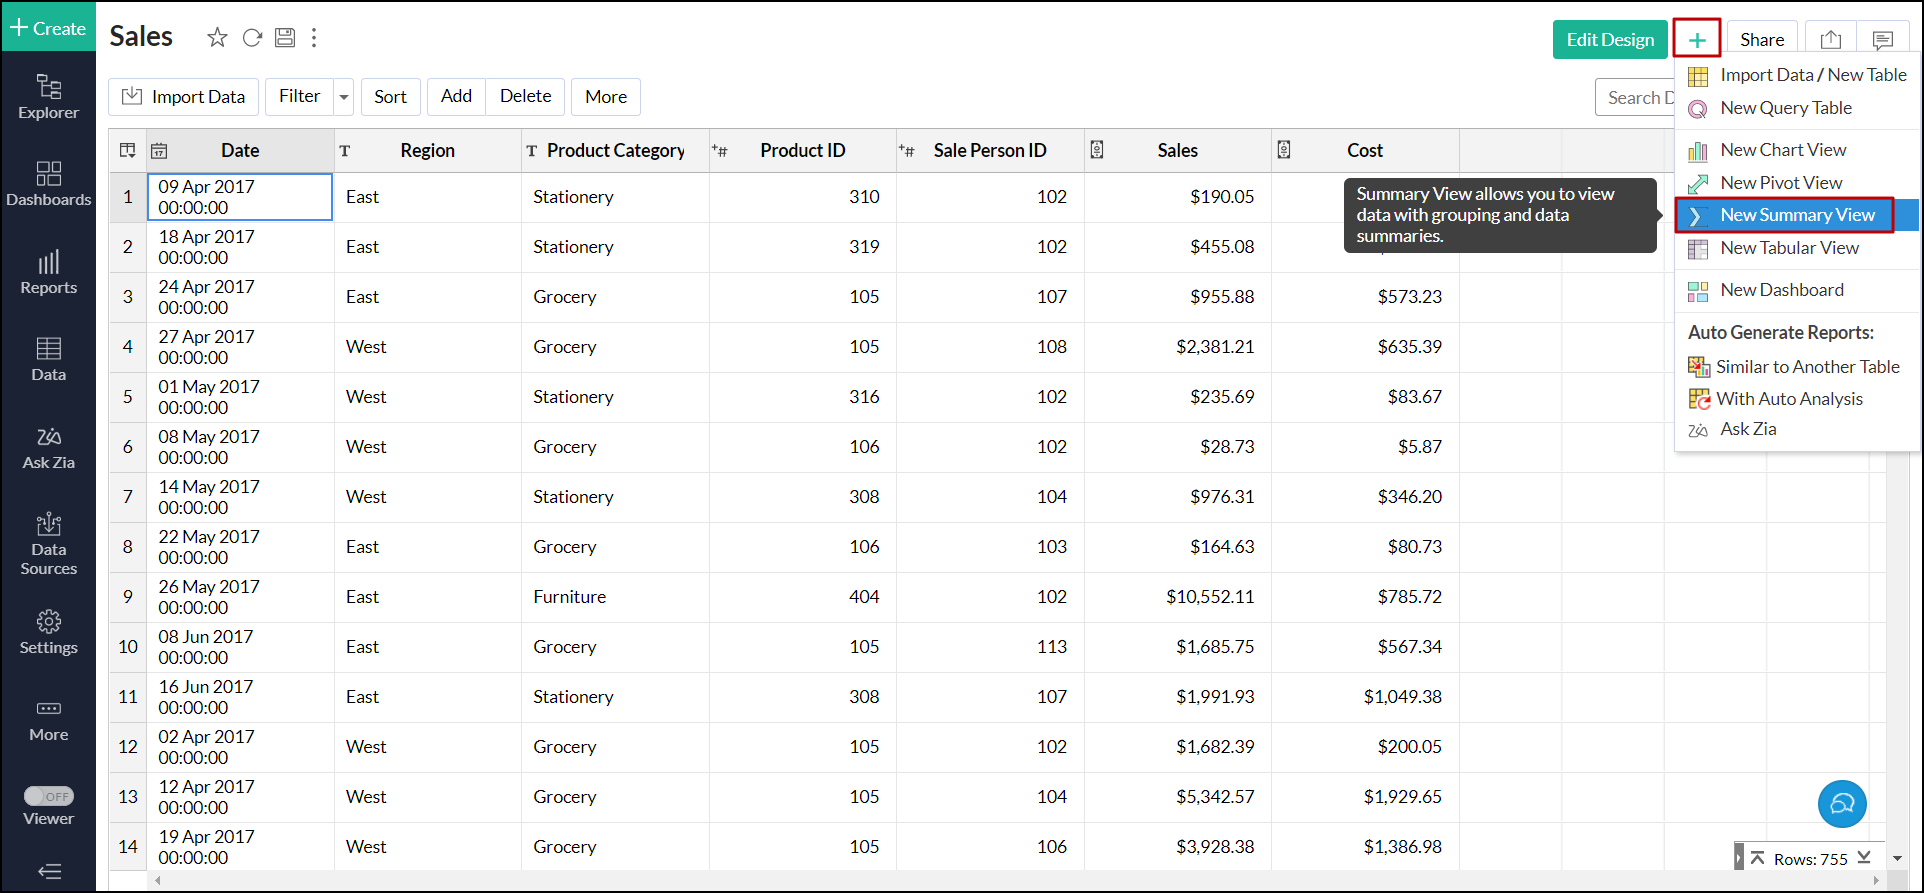
You can also create a new summary view by opening the required table and clicking the + (Create New) > New Summary View option.
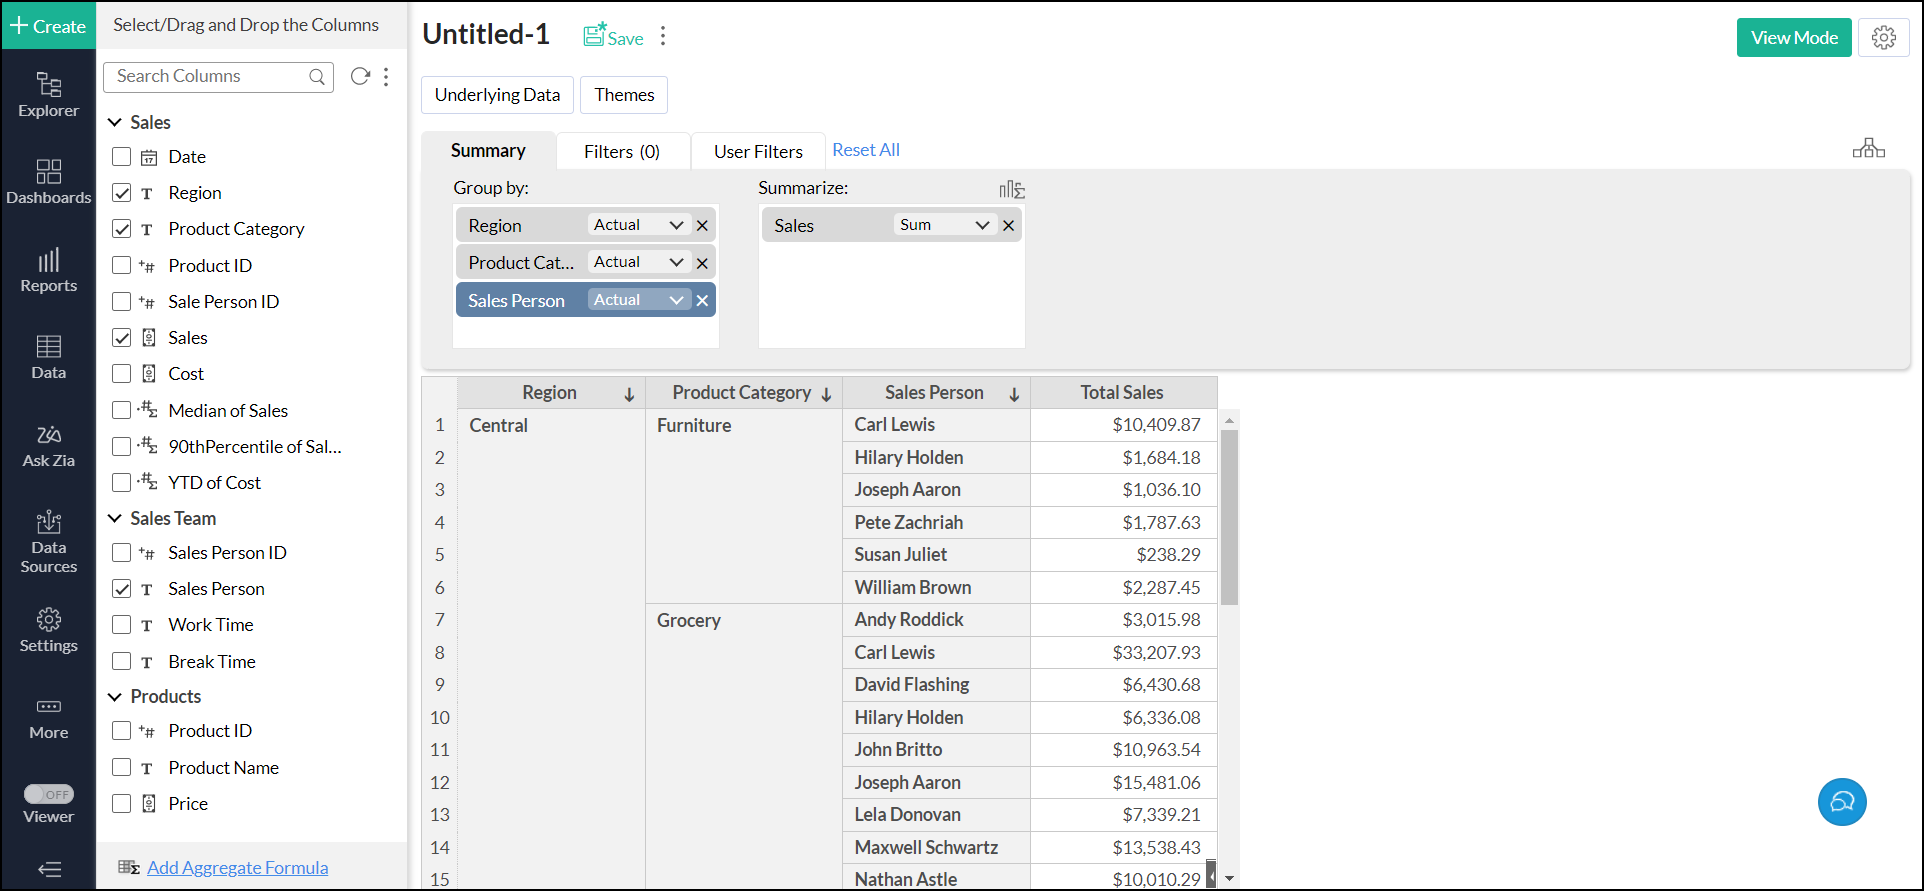
- In the Edit Design window that opens, drag and drop the required columns from the left pane to the corresponding shelves in the design area.
You can also select the checkbox beside each column to place the columns on the appropriate shelves automatically.
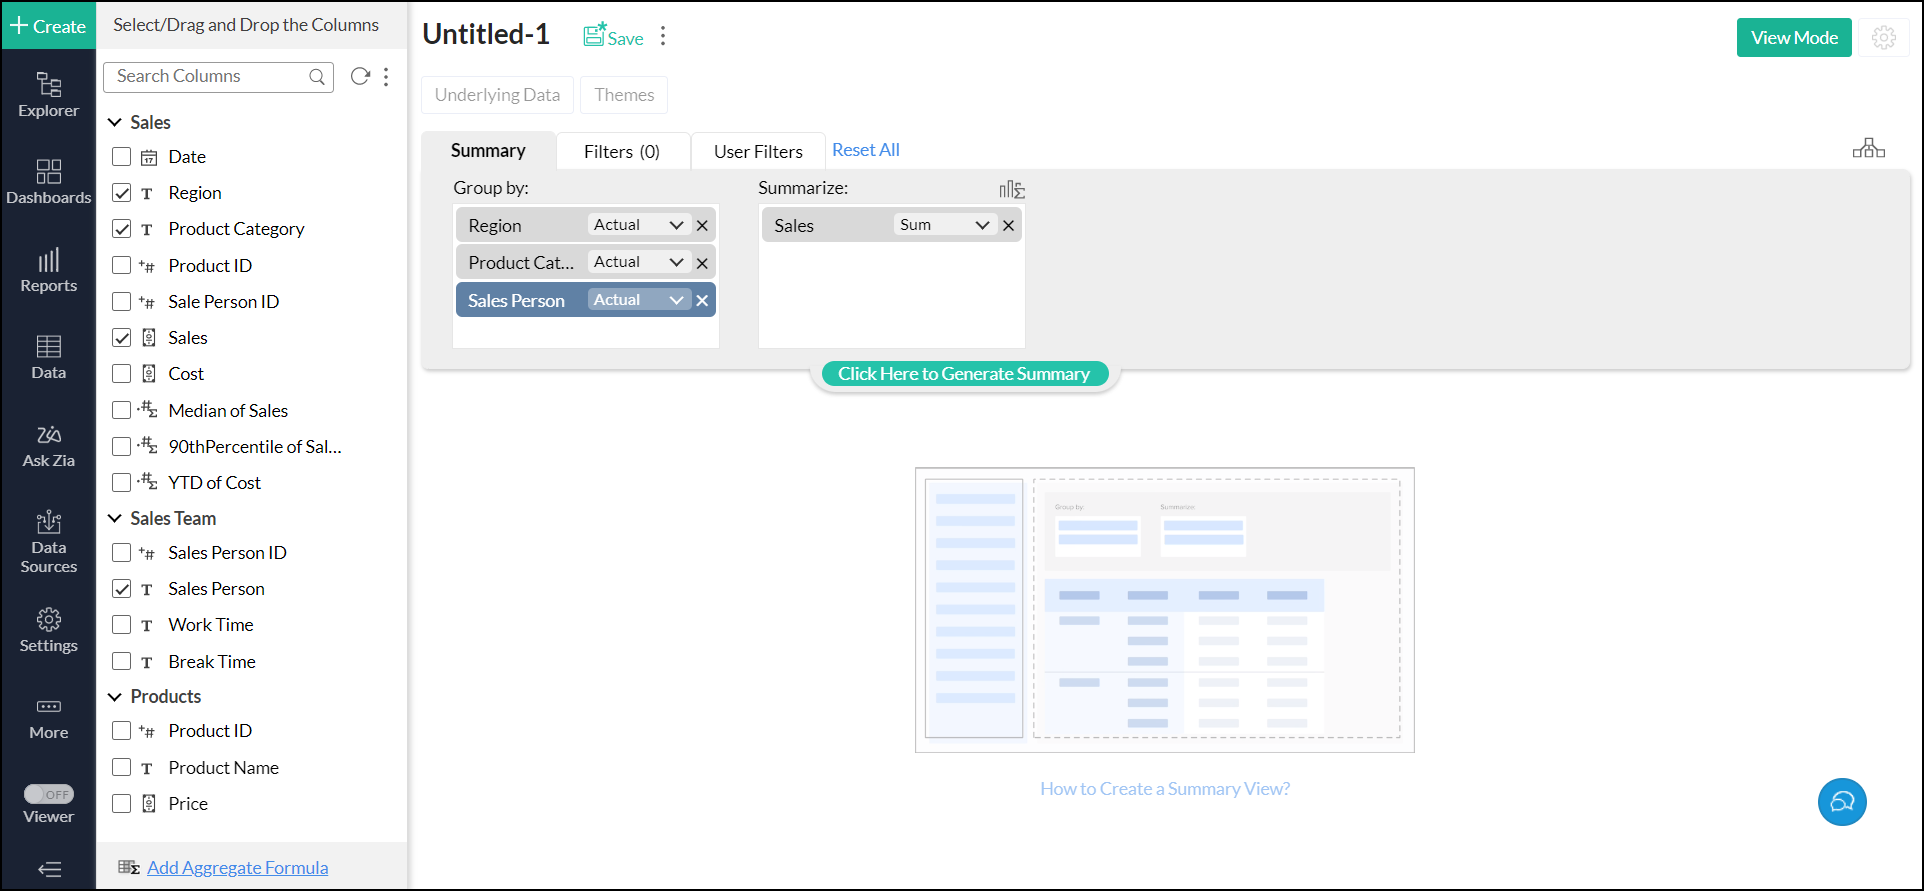
- Click the Click Here to Generate Summary button to create the summary view.
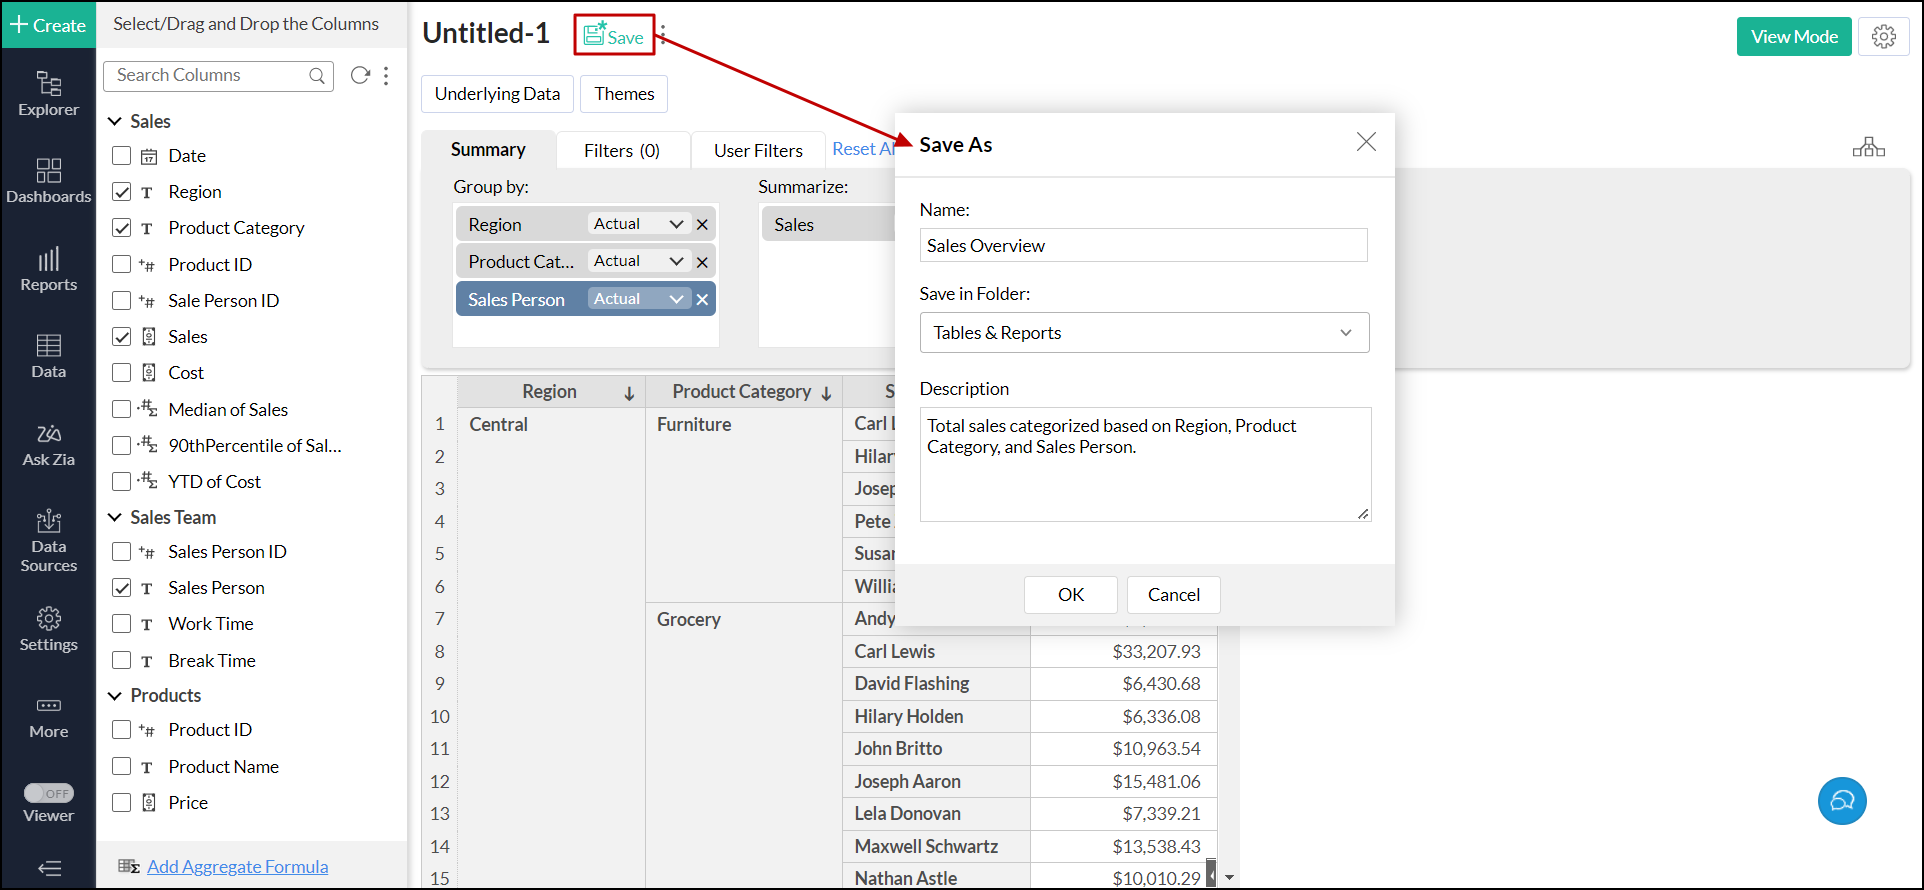
- Click the Save link that appears next to the report's name. In the pop-up that appears, provide a name and description for the summary view, choose the destination folder, and click OK.
Shelves in the summary view
The following is a brief description of each shelf in a summary view:
- Group by shelf: The columns dropped on this shelf are grouped based on the unique values present in the column.
- Summarize shelf: Distinct values present in the columns dropped in this shelf will be summarized based on the selected summary function.
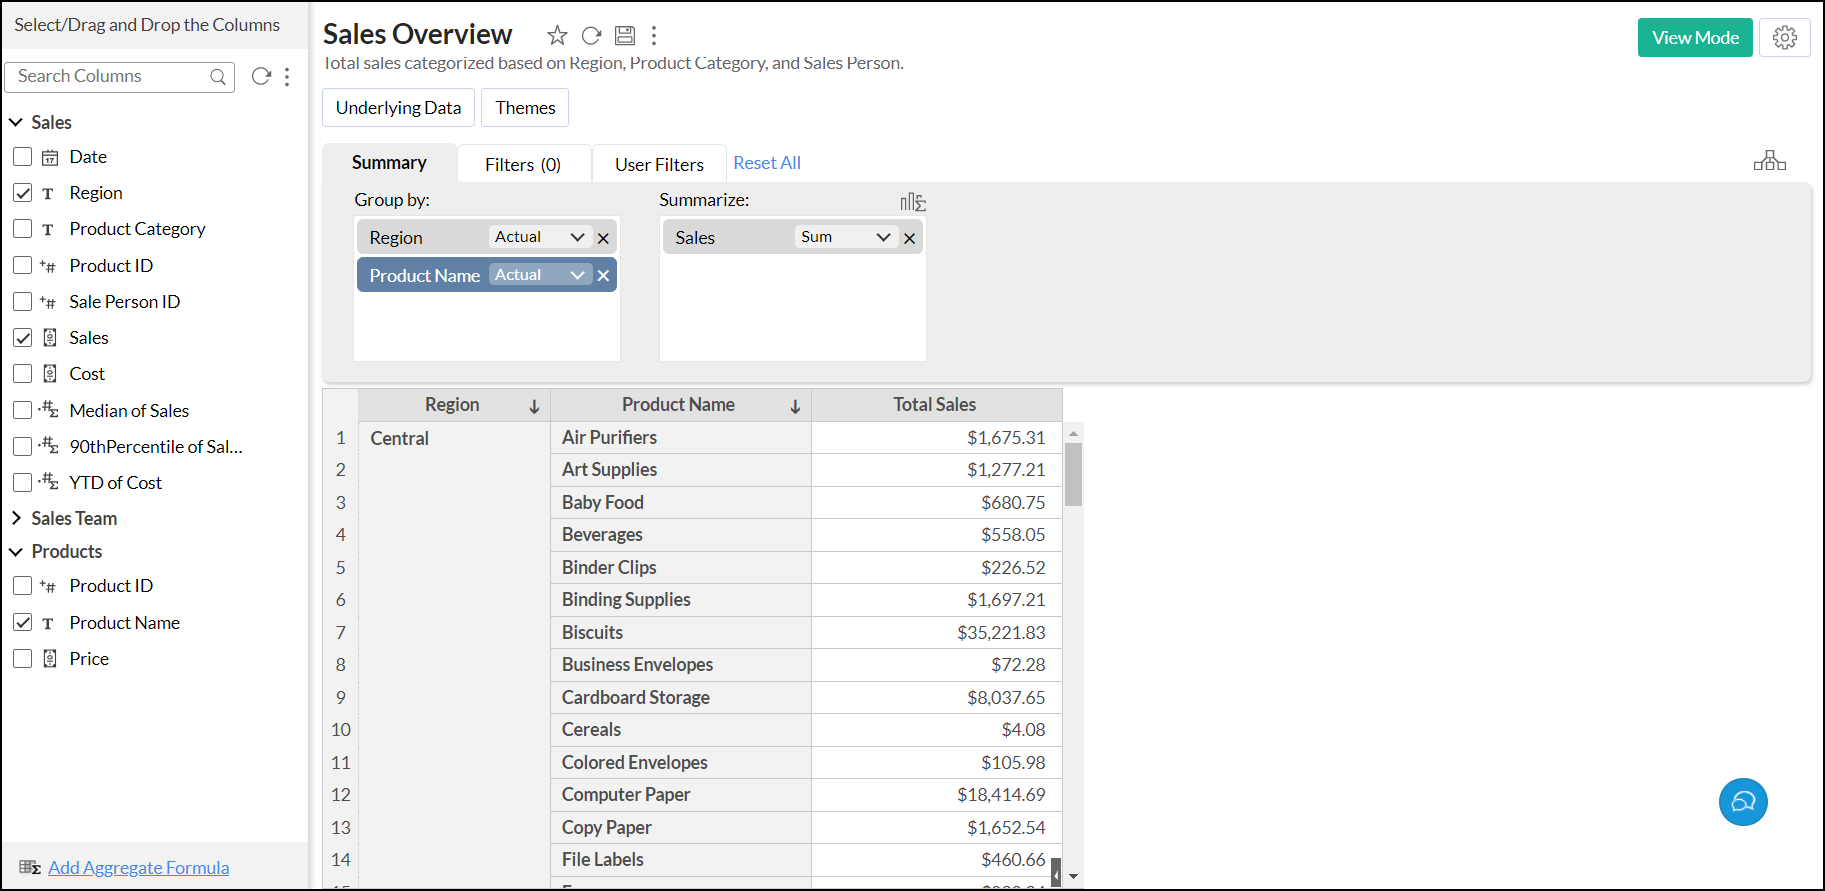
To know about the working of shelves, let's create a summary view that summarizes the sales of each product based on the region.
Drag and drop the Product and Region columns to the Group By shelf and the Sales column to the Summarize shelf. Click the Click Here to Generate Summary button to create the summary view.
Applying functions on columns
The following is the list of functions available for Group by shelf:
| String | |
| Function | Description |
| Actual Values | All the distinct values in the column will be listed. |
| Date - Actual Values | |
| Year | Returns all distinct year values present in the column. E.g.,2007, 2010 |
| Quarter & Year | Returns all distinct quarter values present in the column. E.g., Q1 2010 |
| Month & Year | Returns all distinct month values present in the column. E.g., March 2010 |
| Week & Year | Returns all distinct week values present in the column. E.g; W1 2010 |
| Full Year | Returns all distinct dates present in the column. E.g., 1/1/2011 |
| Date & Time | Returns all distinct date and time present in the column. E.g. 01/12/2010 00:10:07 hrs. |
| Date - Seasonal Value | |
| Quarter | Identifies seasonal trends based on quarter across all years. E.g., Q1, Q2. |
| Month | Identifies seasonal trends based on months across all years. E.g., January, February. |
| Week | Identifies seasonal trends based on weeks across all years. E.g., Week 1, Week 2. |
| Week Day | Identifies seasonal trends based on weekdays across all years. E.g., Sunday, Monday. |
| Day of Month | Identifies seasonal trends based on the day of the month across all dates. E.g., 1 to 31. |
| Hour of Day | Identifies trends across hours in a day. E.g., 0 to 23hrs. |
| Numeric and Currency | |
| Dimension | Treats the values in the column as textual (categorical/dimensional) values. Returns each distinct value present as a text value. |
| Range | Groups the entire range of numeric values present in the column into multiple ranges. E.g., 0 to 100, 101 to 250, etc. |
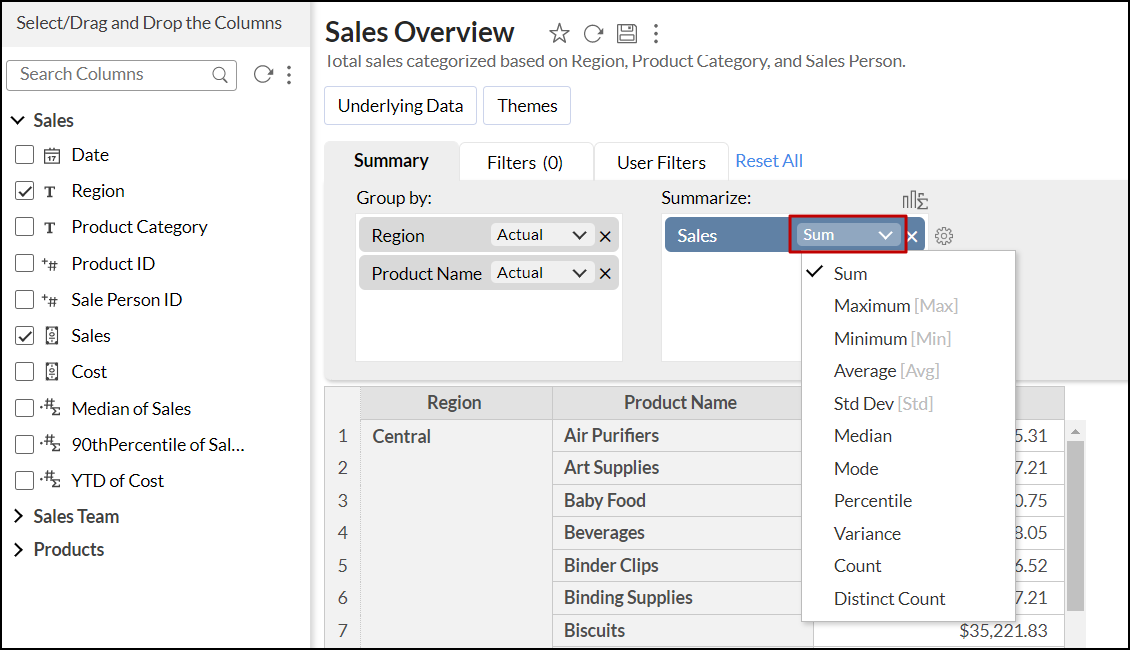
The following table lists all the functions available for Summarize shelf:
| String | |
| Function | Description |
| Count | Returns the number of values in the column. |
| Distinct Count | Returns the number of distinct values in the column. |
| Date | |
| Count | Returns the number of date values in the column. |
| Distinct Count | Returns the number of distinct date values in the column. |
| Numeric and Currency | |
| Sum | Returns the sum of all the values in the column. |
| Maximum [Max] | Returns the maximum value in the column. |
| Minimum [Min] | Returns the minimum value in the column. |
| Average [Avg] | Returns the arithmetic mean of all the values in the specified column. |
| Standard Deviation | Returns the standard deviation of the column. |
| Variance | Returns the variance of the column. |
| Count | Returns a count of the number of values in the column. |
| Distinct Count | Returns the number of distinct values in the column. |
Follow the steps below to apply functions on columns:
- Drag and drop the required columns either into the Group by or Summarize shelf.
- Click the drop-down present in the column, and select the required function to be applied to the column.
Applying filters
Analytics Plus allows you to filter columns based on individual values, numeric ranges, date ranges, and more. You can also apply filters to multiple columns in a summary view. These filters can be applied only when designing a summary view. Follow the steps below to do this.
- Open the required summary view in the Edit Design mode.
- Navigate to the Filters tab, and drag and drop the required column to apply the filter.
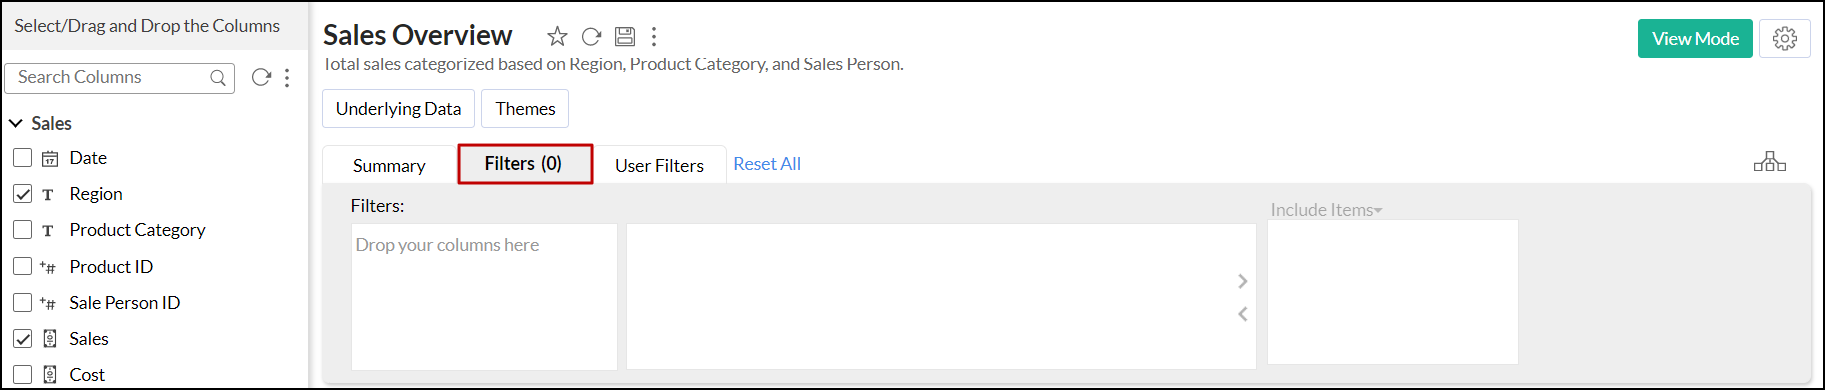
On adding a column to the Filters section, Analytics Plus displays a list of all options available for filtering the data. These options vary based on the data type of the added column.
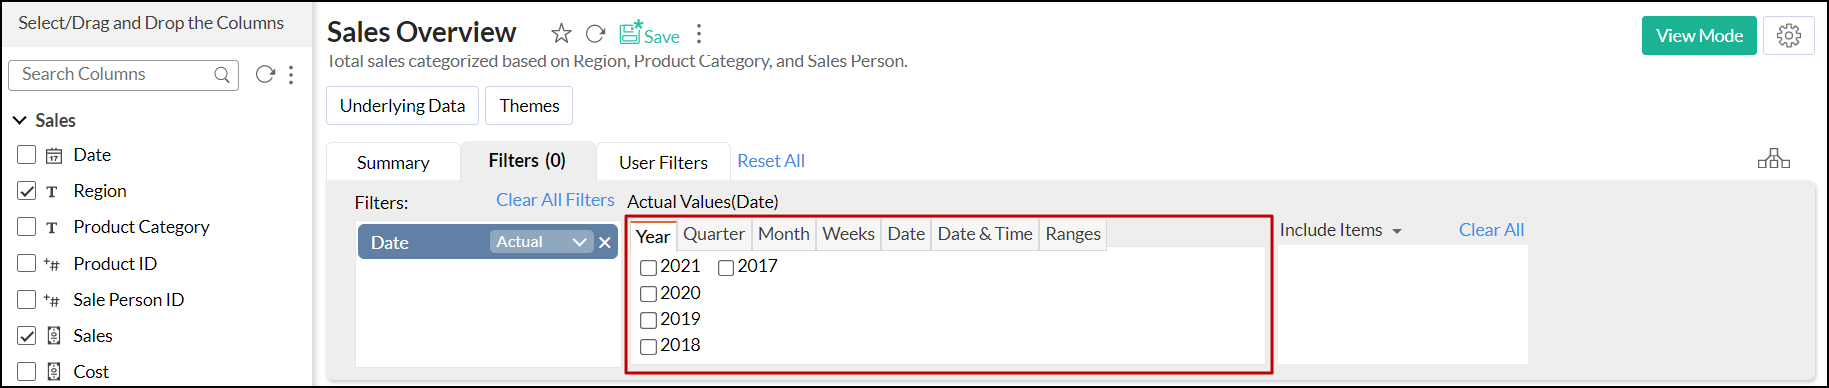
- Select one or more values to filter the data. The selected filter items will appear in the Include Items box.
- Click the Click Here to Generate Summary button to apply the filter.
The filtering options are the same across all types of reports in Analytics Plus. Click here to learn more about filters.
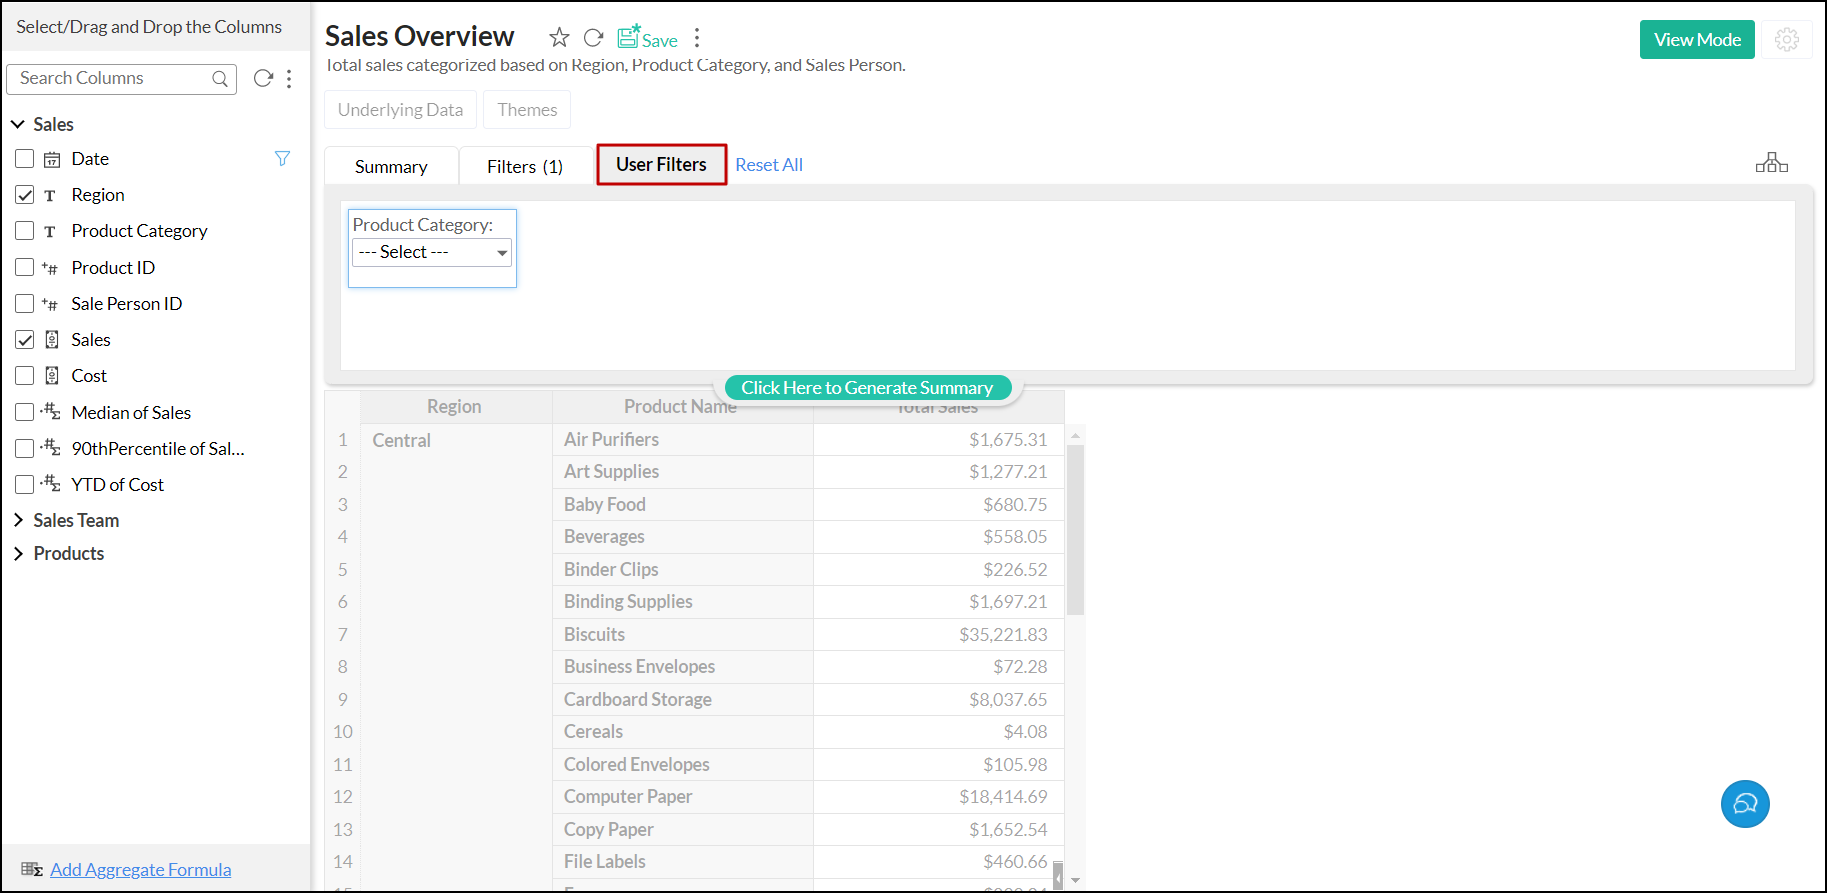
Applying user filters
Analytics Plus also allows you to apply dynamic filters to the summary report in the form of user filters. It also offers a variety of display components for filters, such as drop-down boxes, sliders, and date range choosers. This enables users to apply filters dynamically in View mode.
Follow the steps below to apply a user filter to summary views.
- Open the required summary view in the Edit Design mode.
- Navigate to the User Filters tab and drag and drop the required columns.
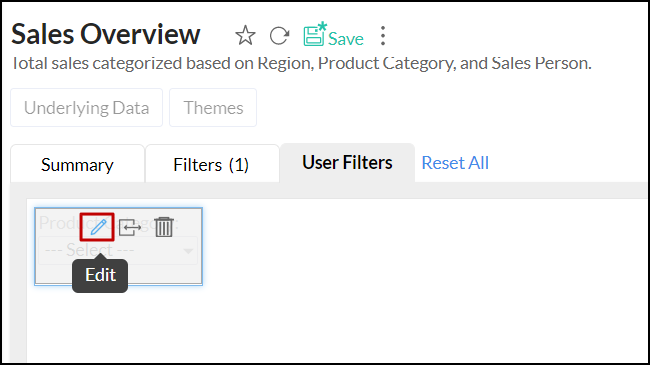
- Click the Edit icon that appears when hovering over the added user filter.
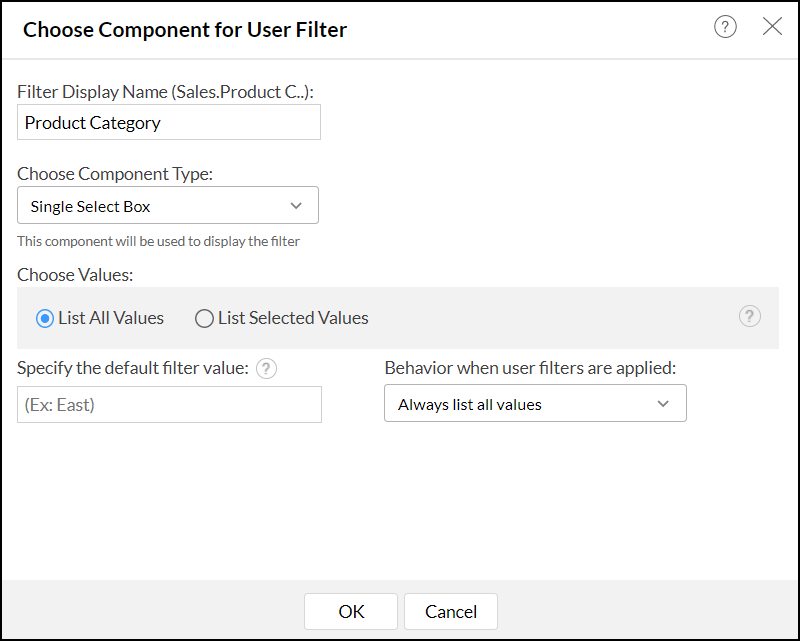
- In the dialog that appears, configure the required filter options and click OK. These options will vary based on the data type of the dropped column. Click here to learn more about the various user filter options in Analytics Plus.
- Click the Click Here to Generate Summary button to generate the report with the configured user filter.

