Joining Tables
In a reporting system often you might require to combine data from two or more tables to get the required information for analysis and reporting. To retrieve data from two or more tables, you have to combine the tables through the operation known as "Joining of tables". Joining is a method of establishing a relationship between tables using a common column.
In ManageEngine Analytics Plus you can join tables to create reports using one of the following two methods
Auto-Join
Query Table
Auto-Joining Tables
When you want to create reports using data spanning across multiple tables, ManageEngine Analytics Plus provides you with a special feature called Auto-Join. This feature automatically joins tables when creating reports, if the tables are connected using a Lookup column. For this feature to work, you need to specify that two tables are related using the Lookup column. To define a lookup relationship between two tables, it is essential that the tables have at least one column which is common between them. Lets look at this further with an example.
Here's an example to illustrate how to define lookup columns and how Auto-Join combines tables while creating reports, based on lookup relationship
"Store Sales Database" Model:

In a Store Sales Database model, the Sales and Sales Person tables have a common column called Sales Person Id. In the Sales table every sale is associated to the Sales Person Id, who did the sale. In the Sales Person table each sales person is identified by a unique id specified in the column Sales Person Id. Similarly Sales and Product Details tables have a common column called Product_ID. In the Sales table each sale is associated with a product identified by the column Product_ID. In the Product table each product is identified by a unique id specified in the column Product_ID
Given these related columns we can define lookup relationship between Sales and Sales Person table through the column Sales Person Id. Similarly between Sales and Product Details tables a lookup relationship can be established based on the common column Product_ID. Once the lookup column relationship is defined ManageEngine Analytics Plus will automatically join data from these tables using the Auto-join feature, when you start creating reports based on these tables.
Defining Lookup
You can define lookup from your existing table or while importing. You can also define a lookup from the report editor. The following section explains how to define lookup between tables.
From Table
This section explains how the lookup relationship is defined from tables.
It is assumed that the above Store Sales Database has already been created with the corresponding tables in ManageEngine Analytics Plus. Let's start defining lookup between Sales and Sales Person tables through the common column Sales Person ID.
From the Explorer tab of the workspace, open Sales table and click Edit Design button on the toolbar.
In the dialog box that appears, click on the the cell under Data Type column for the Sales Person ID and choose the data type as Lookup Up Column from the drown-down list.
Click on the cell at the intersection of Sales Person ID and Lookup Column. You will see a list of all the tables and their columns in the workspace as shown below under drop-down list. Select Sales Person ID in Sales Person table.

You can also create a lookup column by following the below steps:
- Open the Sales table.
- Select the Sales Person ID column.
- Right-click the column header and select Change to Lookup Column.
- In the Change to Lookup Column dialog that opens, select the Sales Person ID column to look up.
Now, a relationship between Sales and Sales Person tables is established through the lookup column Sales Person ID. Here we call the Sales table as the child table to Sales Persons table, since the Sales table is looking up a column from Sales Person table which is termed as the parent.
Similarly we can define the lookup relationship between Sales and Product Details tables using the Product Id column. Here the lookup column is defined for the Sales table (child table), with Product Details table which is the parent.

From Import Wizard
Analytics Plus auto identifies similar columns and provides suggestions for lookup while importing data. The following section explains how this works.
- Once you have chosen the data to import in the Import Wizard, a popup appears in the next screen (In Step 2 of 2: Create Table) as shown below.
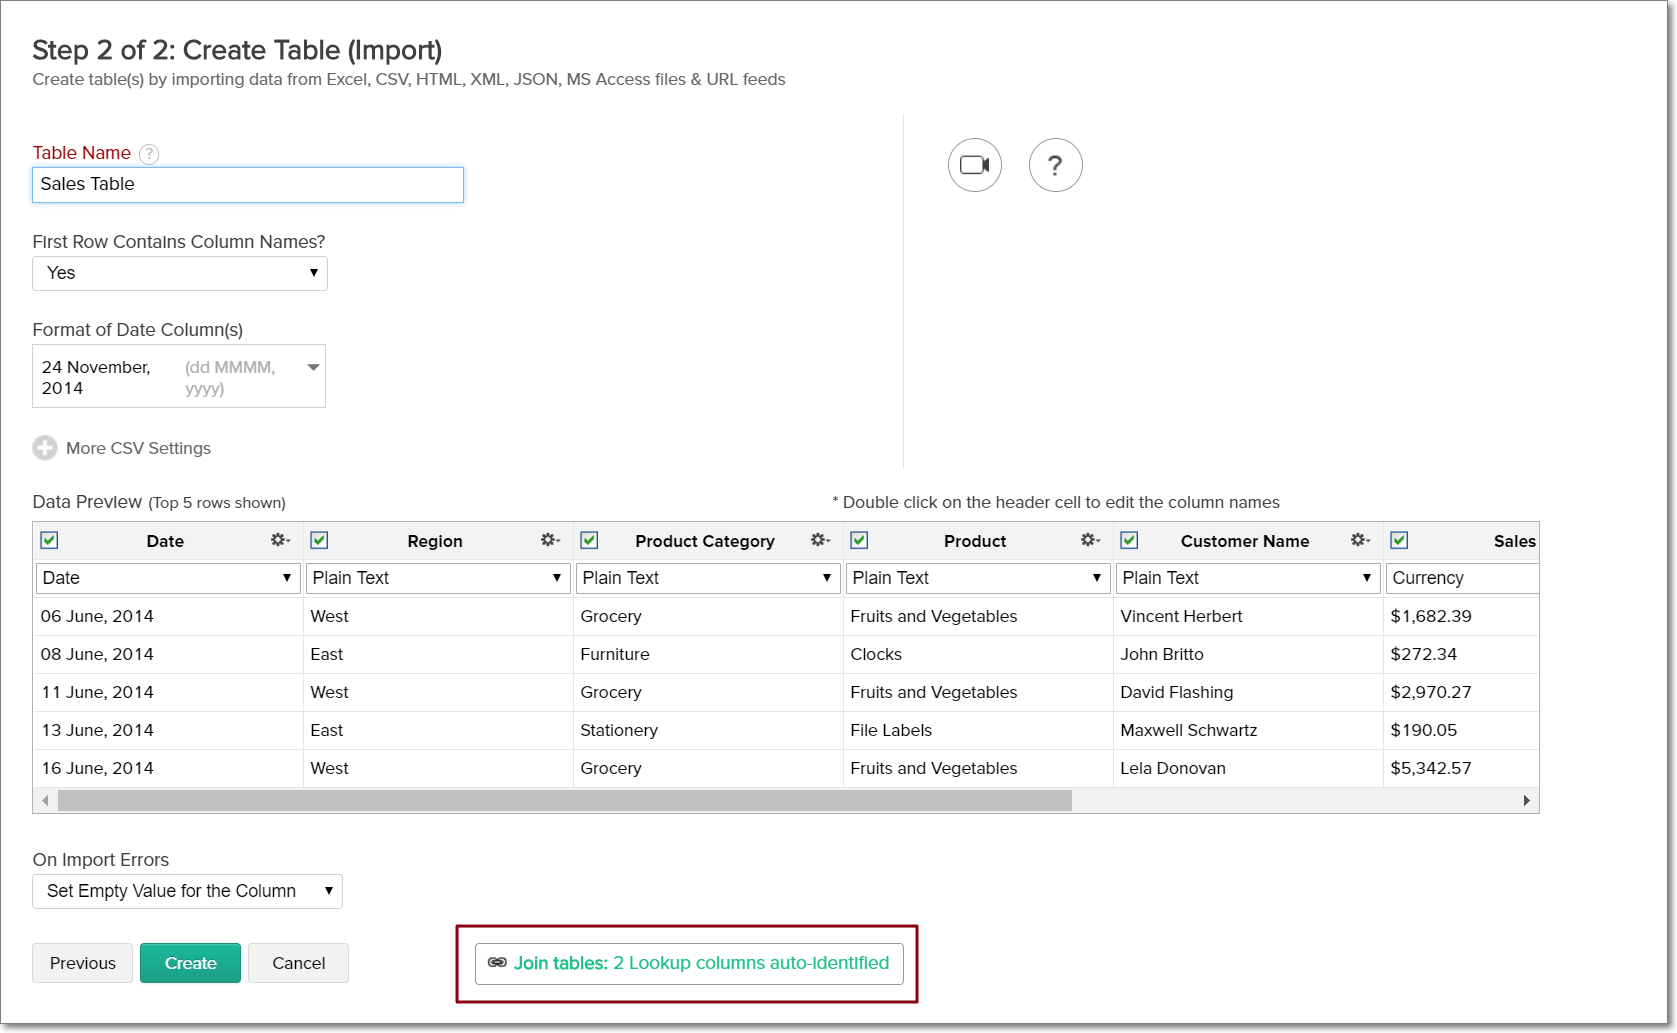
- Analytics Plus matches the new data being imported with the existing tables, identifies the columns with the same names and data types, and suggests them for joining. You can click the Join Tables: Lookup column auto-identified link at the bottom (In Step 2 of 2: Create Table) to create the lookup.
- In case Analytics Plus is not able to auto-identify columns for lookup, you can create your own lookup by clicking the Join Tables link.
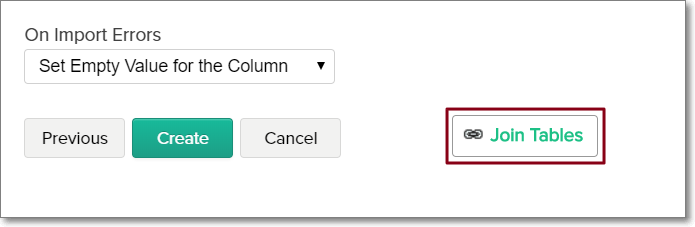
- The Join Tables dialog will open, displaying the list of matching columns that can be looked up with the existing table.
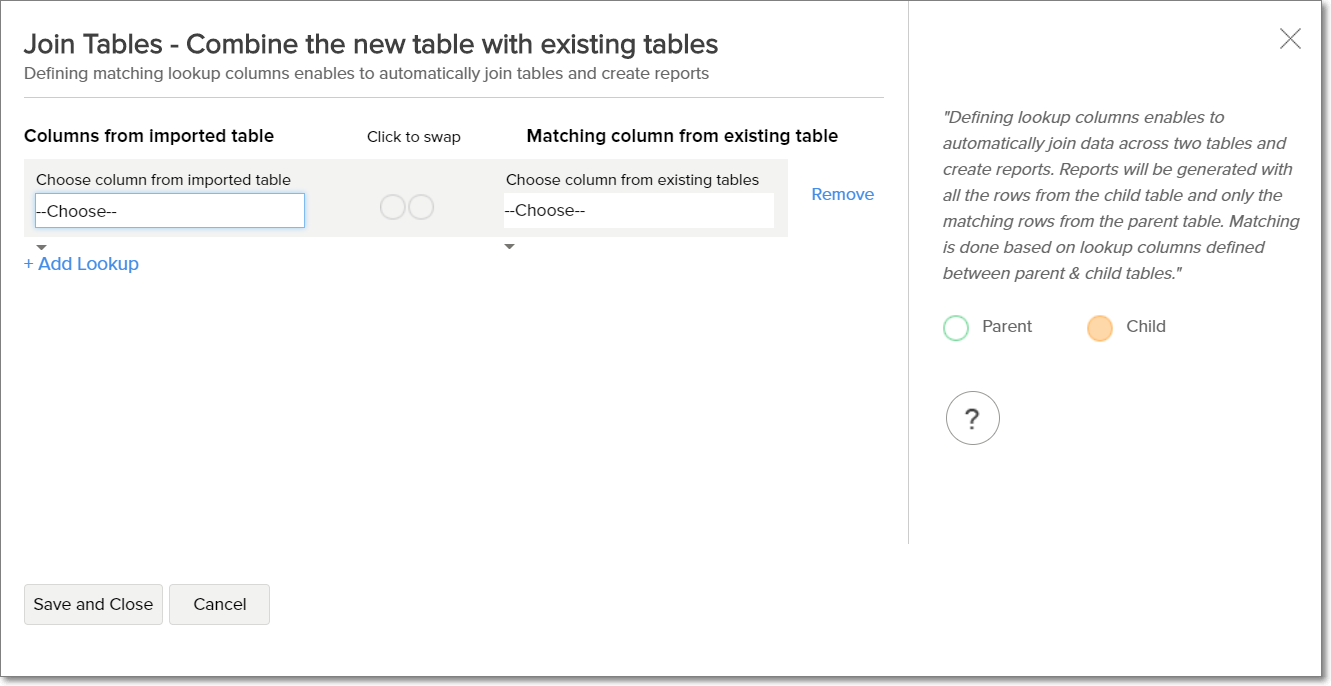
- By default, the column from the existing table is defined as parent, and the column from the new table is defined as child. You can swap the relationship by clicking the circles connecting the tables. You can also remove the lookup suggestion by clicking the Remove button adjacent to the suggestion.
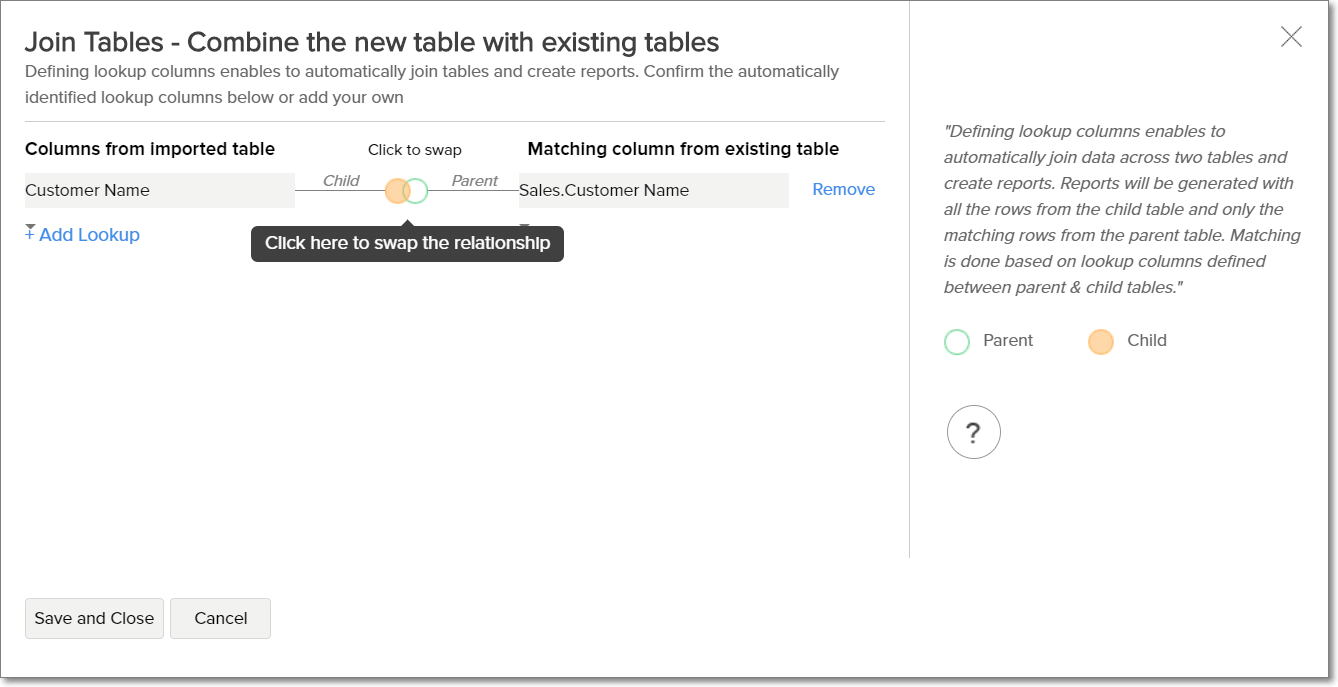
- Once you have selected the columns and relation to be defined for the Lookup, click Save And Close. The lookup will be created between the tables. Click here to know more about how relational data modeling works in Analytics Plus.
From Reports Editor
Analytics Plus allows you to join tables from the report editor when you need to include data from another table. Let's say you want to create a report on Sales by Sales Person. Your Sales table data might just have the Sales Person ID. You can add the Sales Person Name from Sales Person table. The following section explains how this works.
- Click the Include Tables link in the left pane. The Include Table dialog to join data from another table will open.
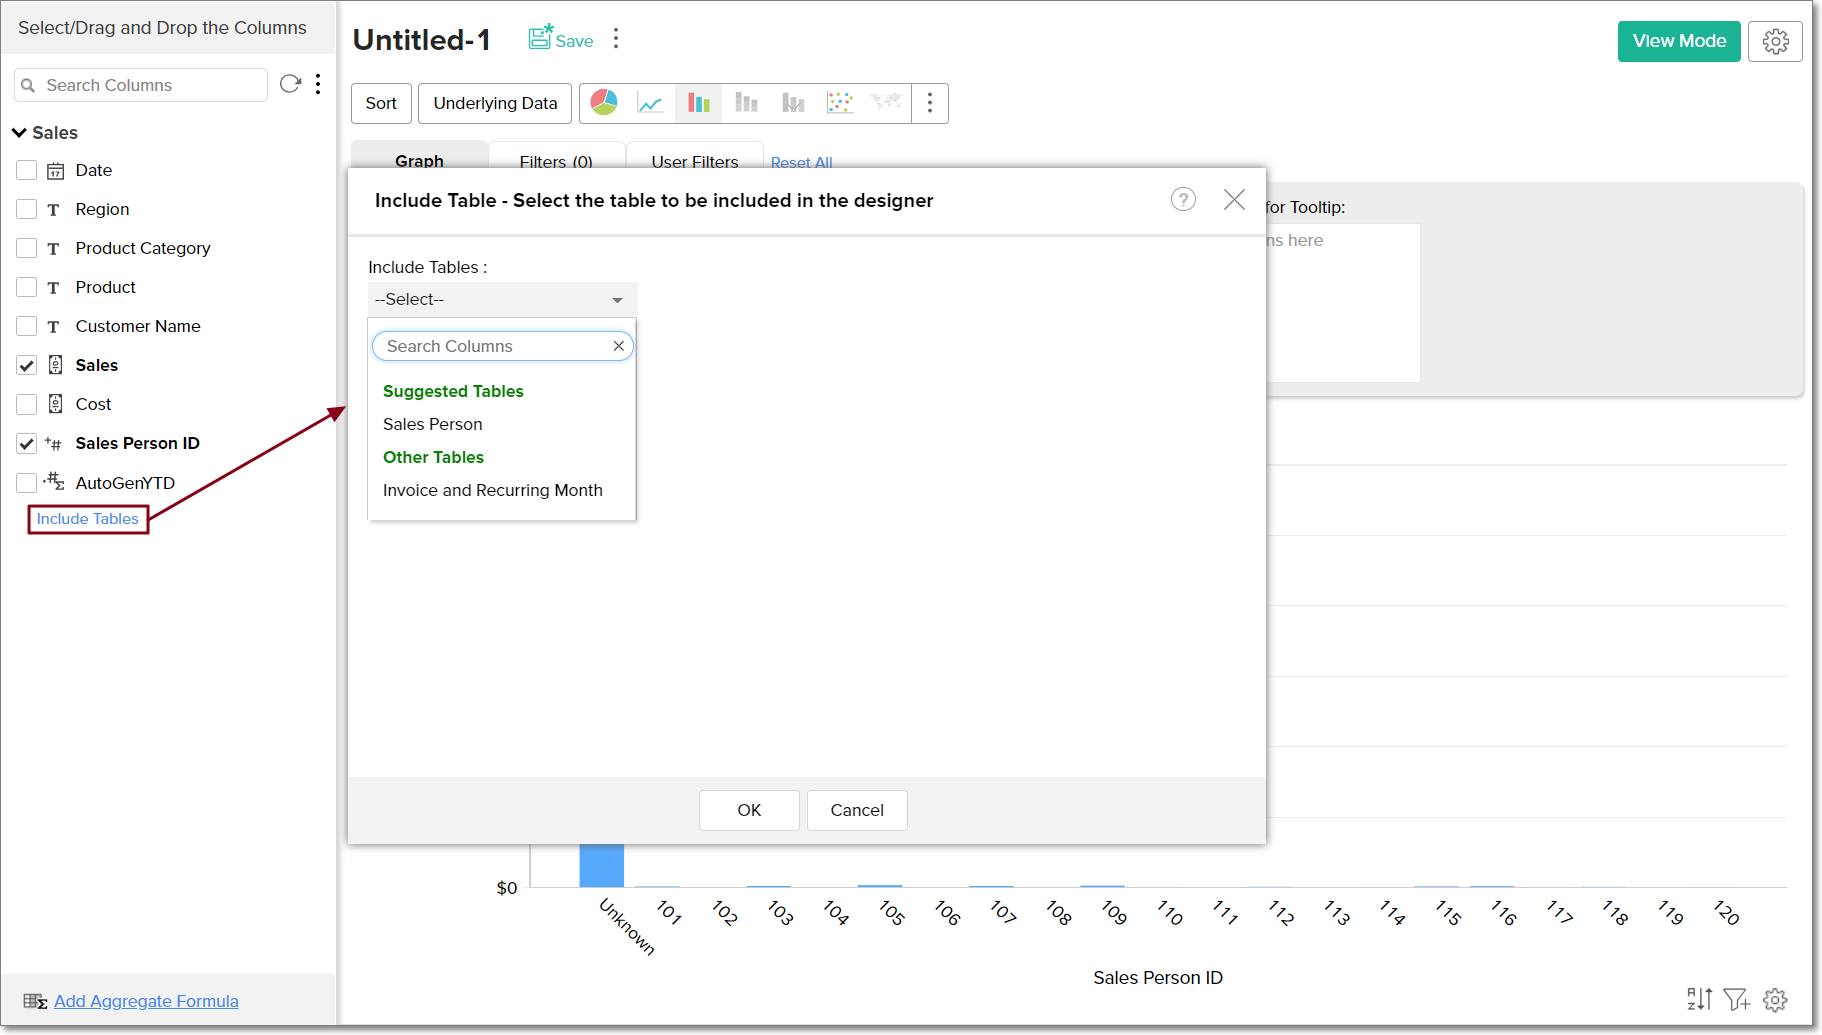
- Select the table (Sales Person) from which you want to join data. Analytics Plus will then auto-identify similar columns for lookup and select them by default. You can change these columns as needed.
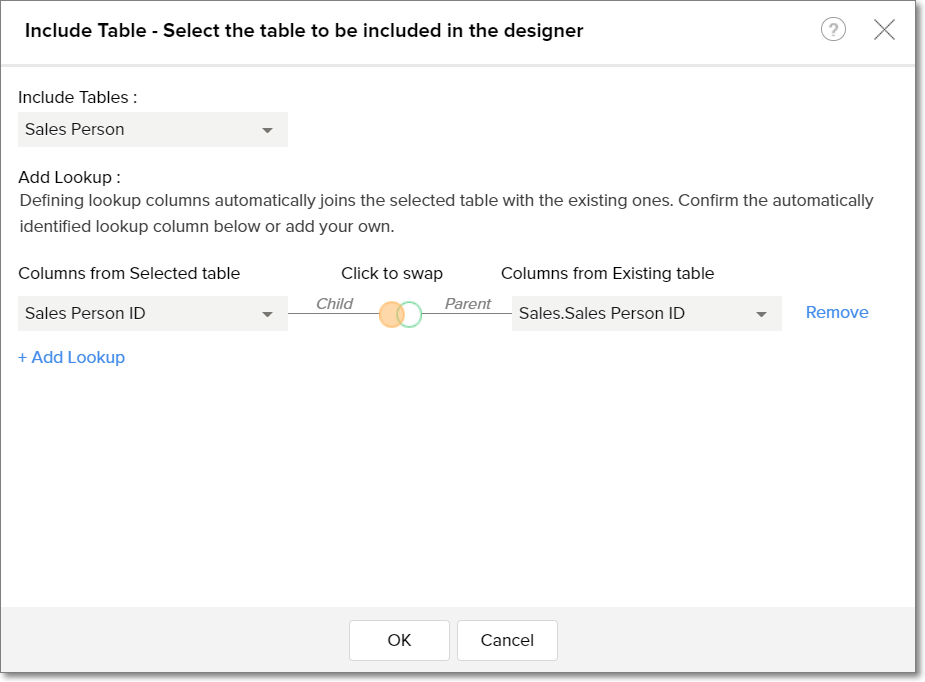
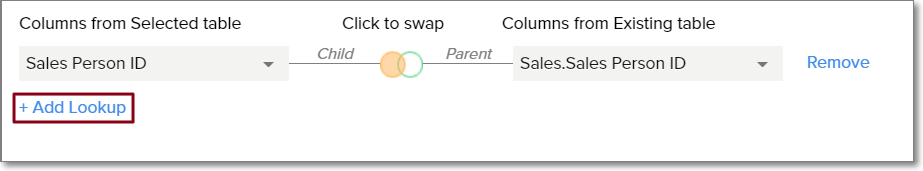
- By default, the column from the existing table is defined as parent, and the column from the new table is defined as child. This relationship can be swapped and the lookup suggestion can also be deleted, as seen in the Auto-Join from the Import Wizard section. You can also define multiple lookups by clicking the +Add Lookup link.
- Once you have selected the columns and relation to be defined for the Lookup, click OK. The lookup will be created between the tables and you will be able to add columns from both tables in your report. Click here to know more about how relational data modeling works in Analytics Plus.
Creating Report using Auto-Join
Once tables are related with each other using lookup columns, you can create the report by selecting any of table with lookup relationship. ManageEngine Analytics Plus will automatically join the data from these tables and generate the report, when you drag and drop columns from across tables.
Here's how the Sales by Each Sales Person chart is created using Auto-Join feature:
Open Sales table and select New Chart View option on the toolbar.
Now, Auto-Join feature detects its lookup relationship with other tables and lists all the columns of Product and Sales tables in Column List panel in the Report Designer.
Drag and drop Sale Person Name column from Sales table into X-axis shelf and Sales column from Sales table into Y-axis shelf.
Click Click Here to generate Graph link to create Sales made by each Sales Person report.

- The Auto-join feature will automatically join the data from both the Sales and Sales Person table using the Lookup column Product ID and provide the report.
Also, columns from the related tables can be used to filter the report. Continuing the above example, Product Name column from Product Details table can be used to filter the chart data and display Sales made by the Sales Person for the selected Products as shown below.

Customize the Join Type:
By default Analytics Plus will join tables using Left Join. Possible join types are:
Left Join - Report will be computed with all the rows from the child table (left) and only the matching rows from the parent table (right). Matching is done based on lookup columns defined between child & parent tables. This will be the default join type. In this case the Sales table is the child and Sales Person table is the parent.
Right Join - Report will be computed with all the rows from the parent table (right) and only the matching rows from the child table (left). Matching is done based on lookup columns defined between parent & child tables. Here the child will be Sales Person table and parent will be Sales table.

You can choose to change the join type. To do so,
- Click View Paths used icon in the chart designer and select In a List View.
- In the Paths Used in this report dialog that opens select the type of join and click Apply.
Customizing Lookup Columns and Path used in Auto-Joins
You can link multiple tables using various Lookup columns in your Workspace. When creating a report, Analytics Plus will use the appropriate Lookup columns (Lookup path) created between them and generate the report using the auto join capability.
However, in some cases, this might not suit your specific need. To address this, Analytics Plus allows you to choose the Lookup path between tables to be used for report creation using the Configure Lookup Path option.
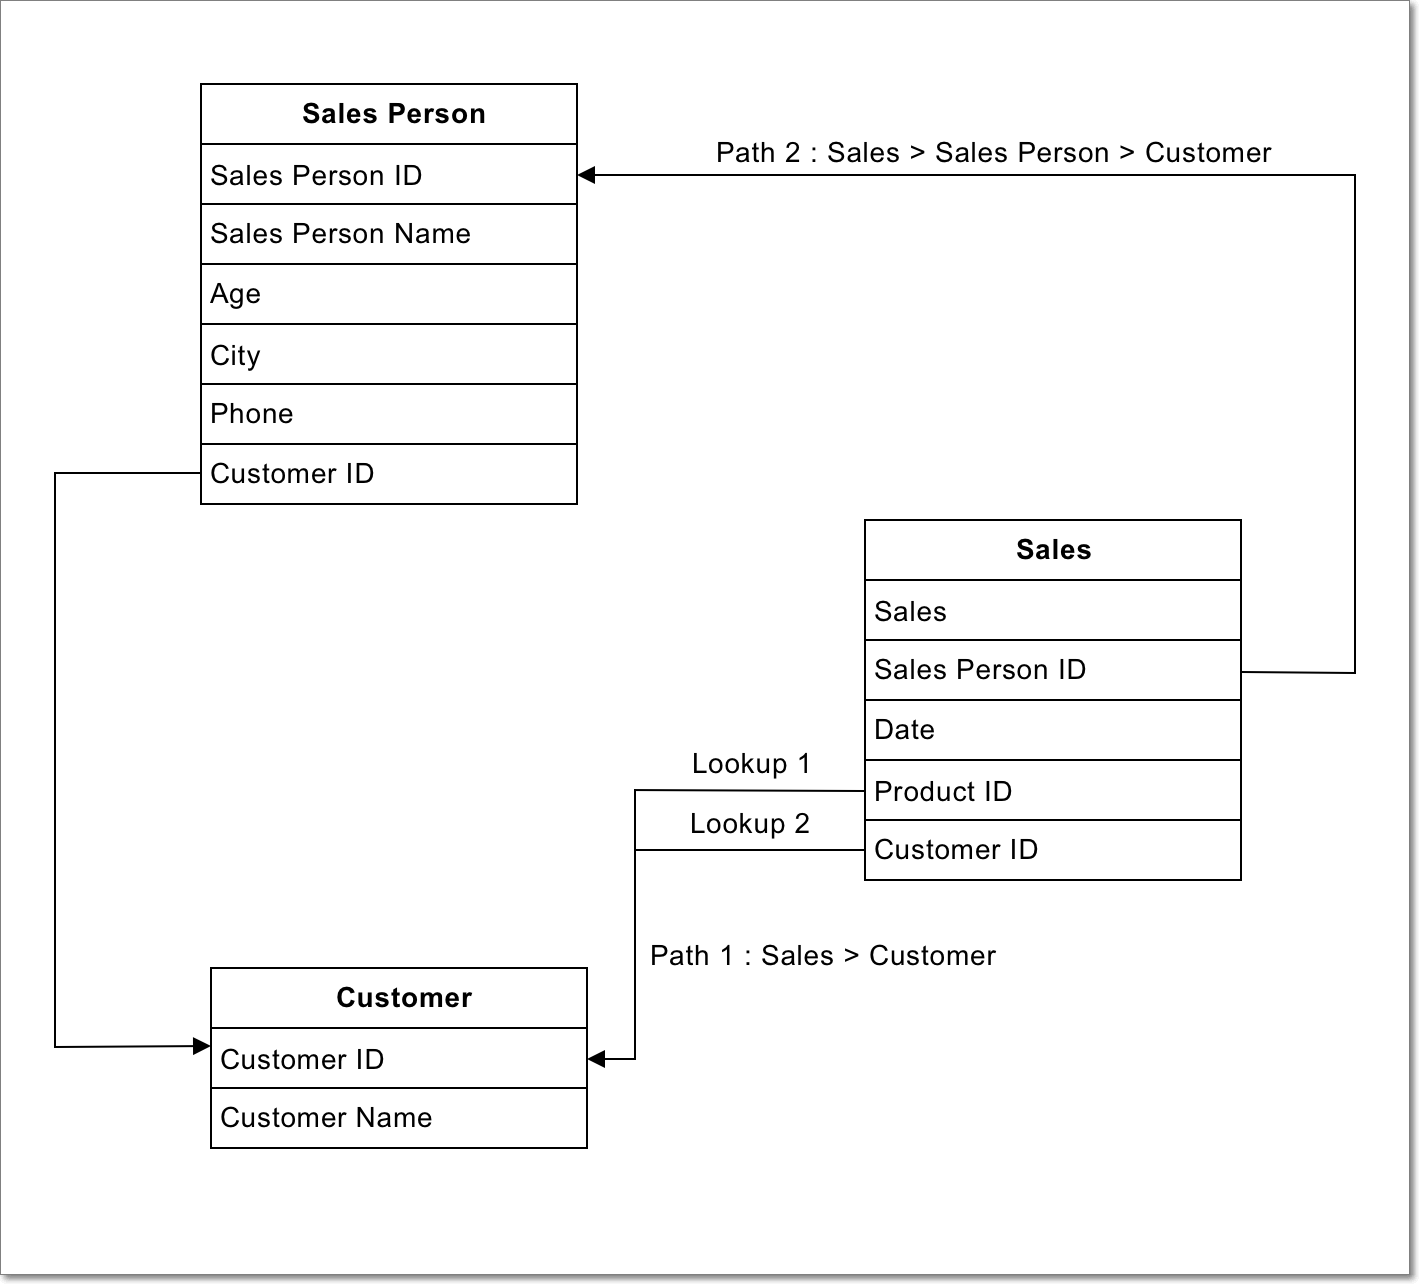
Let's take an example of Sales model. Here the Sales and the Customer tables are directly joined using two lookup columns i.e., Product ID and Customer ID. The Sales table also has a lookup to the Sales Person table using the Sales Person ID. The Sales Person and the Customer tables are joined using Customer ID. This creates an indirect connection between the Sales and the Customer tables through the Sales Person table.
Customizing Lookup Column for Join
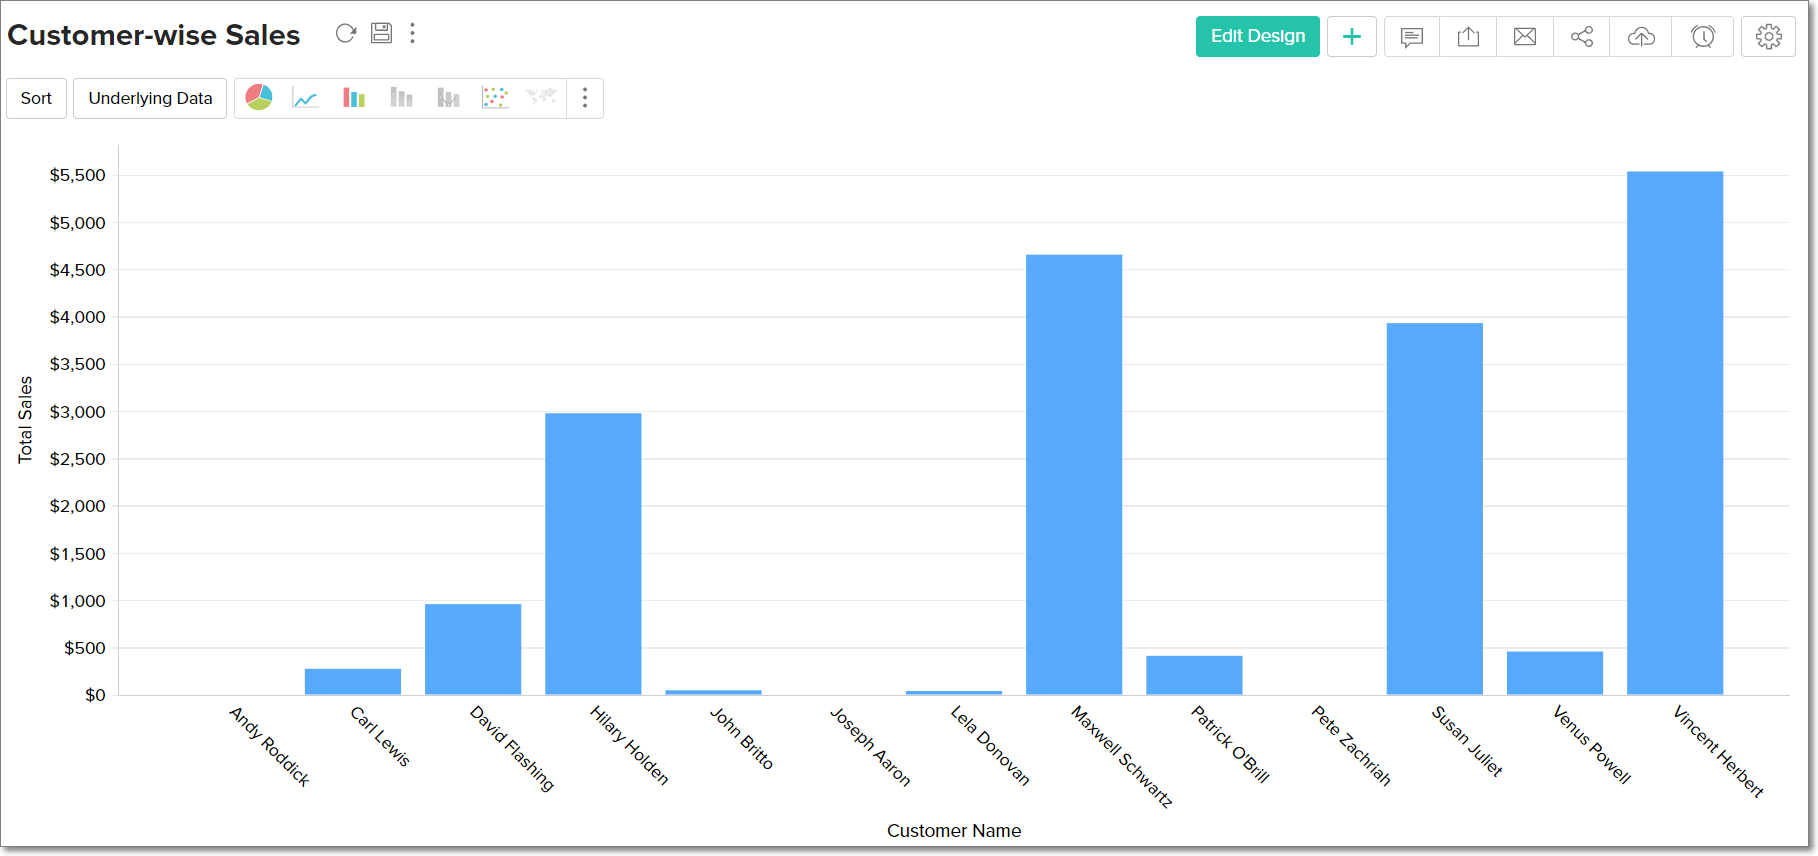
In the above-given model, let's see an example of creating the report Customer wise Sales. By default, when you plot a report for Customer wise sales, Analytics Plus could use the Product ID lookup to Customer table which is not correct.
In this case you can change this by selecting the Lookup Column to be used. The following illustration shows how to change the Lookup Column to join.
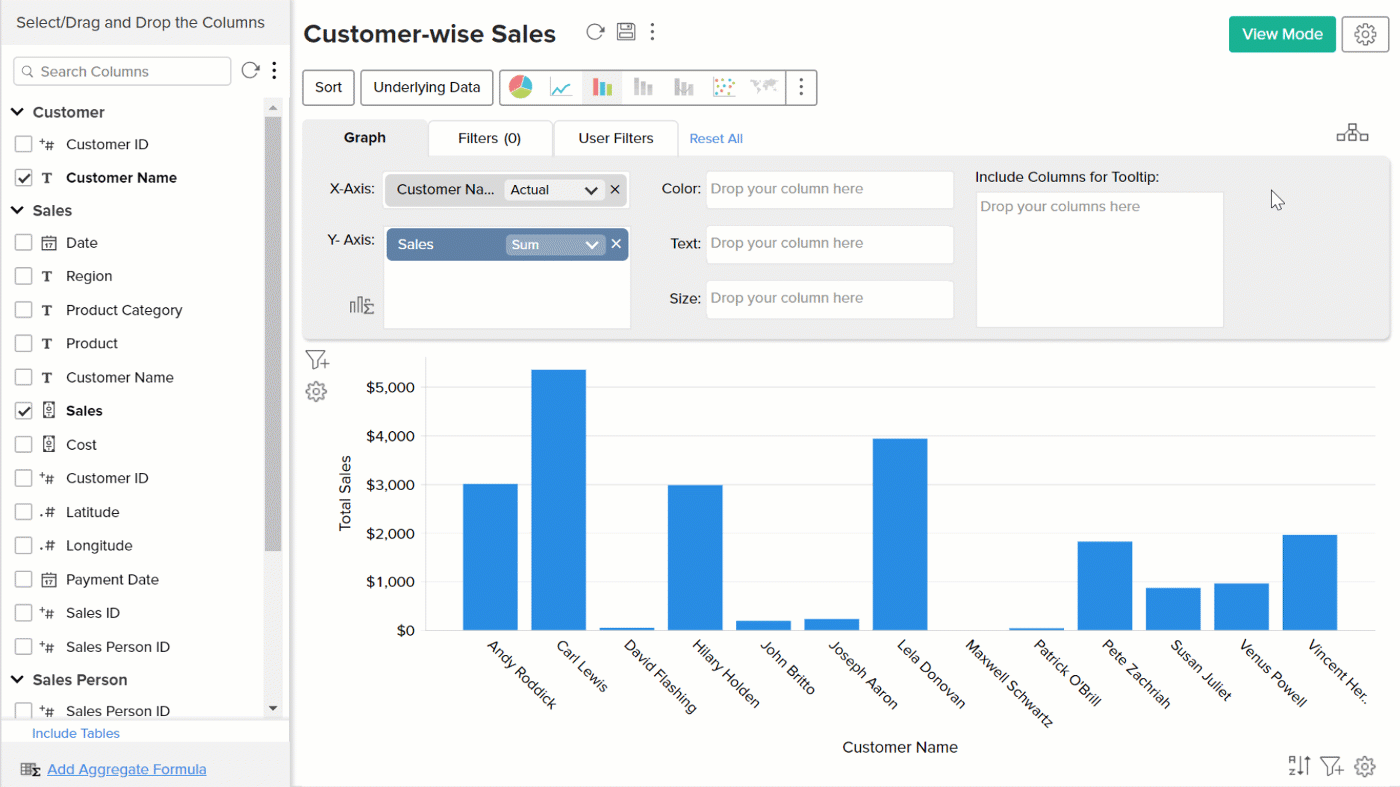
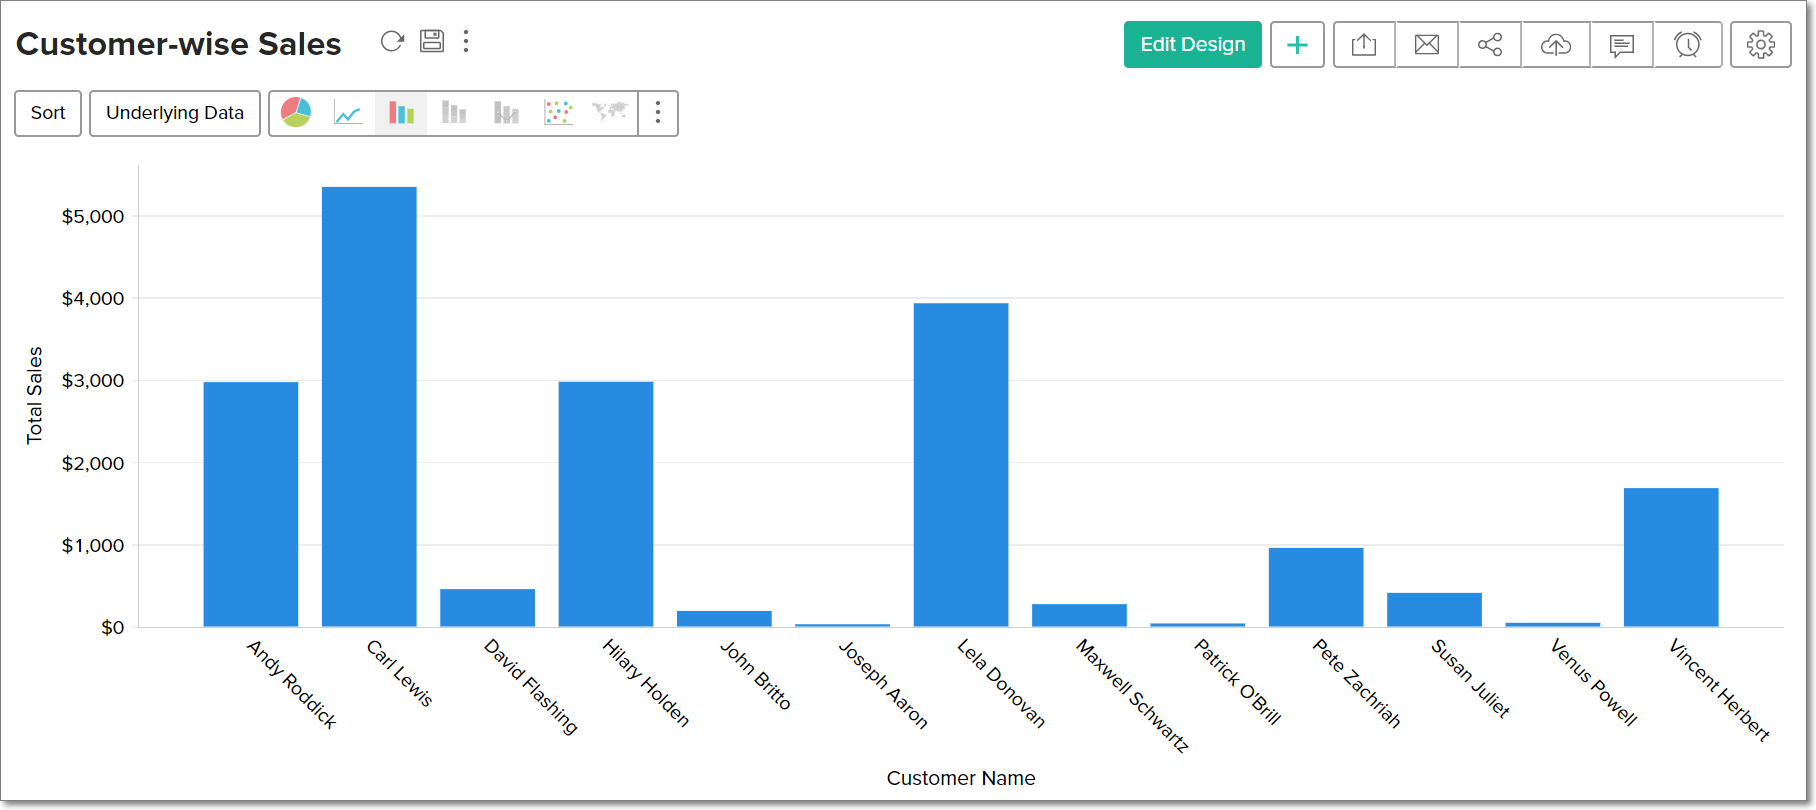
Now the Customer wise Sales report, shown below, is generated.
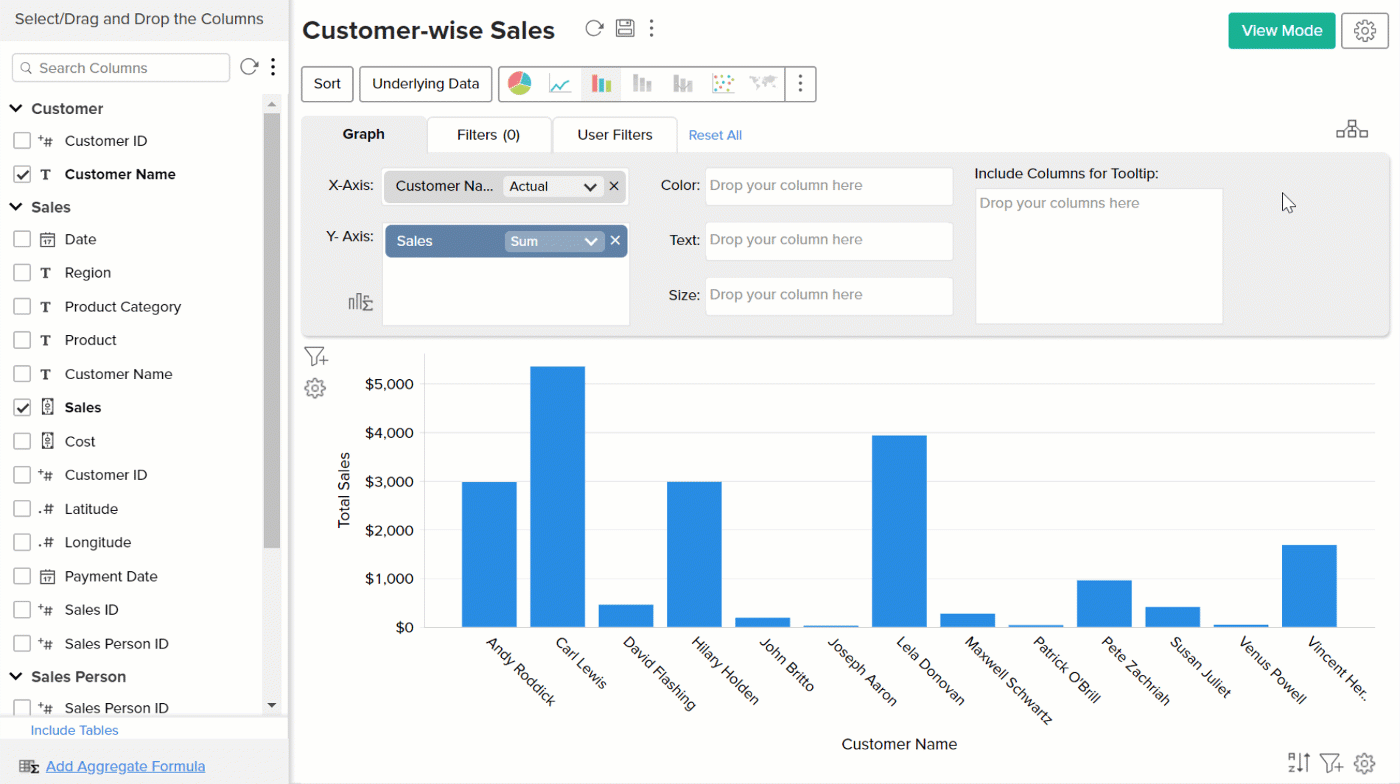
Selecting Multiple Lookup Columns for Join
You can also select multiple lookup columns between each pair of tables in a path. This allows you to create report over data that meet multiple conditions. You can do this by selecting both Customer ID and Sales ID as lookup columns. The following illustration shows how to select both lookup columns for joining.
Customizing Lookup Path for Join
Analytics Pus also allows you to change the lookup path that joins the tables.
Let's say, you need a report on Customer wise Sales categorized by sales persons. Since Sales and Customer are directly joined tables, Analytics Plus will generate the report as Customer wise Sales categorized by customers. It will ignore the Sales Person table in-between while generating the report.
You can change this to achieve your requirement by joining Sales and Customer tables through the Sales Person table. The following illustration shows how to change the Lookup Path to join tables.
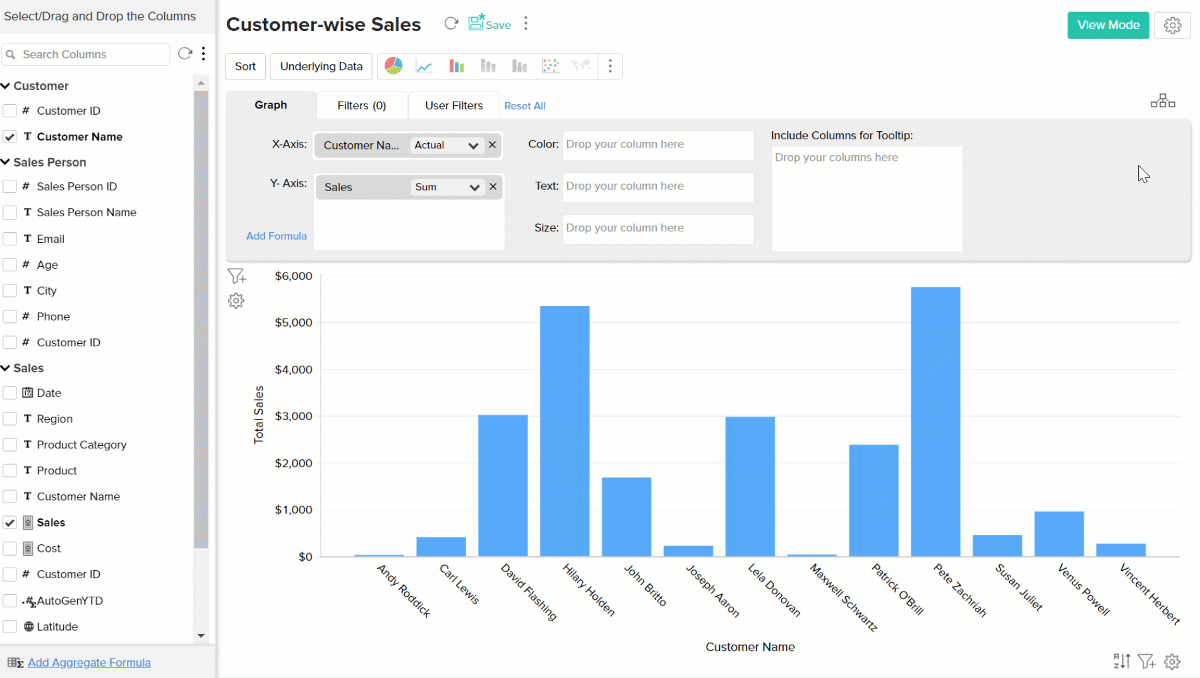
Now, the Sales table is linked to the Customer table through the Sales Person table and retrieves the data for Customer based Sales categorized by sales person.
Note: You could only configure single path to connect two tables. You cannot configure different paths for two columns from the same table in the report. However, you can configure different paths for columns from the different tables.
Joining with Query Tables
If the generated reports by using Auto-Join feature does not meet your specific needs, you could always create a query table to join the tables and use the same to create reports over it . A query table can be created using a SQL Select Join query to join separate tables using a common column and retrieve data you want from both the tables.

Once you create query table joining the necessary tables, then ManageEngine Analytics Plus allows you to create any type of reports for analysis and visualization over the same. Click here to learn more about Query Tables.

