Ask Zia Visualization
Ask Zia lets you visualize your query results through a variety of reports. Based on the question you type, Zia picks the best visualization to display the results. The following is the list of report types used by Zia for query results.
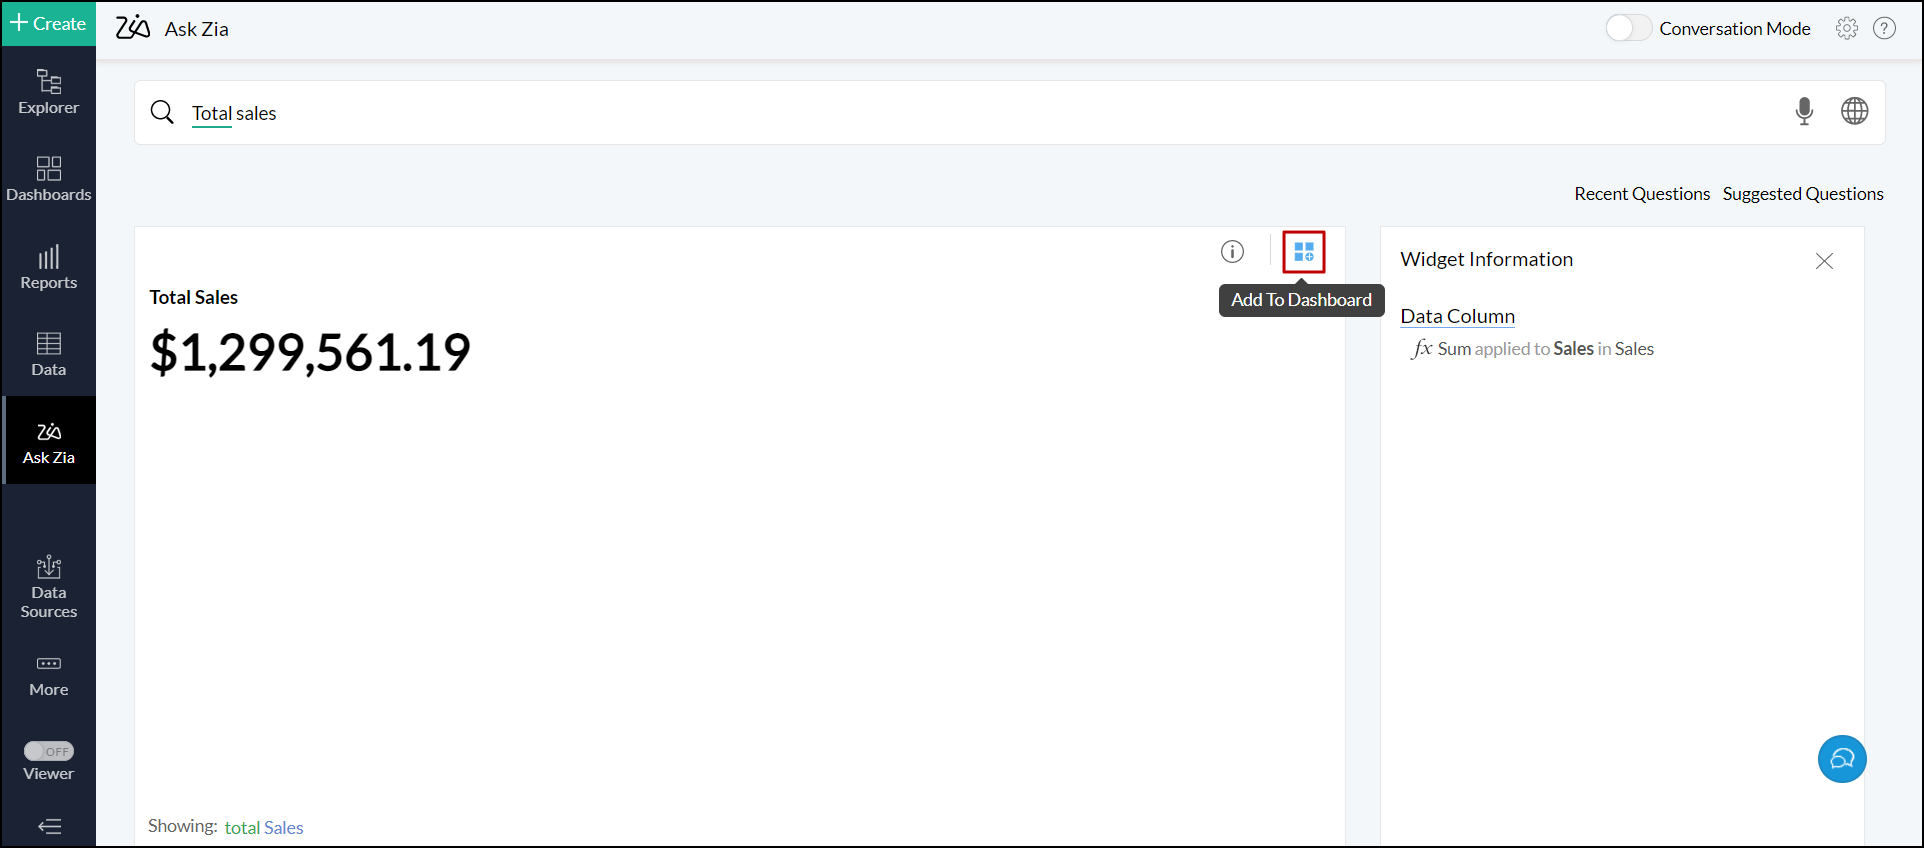
Numeric KPI widget
Zia uses KPI widgets for questions that have single metric results. For example, "Total Sales" or "Last year's profit" displays a widget with the total sales numbers. You can also add the generated widget to your dashboard by clicking the Add to Dashboard icon at the top right corner.
Charts
Ask Zia supports a wide range of chart types to generate its results. Based on your question, Ask Zia selects the chart type automatically. However, you can also choose the appropriate chart type to display results by adding the corresponding keyword in your questions or by clicking the Change Chart Type icon. For example, "What is the difference in Sales across years by Region as a Stacked Bar" displays the result in stacked bar chart as mentioned in the question. To change this, click the Change Chart Type icon.
The following table gives the list of keywords to be used to display the results in specific chart types.
| Chart Types | Keywords |
| Line Chart |
|
| Bar Chart |
|
| Stacked Bar |
|
| Pie Chart |
|
| Ring Chart |
|
| Bubble Chart |
|
| Bubble Pie |
|
| Combination Chart |
|
| Area Chart |
|
| Funnel Chart |
|
| Web Chart |
|
Geo Map visualization
Ask Zia automatically chooses Geo charts if your data set has Geo data or if you ask for metrics across regions. The following are the supported Geo charts and the corresponding keywords to get results in specific chart types.
| Chart Types | Keywords |
| Map Scatter Chart |
|
| Map Bubble Chart |
|
| Map Pie Chart |
|
| Map Bubble Pie Chart |
|
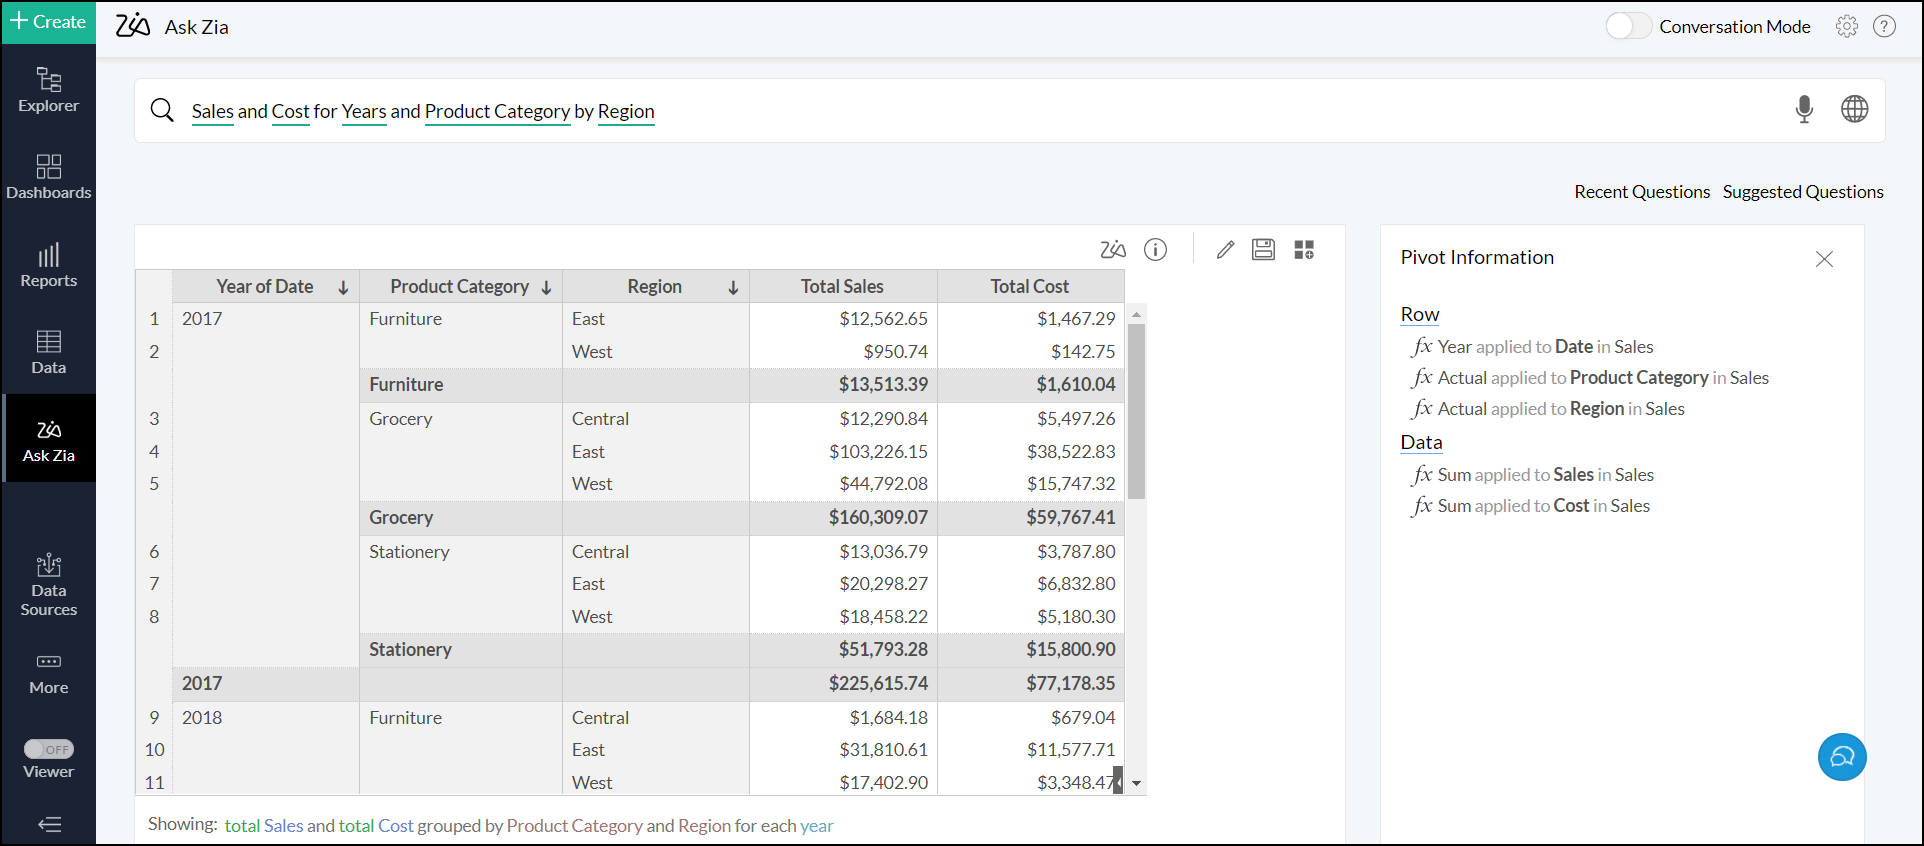
Pivot views
Ask Zia chooses a pivot view when you ask for multiple metrics grouped by multiple dimensions. You can also choose to create a pivot view using the keywords such as pivot, pivot view, and pivot table in the query.
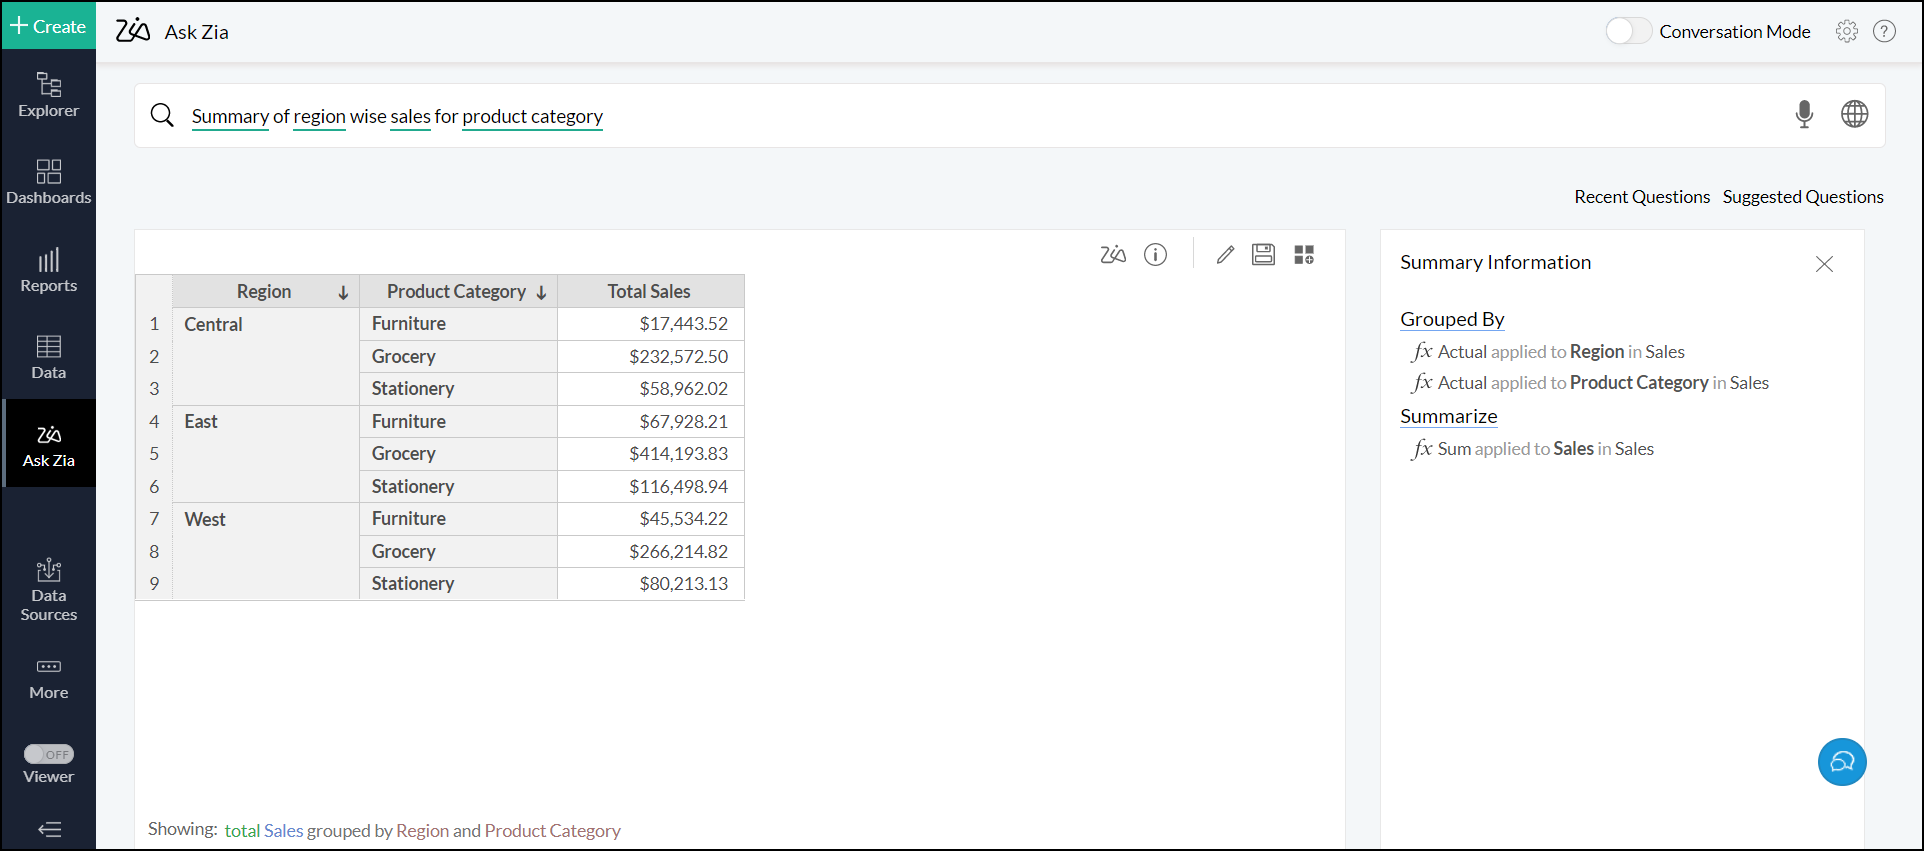
Summary views
Ask Zia displays the results in summary view when your query result contains summary across multiple dimensions.