Working with tabular views
Analytics Plus provides various options to sort, filter, format, and freeze the columns in a tabular view. In this document, we will discuss these options in detail.
Sorting a tabular view
By default, Analytics Plus sorts the data in ascending order based on the data columns in the Group by block shelf. You can also sort the data columns per your requirements.
Follow the steps below to sort a tabular view,
Open the required tabular view in View mode.
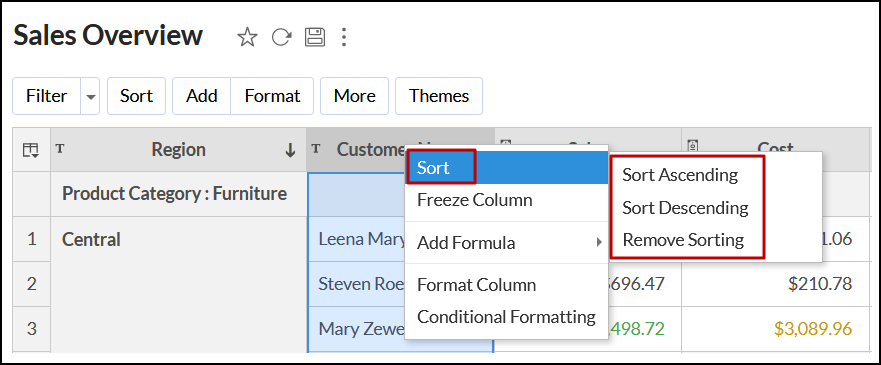
Right-click the required column and click Sort. You can also click the Sort option from the toolbar. The following options are available:
Sort Ascending: This option allows you to sort the column's data in ascending order.
Sort Descending: This option allows you to sort the column's data in descending order.
Remove Sorting: Use this option to remove the applied sorting function.
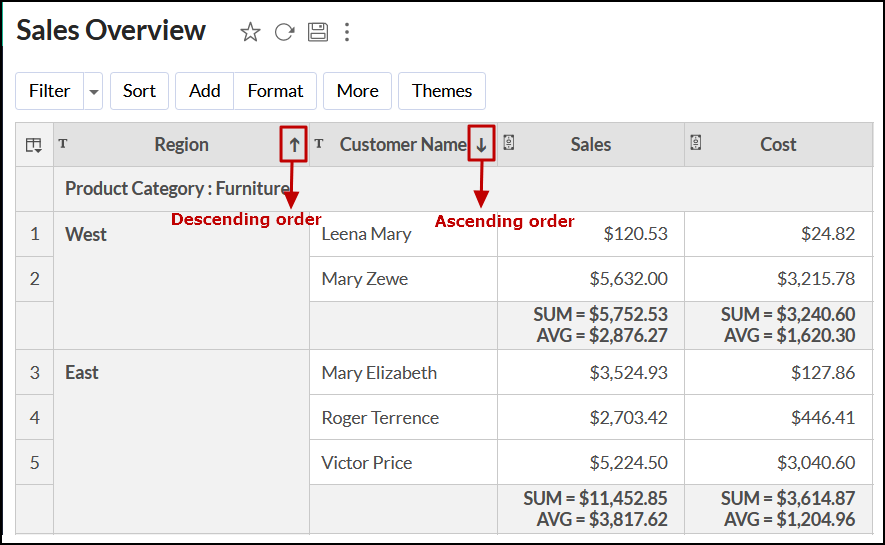
You can also sort the data columns easily, by clicking the arrow icon that appears on mouse over the column header. A down arrow indicates that the column is sorted in ascending order, while an up arrow implies that the column is sorted in descending order.
The sort option in tabular view is similar to the sort option present in tables. Click here to learn more about sorting.
Applying dynamic filters
Analytics Plus allows you to dynamically filter the tabular view to display the required data. Follow the steps below to do this.
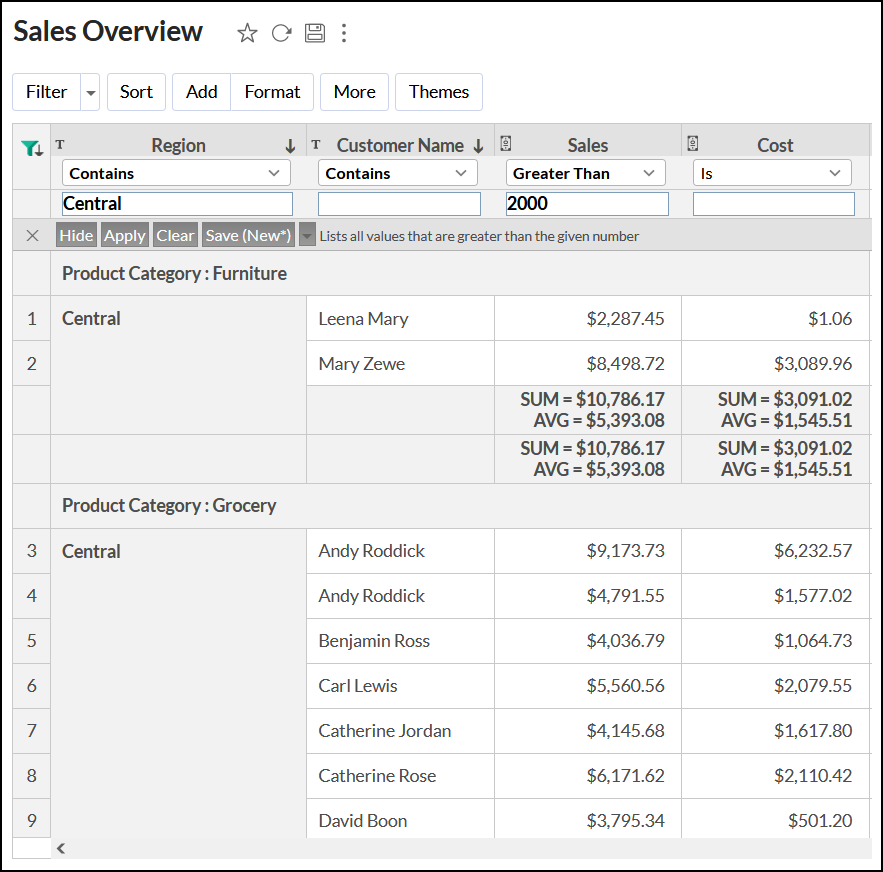
Open the required tabular view, and click the Filter button in the toolbar. The filter pane is displayed with the filter options for each column. These options will vary based on the data type of the column.
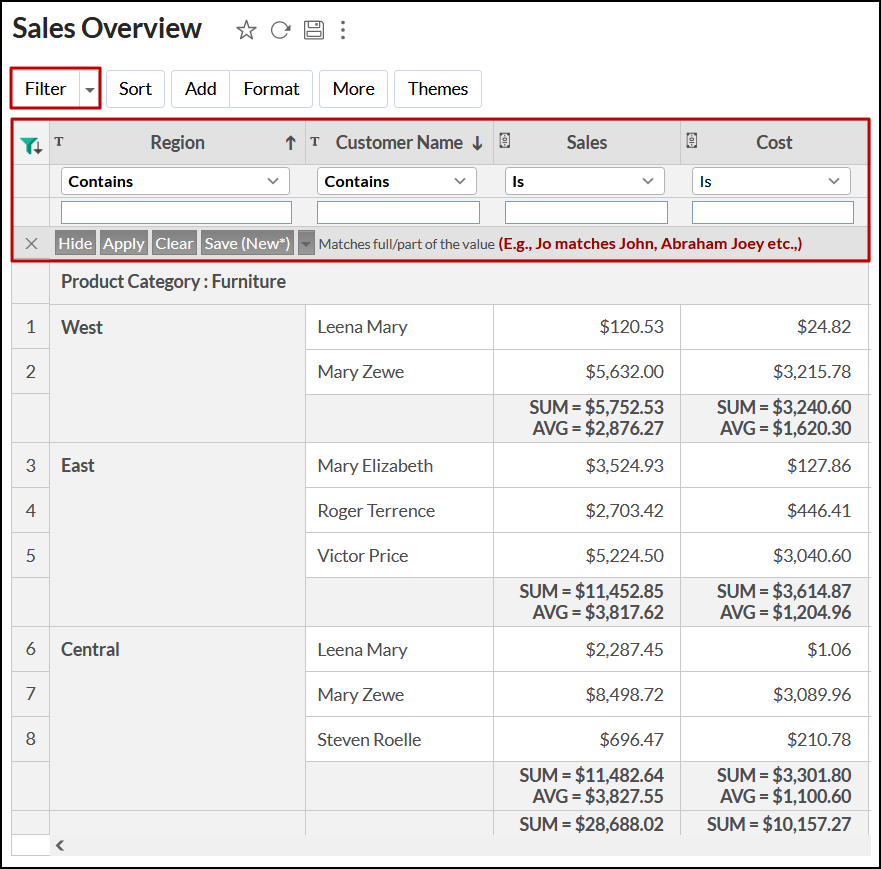
Choose the required filter condition from the dropdown, provide the filter value and click Apply.
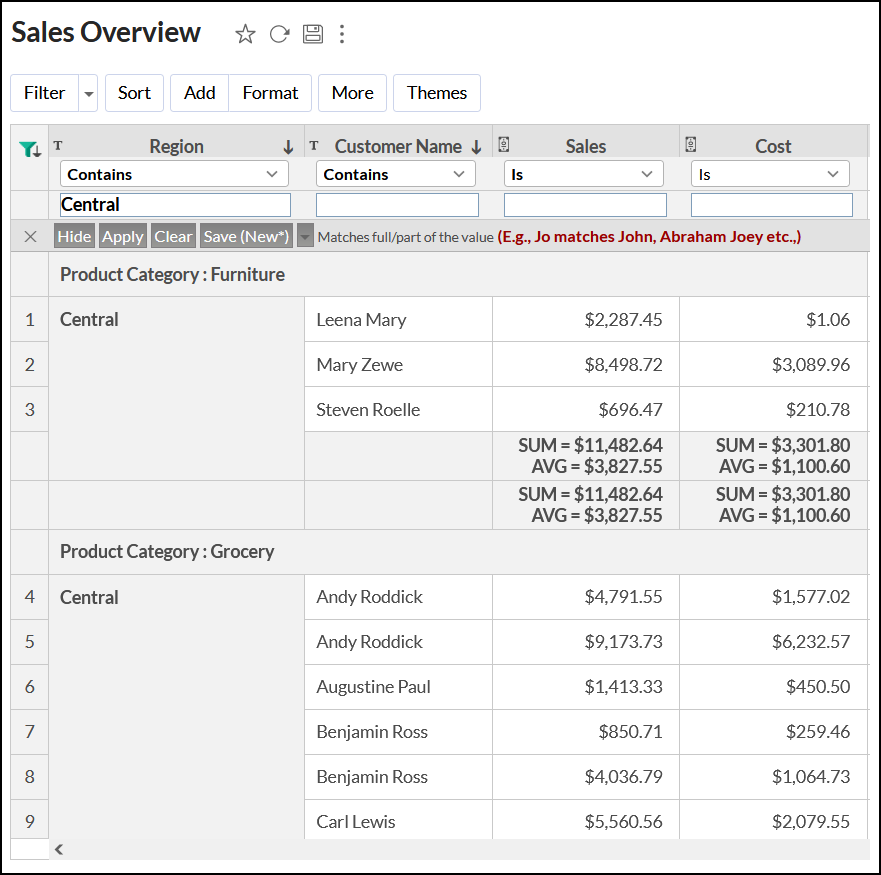
You can also apply filters to multiple columns.
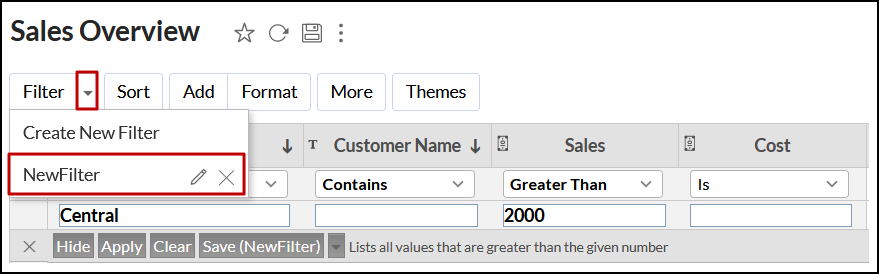
On adding the required filters, click the Save (New*) button.
To edit or delete the existing filters,
Click the Filter drop-down, navigate to the required filter, and click the Edit or Delete icon.
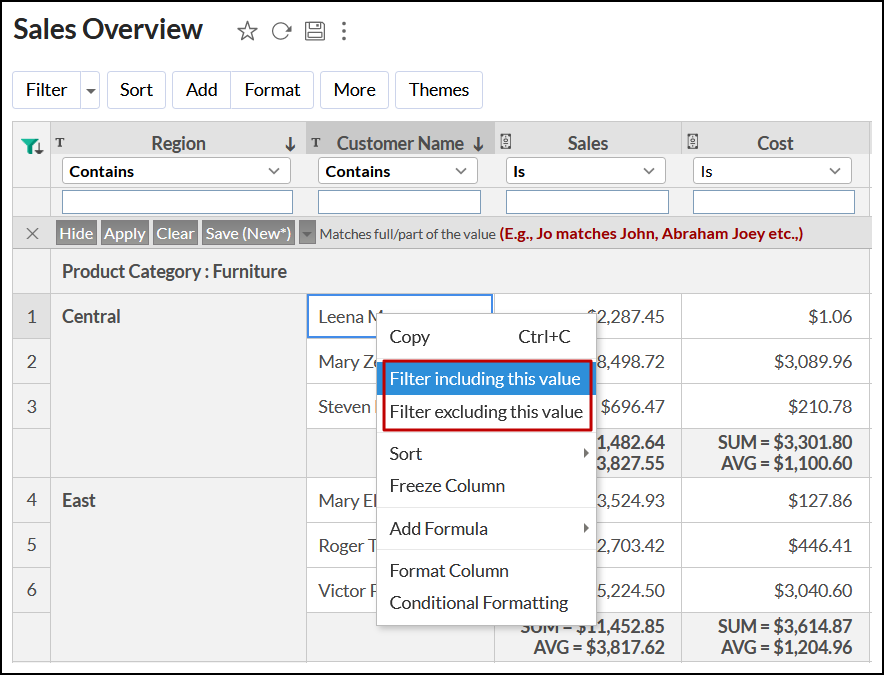
Analytics Plus also allows you to include or exclude specific values from a tabular view. To do this, right-click on the required data cell, and click the Filter including this value or the Filter excluding this value option to display data as required.
Note: The dynamic filters are not visible to the shared users.
Freezing a column
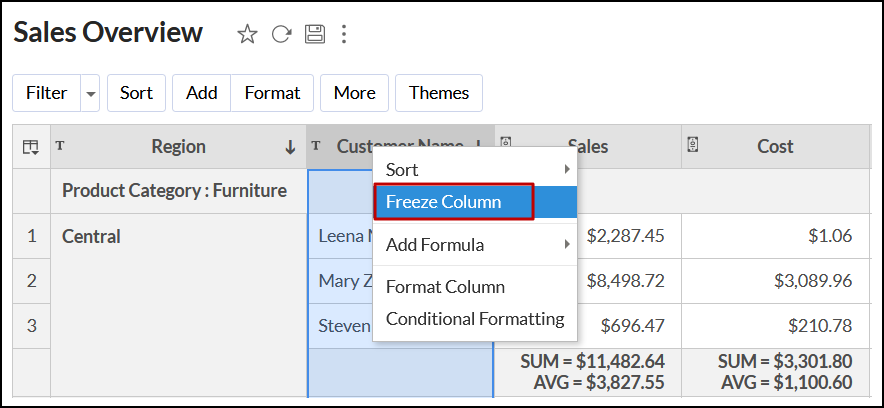
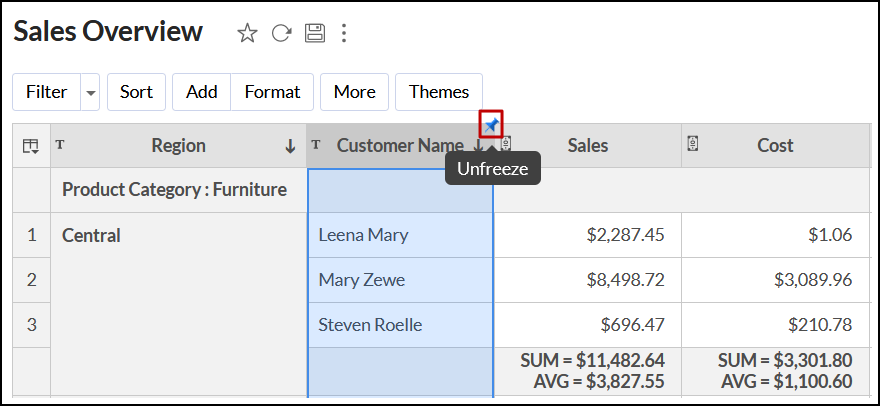
Analytics Plus allows you to pin columns, i.e., ensure the columns are visible when you move horizontally across the report. These pinned columns are displayed at the beginning of the tabular view, one after the other.
To freeze a column, select the required column and click More > Freeze Column from the toolbar. You can also right-click the column and select the Freeze Column option.
To unfreeze the column, click the Unfreeze (pin) icon on the top right corner of the column header.
Sharing a tabular view
Analytics Plus provides various sharing options that facilitate ease of collaboration. You can share a view, and provide various permissions and filters for the shared view.
Follow the steps below to share a tabular view.
Open the required tabular view and click Share > Share this View in the toolbar.
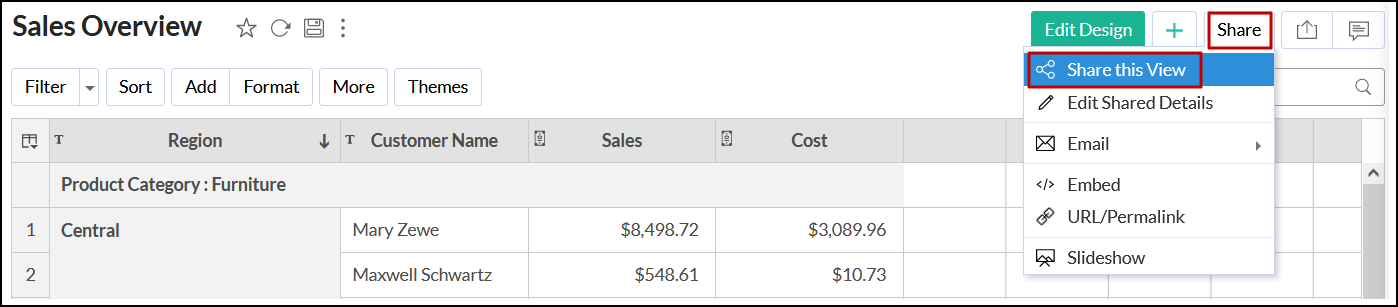
In the dialog that opens, provide the required inputs and click the Share button. Refer to the Sharing and Collaboration page to know about sharing a tabular view.
Note: The share option will be enabled only for users who were provided with the appropriate permissions while sharing the tabular view.
Publishing a tabular view
Analytics Plus allows you to publish the tabular view into your websites/web pages, or as easy-to-access URLs. You can also specify access privileges for the users who access the published view. Refer to the Publishing Options page to know about publishing a tabular view.
Exporting a tabular view
Analytics Plus allows you to export the tabular view into various file formats like CSV, PDF, XLS, and HTML. Follow the steps below to do this:
Open the required tabular view and click the Export icon in the toolbar.
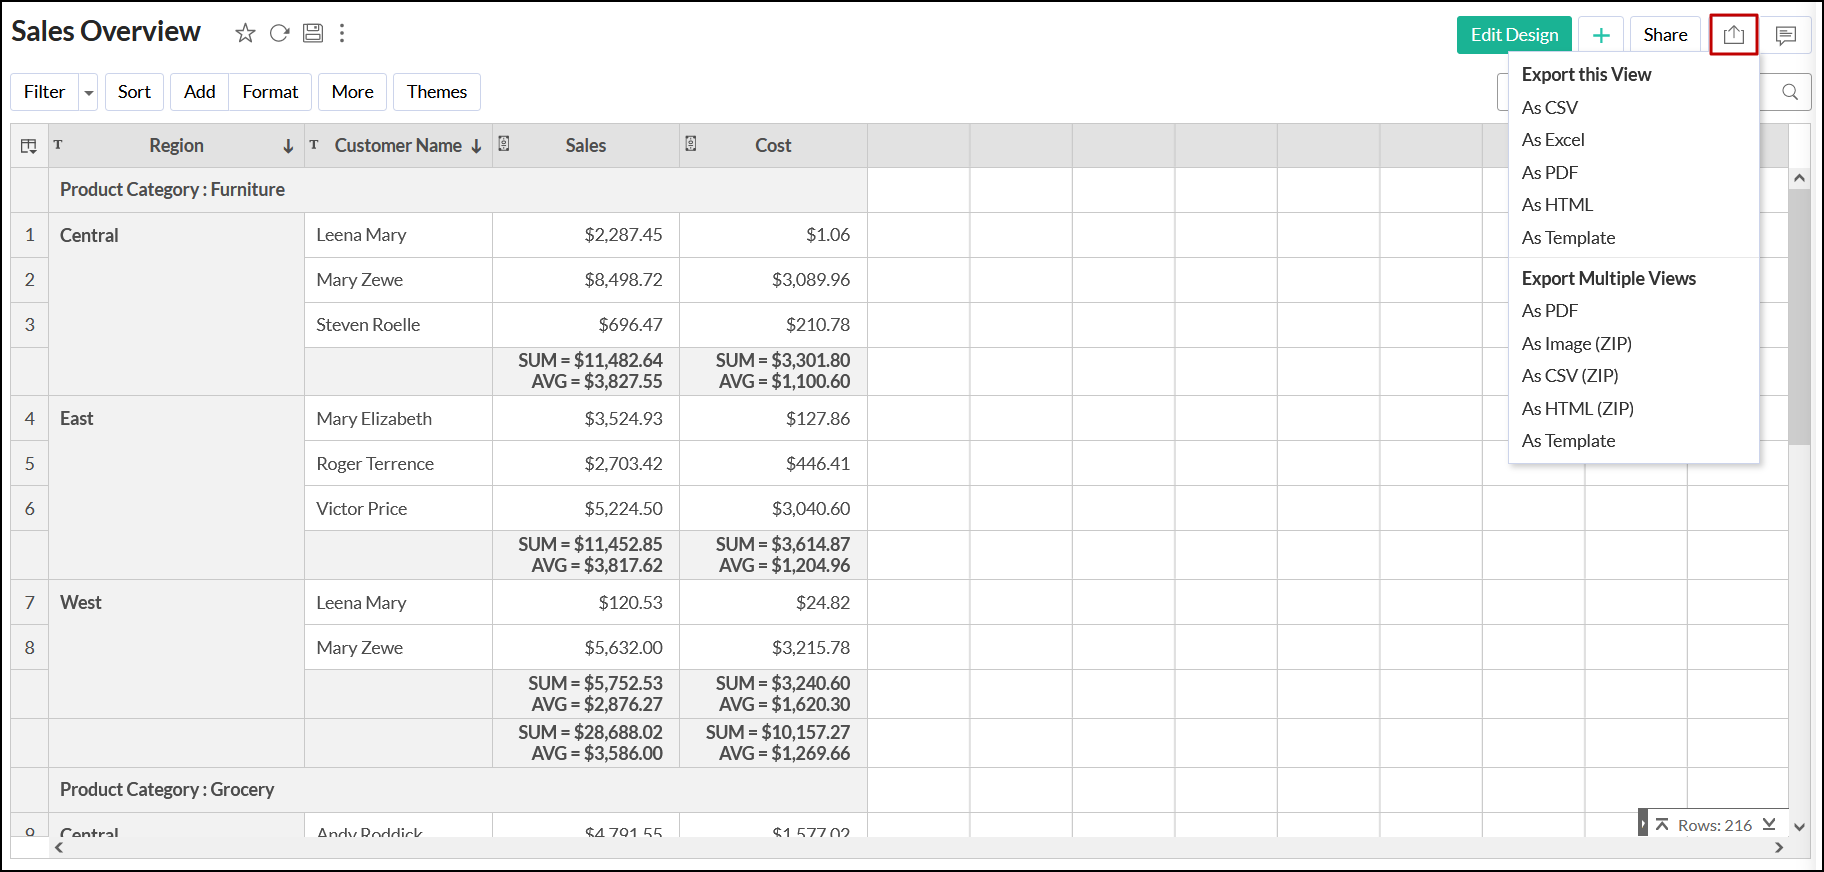
The following export options are available:
As CSV: This option allows you to export the tabular view as a Comma Separated Value (CSV) file.
As Excel: This option allows you to export the tabular view as an excel file.
As PDF: This option allows you to export the tabular view in a Portable Document Format (PDF) file format.
As HTML: This option allows you to export the tabular view in an HTML file format.
As Template: This option allows you to export the tabular view as a template file that can be used to recreate this tabular view across other workspaces. Click here to learn more about importing views from templates.
In the Export As page that opens, provide the required specifications, and click Export. Click here to learn more about exporting a tabular view.

