Customizing Geo Charts
Customize how a Geo Map looks and behaves from the Settings panel. You can change the base map, select the countries or states displayed, style markers and clusters, add data labels, configure the legend, control drill behavior, and choose what Zia Insights analyzes.
To open the settings:
- Open the Geo Map in edit mode.
- Click the Settings icon at the top-right corner of the report. The Settings panel opens on the right.
- Make the required changes. The map updates as you change its settings.
- Click Save.
The Settings panel contains four tabs. The available options depend on the map type and the columns used in the report.
| Tab | Use it to |
|---|---|
| Map | Change the base map, projection, country view, markers, clusters, and data labels |
| General | Edit the title and description, column formats, legend, and drill options |
| Analysis | Manage supported analytical features such as trend lines, anomaly or outlier analysis, and cluster analysis |
| Zia Insights | Choose the columns and insight categories Zia analyzes |
Map tab
The Map tab contains four sections. Map Styles controls the background, Map Controls determines the area and geographical information shown, Markers styles the plotted data, and Data Label displays values directly on the map.
Map Styles
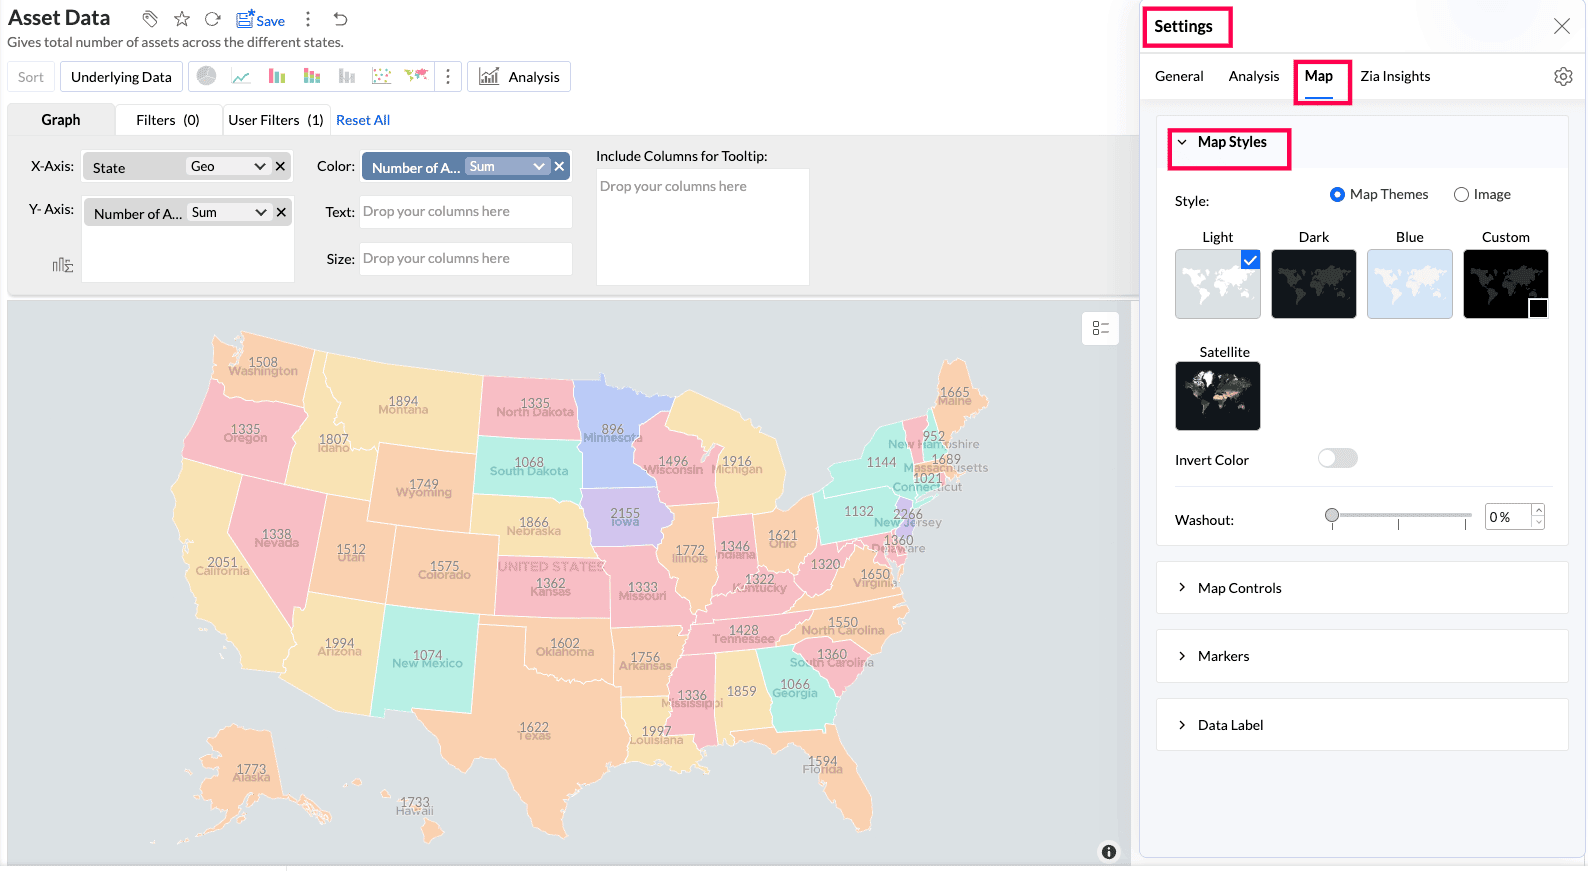
Use the Style option to choose the map background. Select Map Themes for a built-in base map or Image to plot data over an uploaded image. Map Themes is selected by default.
Map Themes
| Theme | Appearance |
|---|---|
| Light | Light gray water and white land |
| Dark | Dark gray water and lighter land |
| Blue | Light blue water and white land |
| Custom | A map based on the color you select |
| Satellite | Satellite imagery |
- Invert Color: Switches the colors used for the water and land areas. This option is not available for Satellite.
- Washout: Fades the base map so the plotted points and layers stand out more clearly. The default is 0%.
Image
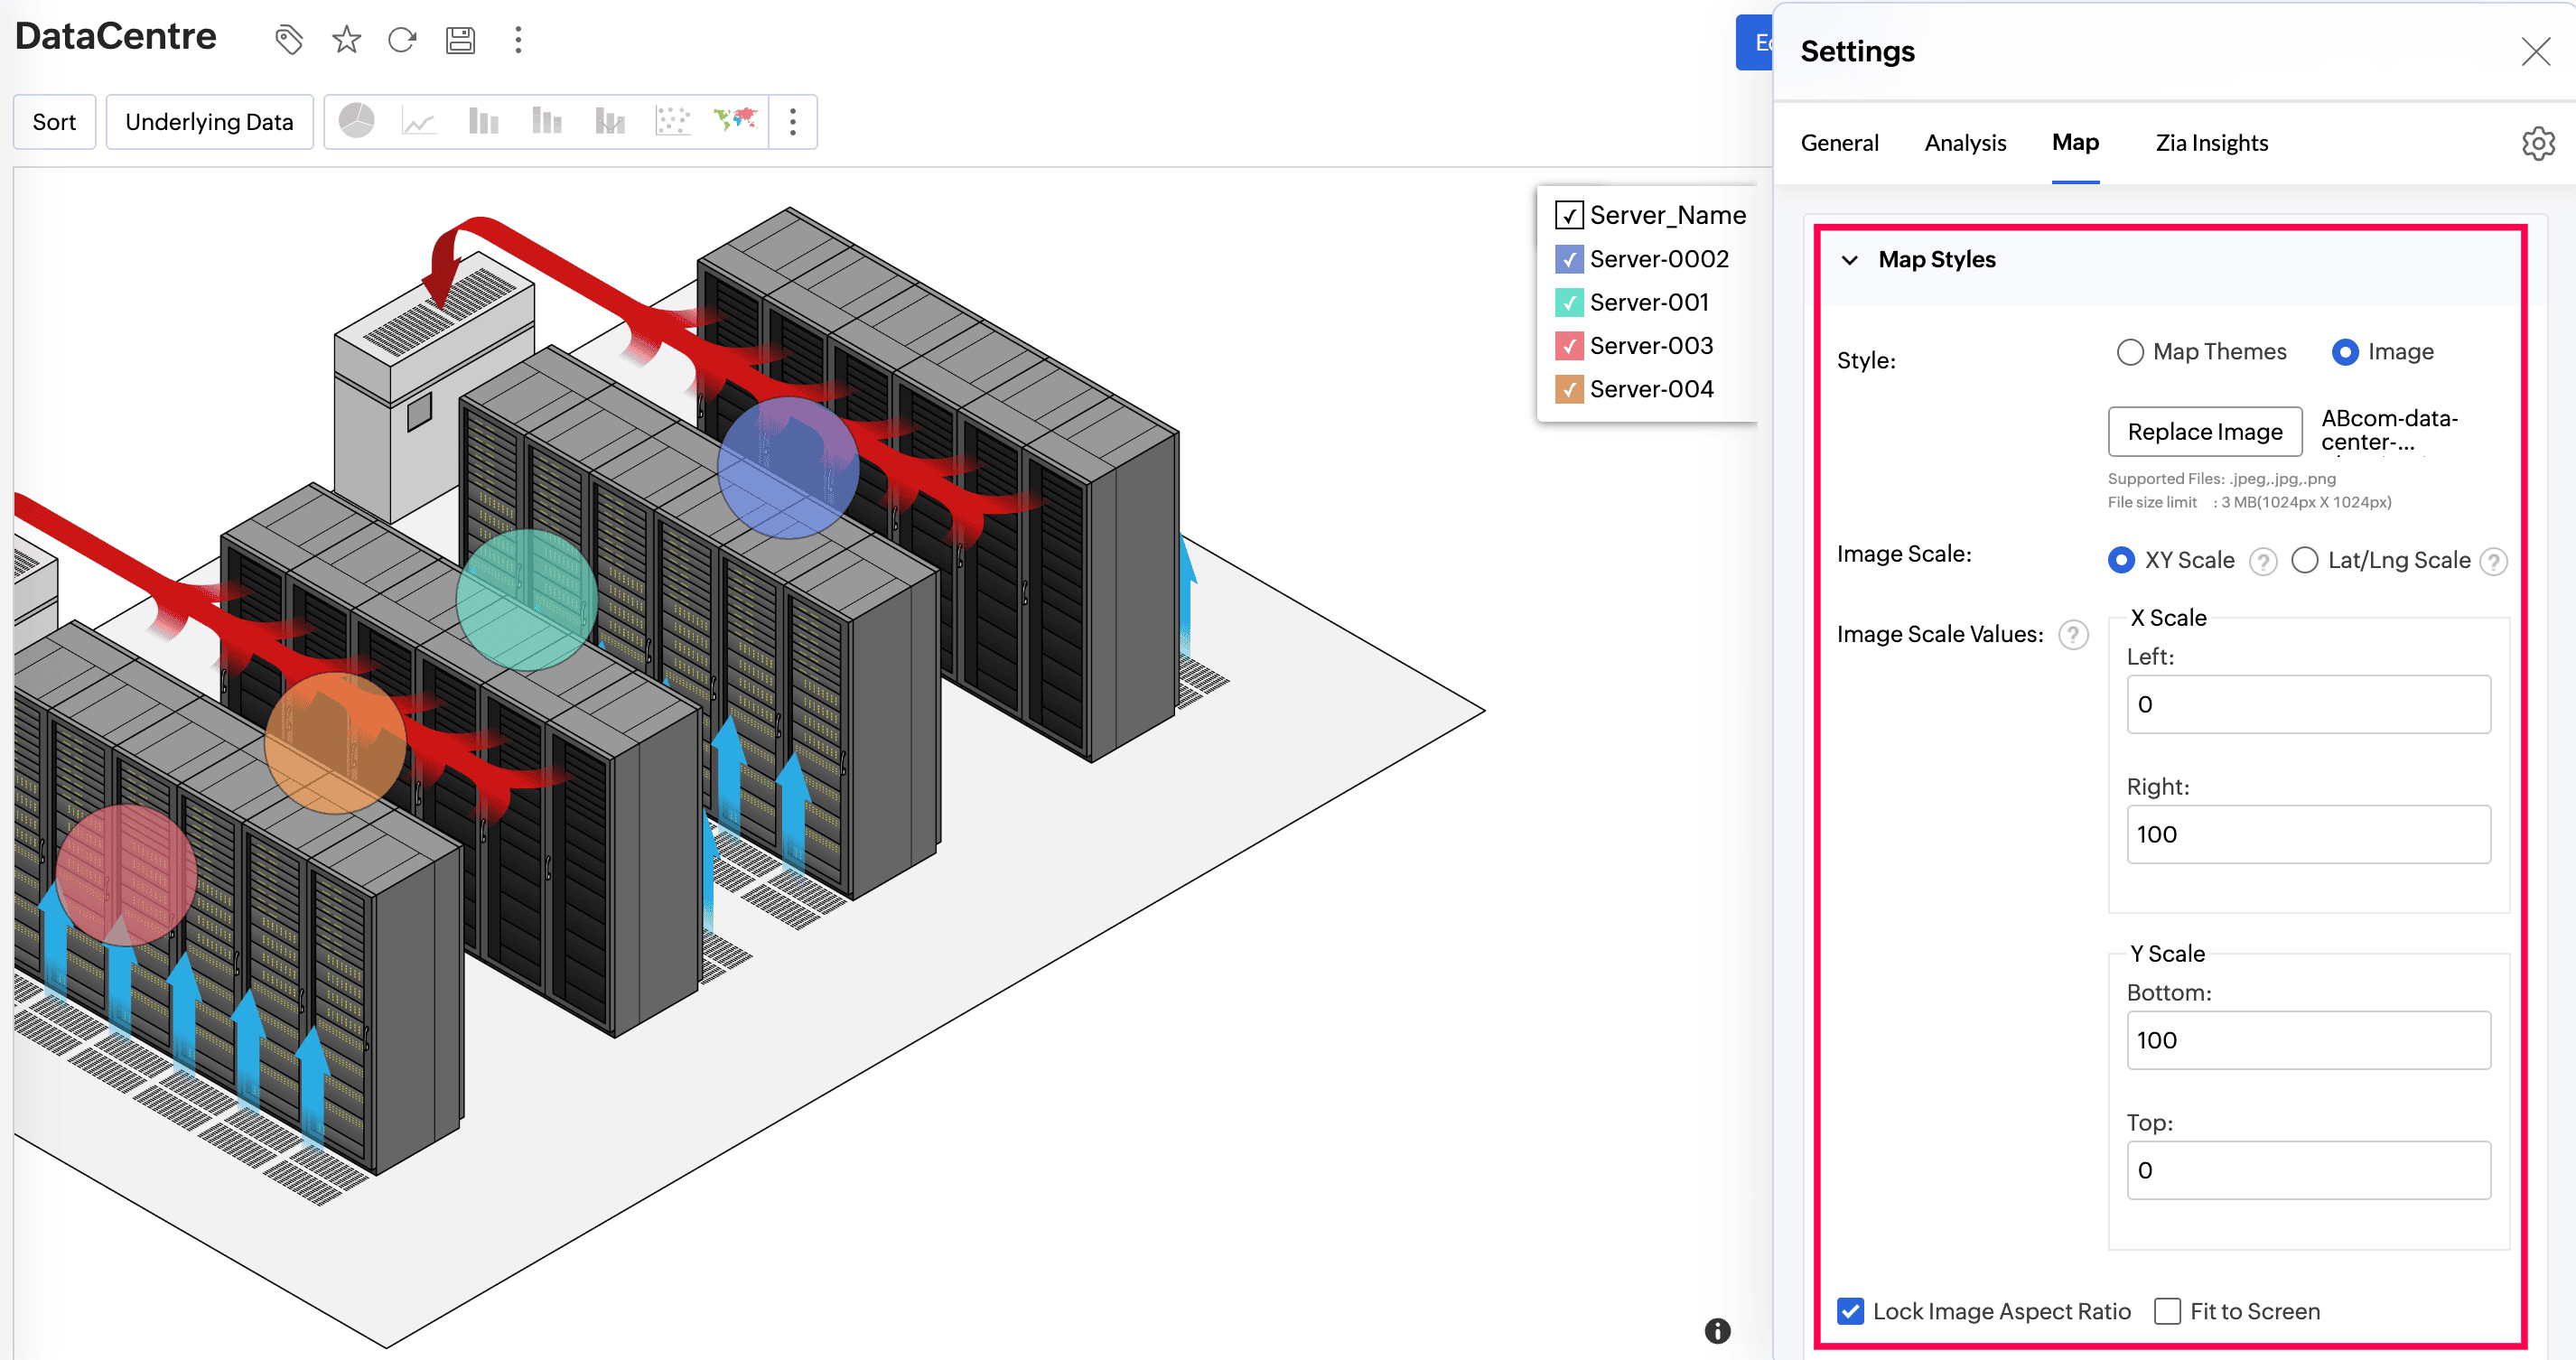
Plot coordinates or geo locations over an image, such as a data-center floor plan, campus layout, rack diagram, or network topology background. For a complete example, see Maps with an image background.
Before switching to an image, ensure the columns in the X-Axis and Y-Axis shelves are geo columns. If they are not, open the function drop-down for each column and select the appropriate Longitude or Latitude geo function.
- Replace Image: Upload or select the background image.
- Image Scale: Select XY Scale for image coordinates or Lat/Long Scale for geo locations.
- Image Scale Values: Define the boundaries of the plot area. Points outside these boundaries are not plotted.
- Lock Aspect Ratio: Retains the image's original proportions.
- Fit to Screen: Expands the image to fill the chart area. Use it with Lock Aspect Ratio to scale the image evenly.
- Image Position: Determines where the image appears in the chart area.
- Image Opacity: Controls the transparency of the background image.
Map Controls
Use Map Controls to choose the projection and geographical area displayed and to control map labels, layers, and the background.
Projections
A projection determines how the map is drawn. Select one based on the geographical scope of the data.
- Mercator Projection: The default projection for world and country maps.
- Albers USA Projection: Intended for US-focused data and shows Alaska and Hawaii near the other states. Data from other countries is not displayed. This projection is not available for Map - Hexbin.
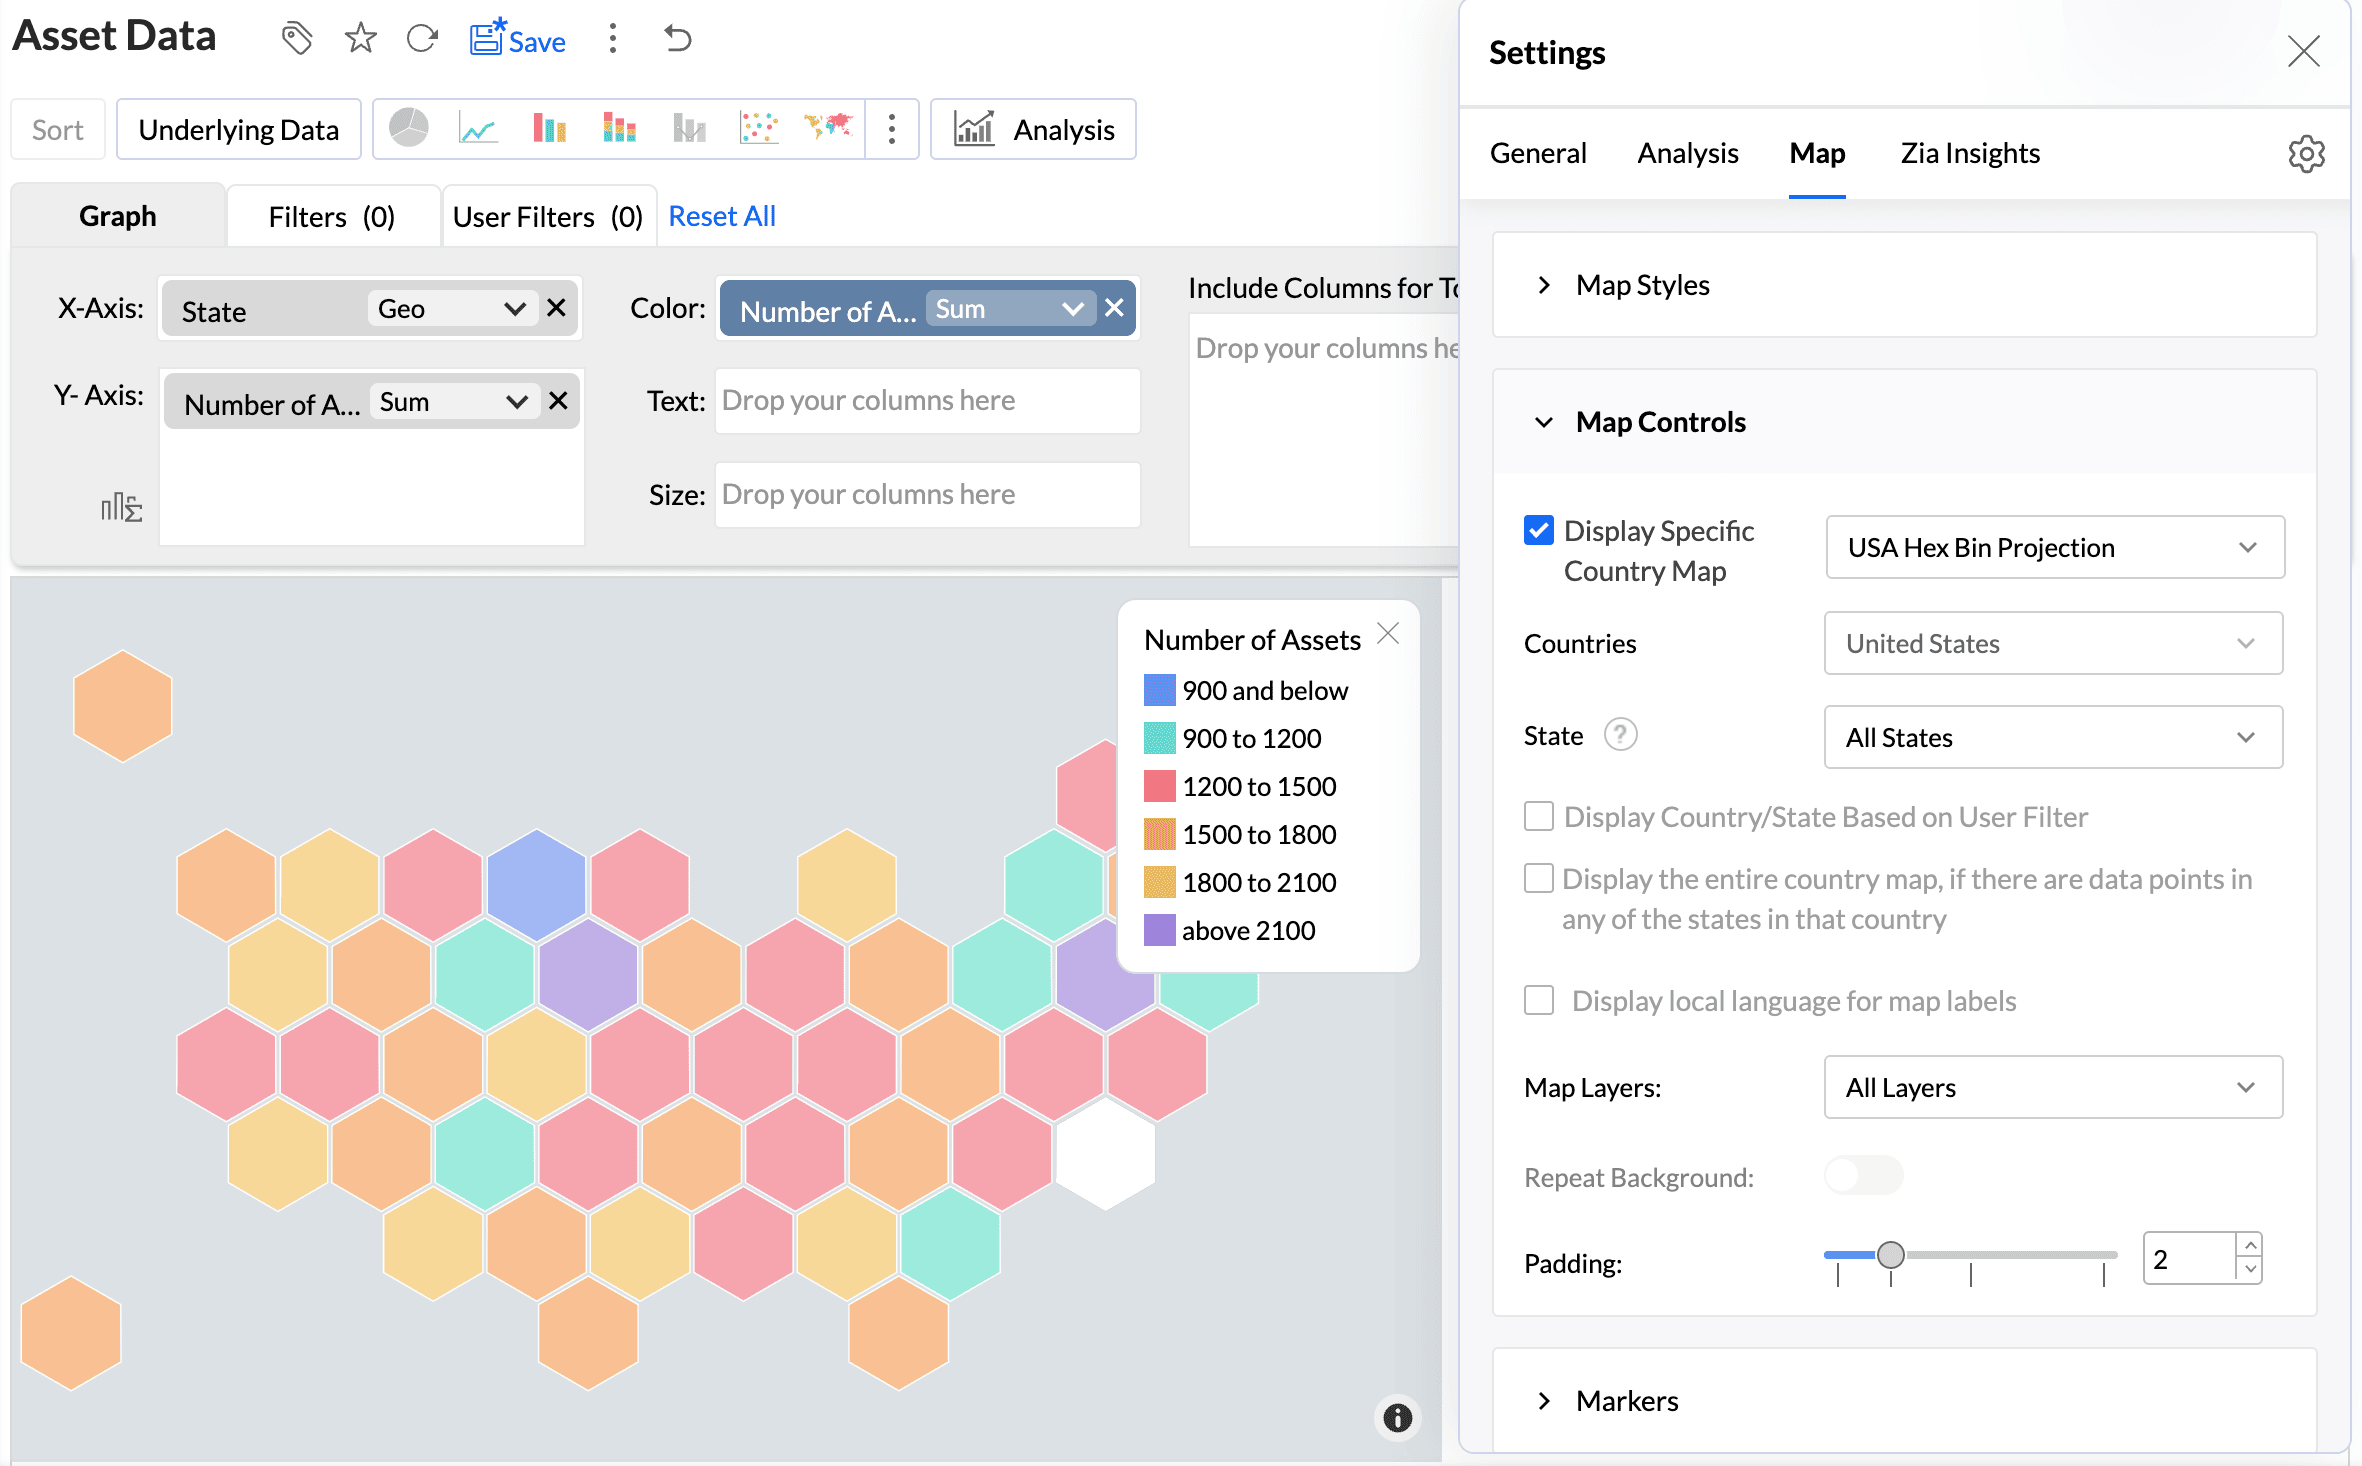
- USA Hex Bin Projection: Represents every US state as an equal-size hexagon. It supports state-level visualization only; city, county, and non-US data are not displayed. This projection is not available for Map - Hexbin.
Display a specific country or state map
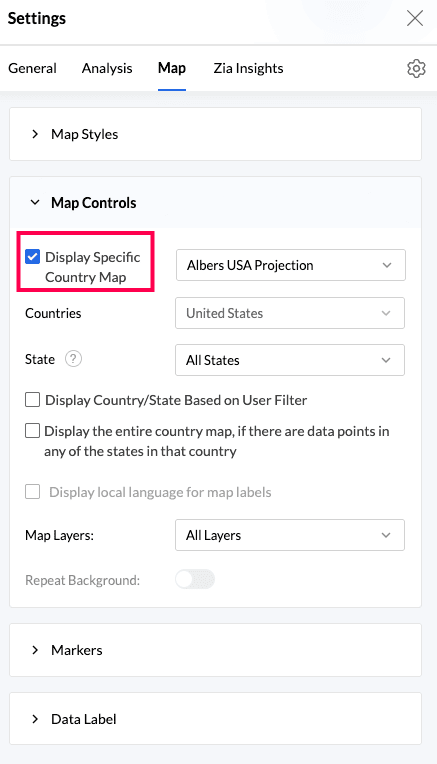
- Select Display Specific Country Map.
- Select a projection from the adjacent drop-down.
- In Countries, select All Countries or the required countries.
- In State, select All States or the required states. The list contains states from the selected countries.
Two additional options determine which areas appear:
- Display Country/State Based on User Filter: In view mode, displays only the countries or states selected in a user filter. This option is available only when Display Specific Country Map is enabled.
- Display the entire country map, if there are data points in any of the states in that country: Displays the complete country when any of its states contains data.
Map labels, layers, and background
- Display local language for map labels: Displays country, state, city, and continent names in the local language of each geographical region. English is used by default.
- Map Layers: Adds or removes geographical details such as country or state borders, water borders, roadways, airports, and railways.
- Repeat Background: Repeats the map background when users pan or zoom beyond its boundary.
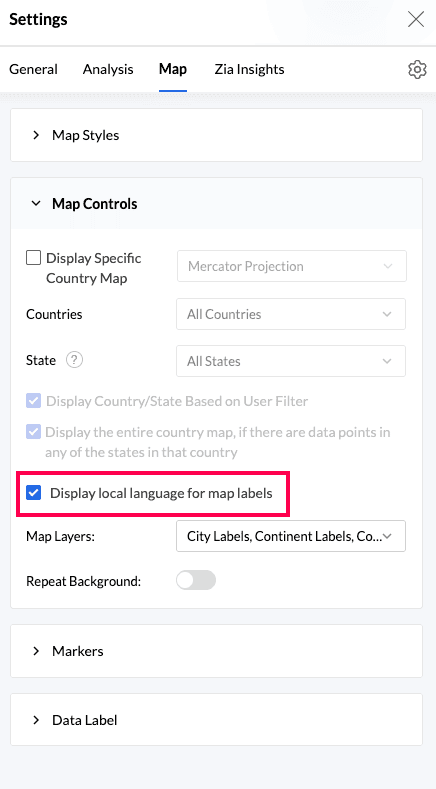
- Local-language labels are not available when Display Specific Country Map is enabled.
- For Albers USA and USA Hex Bin projections, enabling local-language labels produces no visual change because US labels remain in English.
- The language setting changes geographical map labels only. It does not change data values, legends, tooltips, or axis labels.
- Repeat Background is enabled by default for Satellite maps and is not available for country-specific maps.
Markers
The Markers section changes how points, bubbles, pies, filled regions, heat maps, and clusters appear. The available options depend on the map type.
| Map type | Marker options |
|---|---|
| Map - Scatter | Marker Type, Marker Fill Color, Stroke Color, Marker Size |
| Map - Bubble | Marker Fill Color, Stroke Color, Marker Size, Fill Opacity |
| Map - Pie | Marker Size, Fill Opacity |
| Map - Bubble Pie | Marker Size, Fill Opacity |
| Map - Filled | Fill Opacity |
| Geo Heat Map | Heat Radius, Heat Intensity, Heat Opacity |
| Cluster Map | Cluster Type, Font Size, Cluster Area, Cluster Opacity, Marker Size |
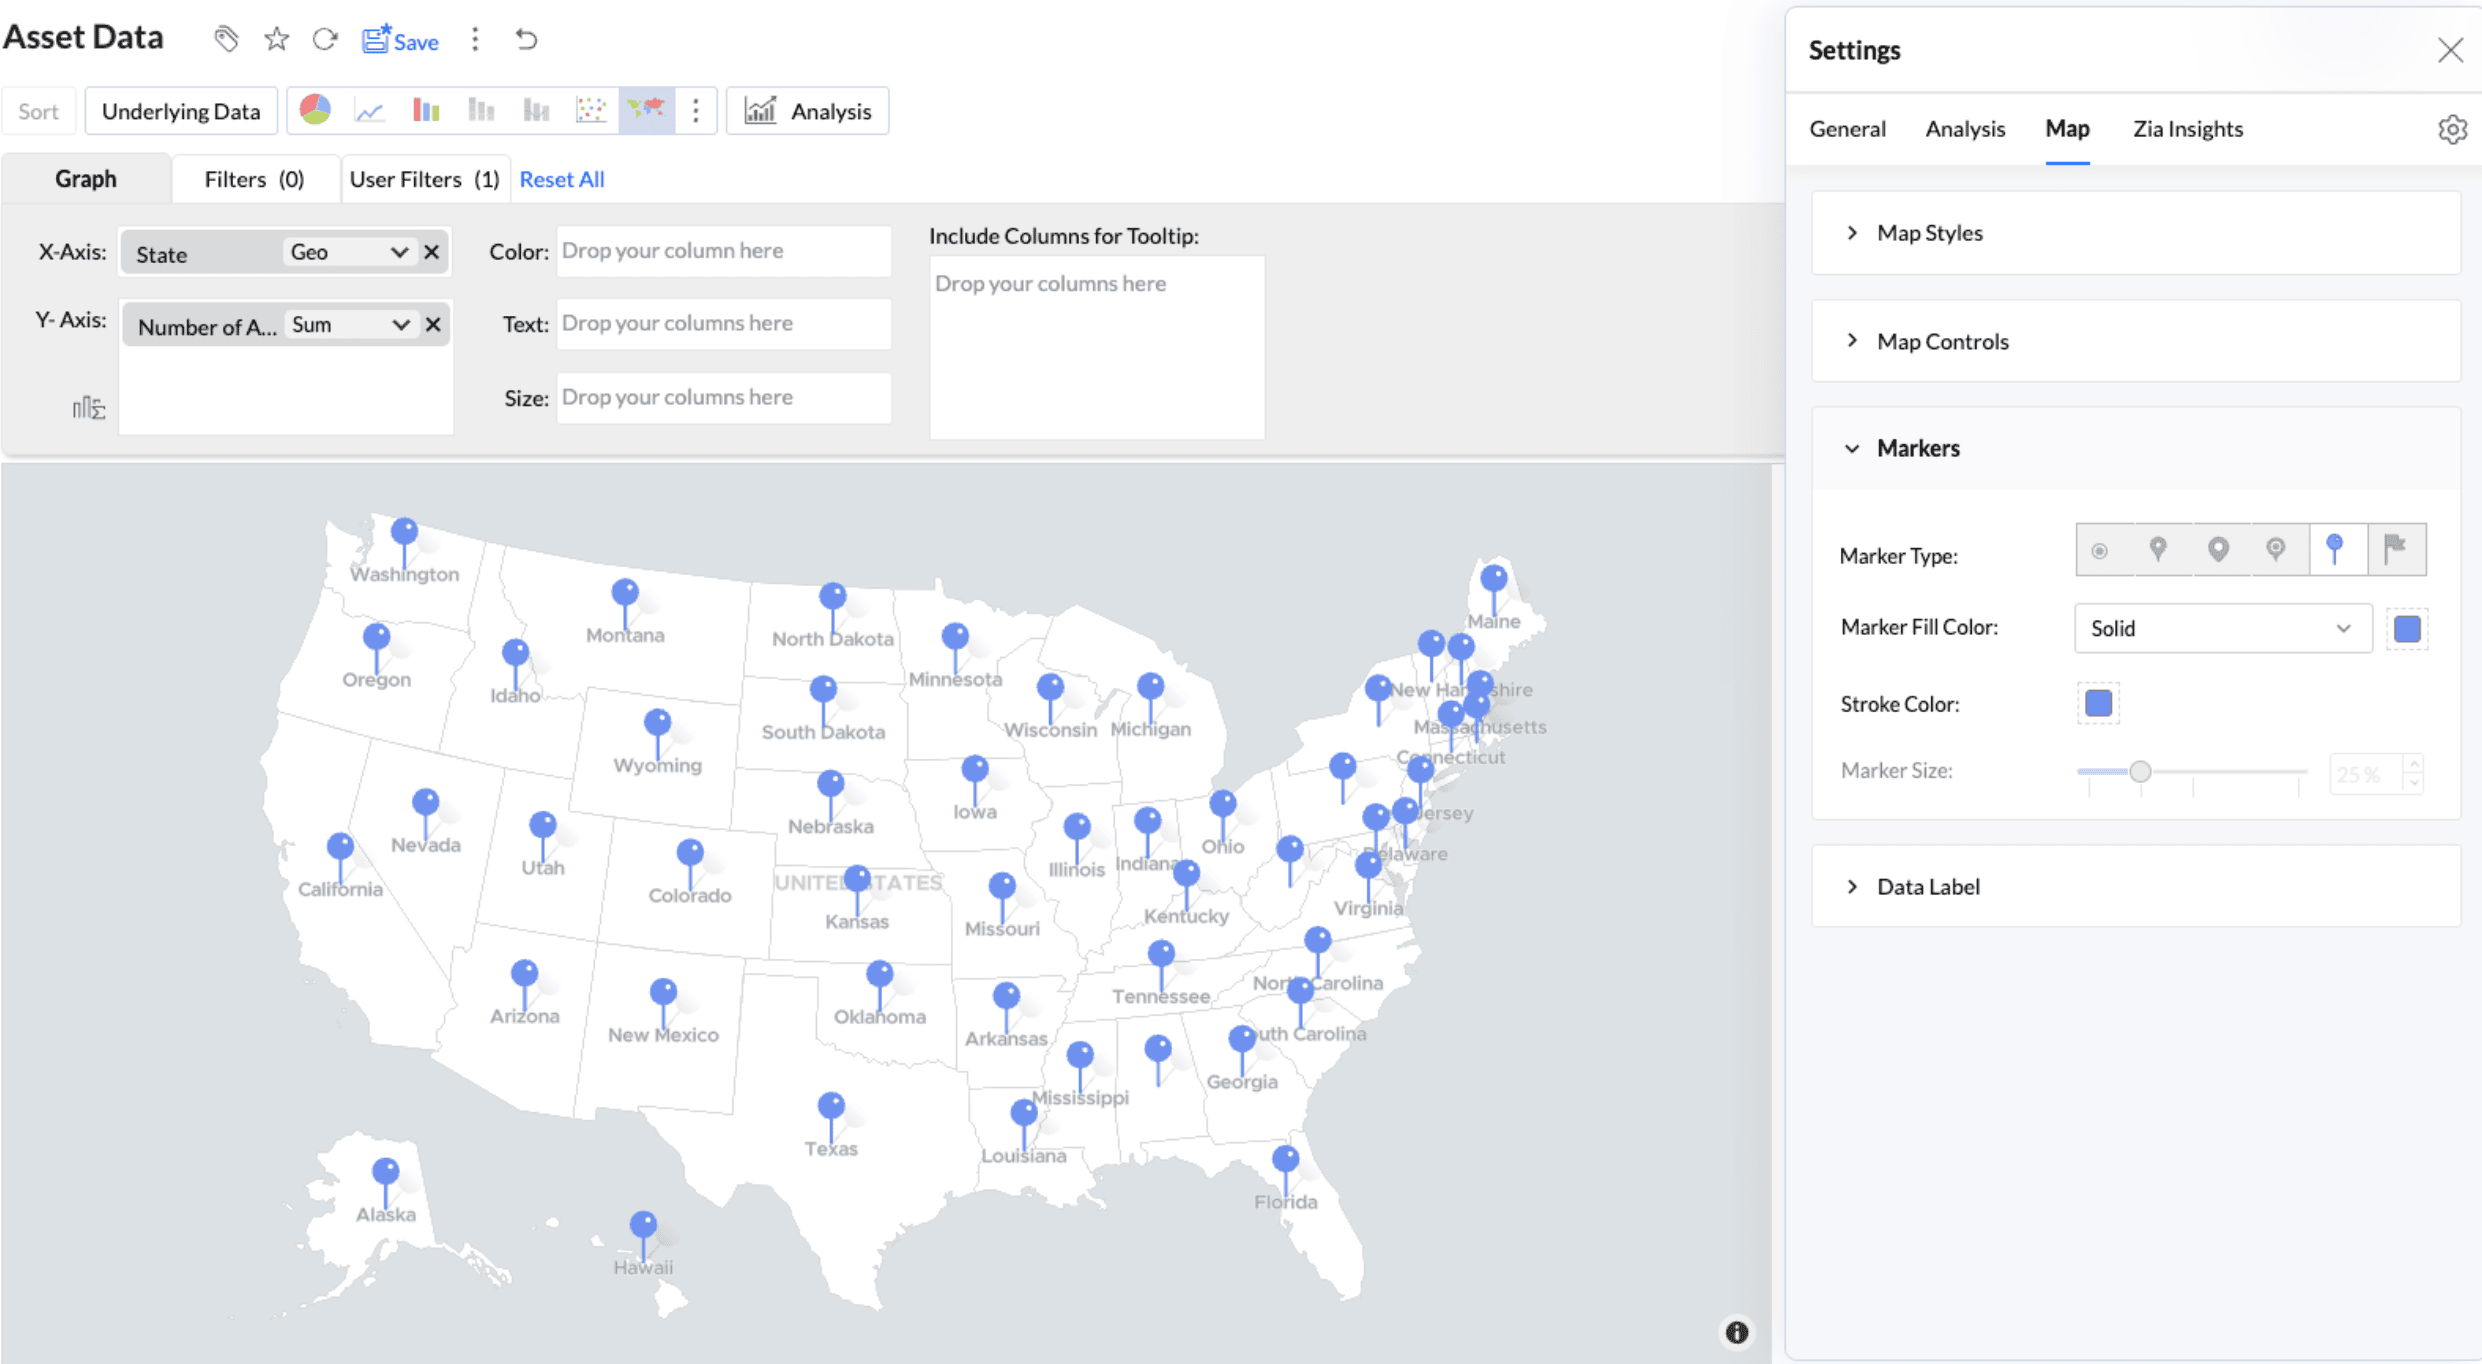
- Marker Type: Sets the point shape for Map - Scatter. Six marker types are available.
- Marker Fill Color: Sets a solid or patterned marker color.
- Stroke Color: Sets the outline color.
- Marker Size: Changes the size of markers or points.
- Fill Opacity: Controls the transparency of markers or regions.
- Heat Radius: Sets the area around each point that contributes to the heat map.
- Heat Intensity: Controls how strongly the heat map shows variations in density.
- Heat Opacity: Controls the transparency of the heat layer.
- Cluster Type: Switches between Bubble clusters and Hex cells. The map updates immediately while retaining the configured color, area, and opacity.
- Font Size: Sets the size of the count displayed on each cluster.
- Cluster Area: Sets the size of each Bubble or Hex cluster from 0% to 100%.
- Cluster Opacity: Controls cluster transparency so the underlying map labels remain readable.
Note: Marker Fill Color cannot be changed here when a column is present in the Color shelf. Change the colors from the Legend section of the General tab.
Data Label
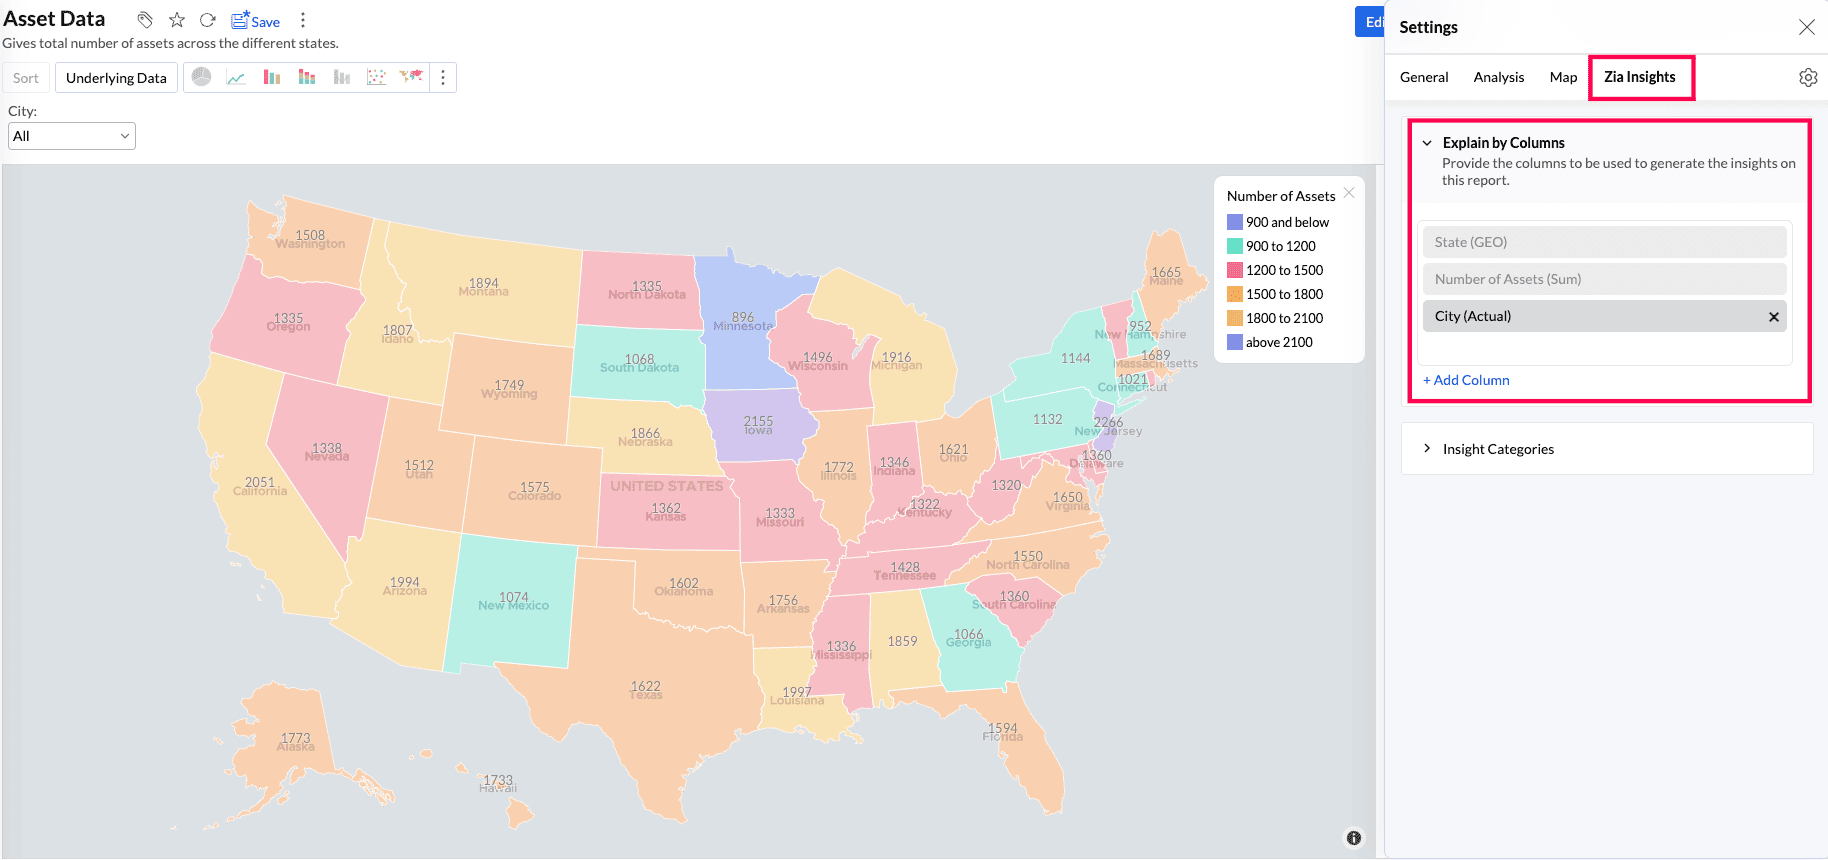
Data labels display values directly on the map so users can read them without opening a tooltip.
| Option | What it does | Default |
|---|---|---|
| Show corresponding Y-axis value as data label on the chart | Displays the value on each marker or region | Off |
| Font | Sets the font, size, style, and color | Default |
| Data Label Opacity | Controls label transparency when labels are enabled | 100% |
| Overlap Data Label | Displays all labels even when they overlap | Off |
General tab
Use the General tab to change the report title and description, column formats, legend, and drill behavior.
Basic
Change the report title, add a description, specify the label displayed for missing values, and choose whether to show missing values.
Format
Change the display format of the columns used in the report. The available options depend on the column's data type.
Legend
The legend identifies the data series and the color assigned to each one. For Geo Maps, the legend is displayed on the right by default.
| Option | Description |
|---|---|
| Legend Position | Show the legend on the right or hide it. Enable Collapse by Default when the legend should initially appear collapsed. |
| Title | Show, hide, rename, and format the legend title. |
| Font | Format the legend items. |
| Legend Filters | Allow users to select legend items to filter data series in view mode. |
| Palette Type | Select Solid Color, Monochrome, or Gradient. |
| Color Palette | Select a predefined or workspace color palette. |
| Colors | Override the color of an individual data series or restore palette colors. |
- To display a continuous low-to-high color range, set Palette Type to Gradient.
- Geo Heat Map and Cluster Map use the same Low-to-High gradient legend options.
- Pattern palettes are not supported for Geo Maps.
Drill
- Drill Down: Lets users open progressively more detailed levels of data from a selected location.
- Drill Through: Opens a related report or dashboard and passes the selected location as a filter.
- Drill Actions: Runs a configured action from a location, such as opening a related record or starting an external workflow.
Analysis tab
The Analysis tab lists supported analytical features such as Forecast, Trend Line, Anomaly or Outlier, and Cluster Analysis. The options available depend on the map type and the columns used in the report.
Zia Insights tab
Zia Insights generates narrative explanations using the metrics and dimensions in the report. Use the tab to control the columns and types of insights included in the analysis.
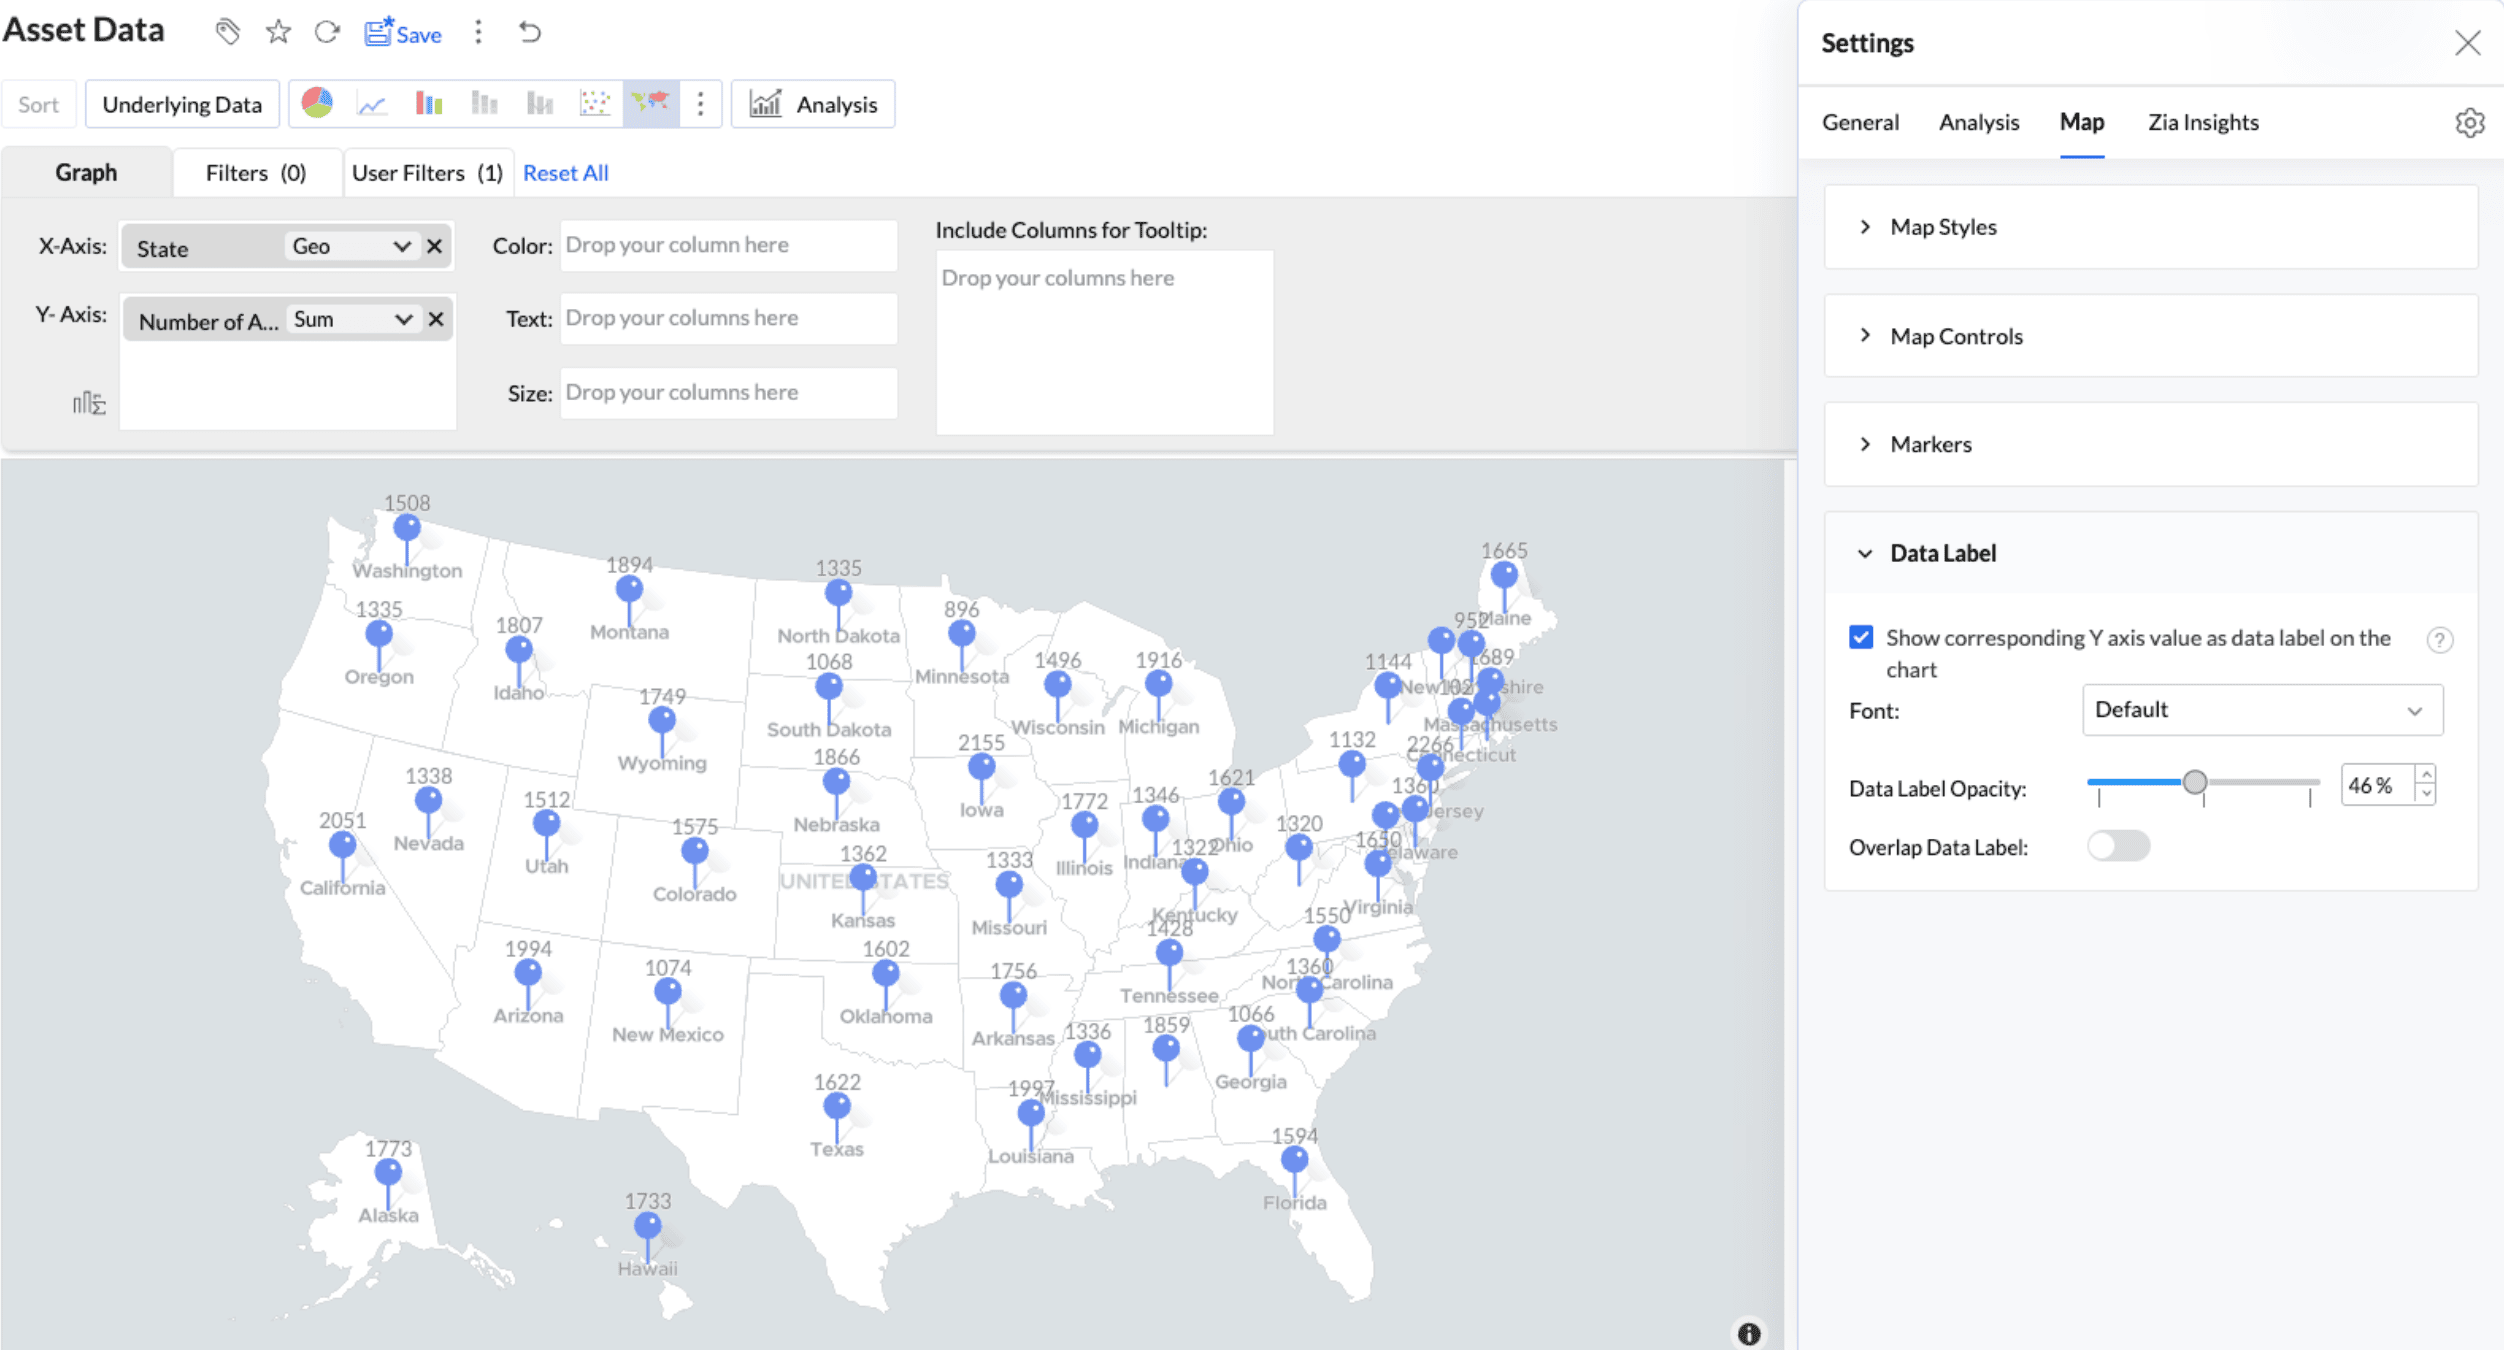
Explain by Columns
Select the metrics and dimensions Zia should analyze. All report columns are selected by default. Choose at least one measure and one dimension, and use Add Column to include other relevant fields.
Insight Categories
Select the types of insights Zia should generate:
- Contribution Analysis: Identifies the factors that contribute most to an overall result.
- Time Series Insights: Identifies trends, patterns, anomalies, and forecasts in time-based data.
- Comparison Between Dimensions: Compares a metric across categories or operational groups.
- Analysis of Measures: Examines relationships between measures.
Set the default map view
By default, a map opens fitted to its data. To open it at a specific area and zoom level, pan and zoom to the required view and select Set current view as Home from the Home option in the map toolbar. Select Reset to Default to restore the original view.
Frequently asked questions
1. Where do I find the map settings?
Open the map in edit mode and click the Settings icon at the top-right corner of the report.
2. Why can't I change the marker color?
A column is present in the Color shelf, so the colors are controlled by the legend. Change them from the Legend section in the General tab.
3. Can I change where the legend appears?
Use Legend Position in the General tab. Geo Map legends can be displayed on the right or hidden. Enable Collapse by Default when the legend should initially appear collapsed.
4. How do I show a continuous color range?
In the Legend section, set Palette Type to Gradient.
5. How do I show only one country?
Open Map Controls, enable Display Specific Country Map, and select the required country.
6. Why are map labels still displayed in English?
Local-language labels are not available for country-specific maps. They also produce no visible change with the Albers USA and USA Hex Bin projections. The setting changes geographical labels only, not data values, legends, or tooltips.
7. How do I make the plotted data stand out?
Increase Washout to fade the base map, select the Light theme, or reduce the Fill Opacity of the markers.
8. How do I make the map open at a particular area?
Pan and zoom to the required view and select Set current view as Home from the Home option in the map toolbar.