Analyze data with Ask Zia
Ask Zia uses agentic capabilities to turn an analytical goal into a coordinated sequence of actions. It selects the appropriate specialized agent, works with the relevant IT data, and helps you create and refine reports or dashboards, investigate trends and anomalies, explain findings, and identify areas for further analysis.
Use the links below to go directly to a capability:
- Invoke Ask Zia
- Add context for Ask Zia
- Visualization Agent
- Analysis Agent
- Create slideshows
- Provide feedback
Invoke Ask Zia
Open Ask Zia from the side navigation panel or the workspace navigation bar. The conversational interface lets you enter prompts, provide relevant data context, and work with the agents available for the requested task.
Add context for Ask Zia
Context helps Ask Zia identify the data that is relevant to a question and produce more focused responses. Select Add context from the prompt bar, and choose a table or semantic model.
Tables
Use table context to select the tables and columns Ask Zia should consider.
- Select Tables under Context.
- Search for the required tables or columns. You can also filter the available items.
- Expand a data source or table to review its columns.
- Select the tables or columns to include. Use Select All Tables to select or clear all available tables.
- Click Apply.
Ask Zia uses only the selected data when interpreting the prompt.
Semantic model
A semantic model provides business-oriented context through defined concepts, metrics, and relationships. Select Semantic Model under Context, choose the required model and configuration, and click Apply.
Visualization Agent
The Visualization Agent turns natural-language requirements into reports, dashboards, charts, and summary widgets. Use it to explore service desk, application, network, infrastructure, or other IT operations data without configuring every visualization manually.
Create reports
- Open Ask Zia from the side navigation panel.
- Describe the report you need. For example, enter Show the weekly trend of critical incidents by service. Refer to Constructing questions for guidance on framing prompts.
- Review any suggested questions, and select a suggestion when it helps refine the analysis.
- Review the generated report and the filters or groupings used.
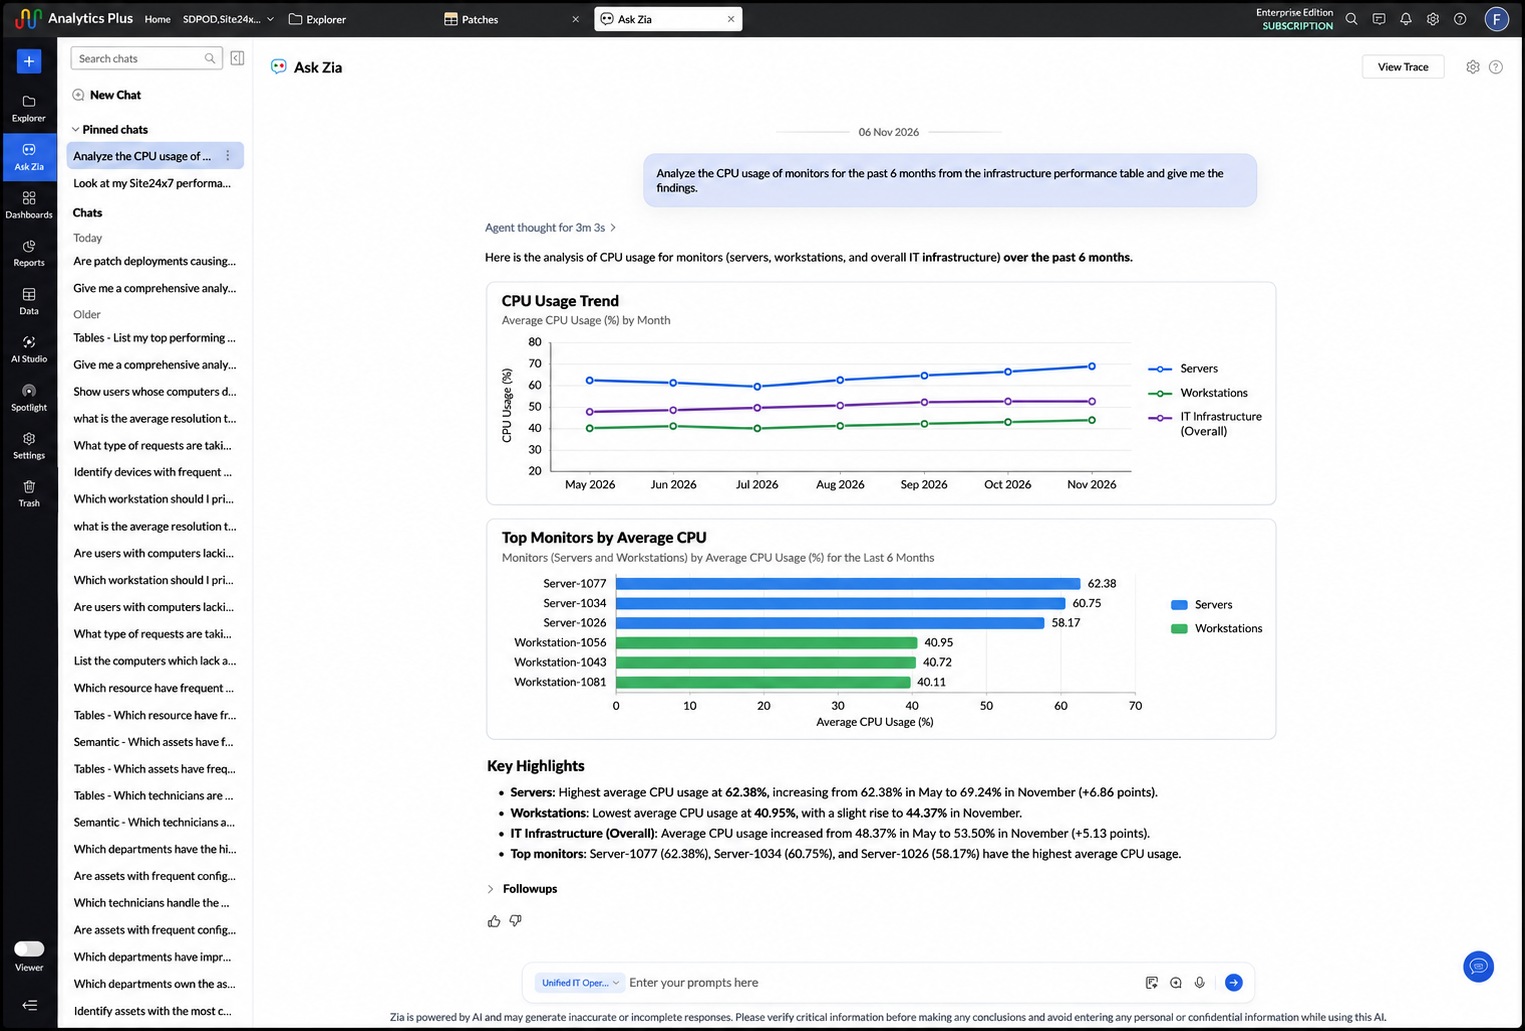
- Use the available report actions as required:
- Save: Enter a view name, select the destination folder, and save the report to the workspace.
- Change chart type: Select a visualization suited to the analysis.
- Zia Insights: Review a summary of the important findings in the report.
- Edit: Modify report settings such as axes and legends.
- Add to Dashboard: Add the report to an existing dashboard.
- Export: Download the generated report.
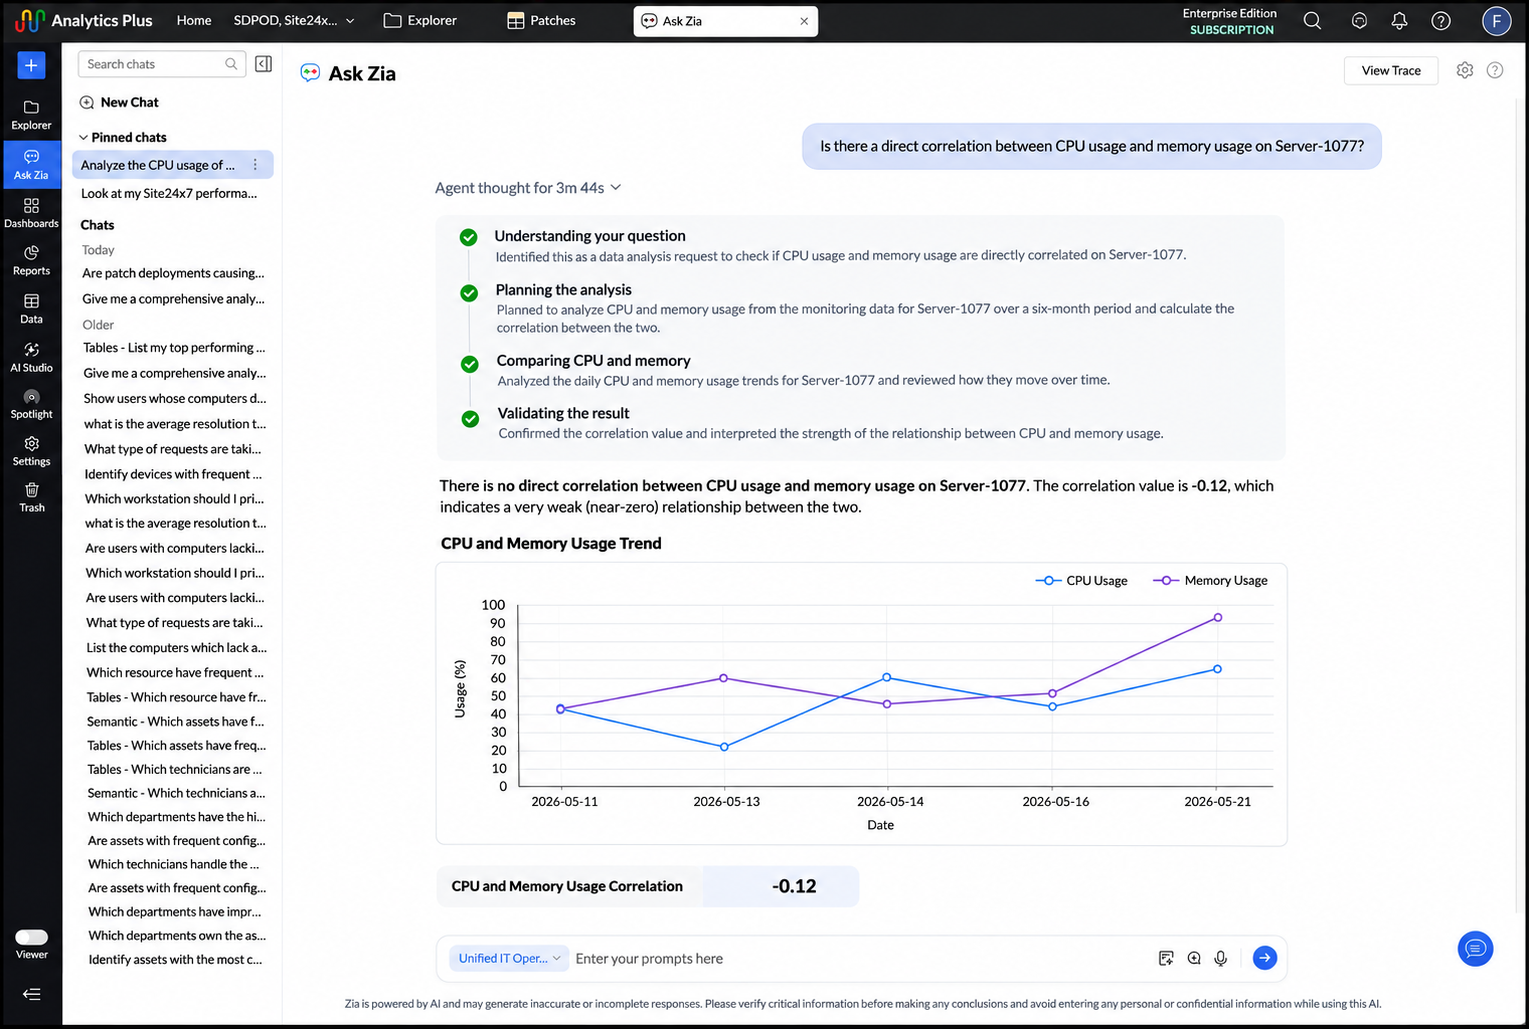
Review the agent thinking process
The Agent Thought Process option shows the intermediate steps Ask Zia uses to interpret a question and produce a response. Depending on the request, these steps can include identifying tables and columns, interpreting metrics and dimensions, choosing an aggregation, and constructing the report or analysis.
Review this information to validate the logic used for the response. For example, when you ask for month-wise incident volume, you can confirm which incident and date columns Ask Zia selected and how it grouped the records.
Review key highlights
Key highlights summarize the most important observations in a report or chart. The summary is based on the visualization's metric, dimensions, and aggregated values. It can identify contributions, comparisons, time-based trends, and forecast-related observations where applicable.
Create dashboards
Ask Zia can create a dashboard from a prompt or help refine a dashboard in the designer.
From Ask Zia
- Open Ask Zia from the side navigation panel.
- Describe the dashboard and the metrics it should contain. For example, enter Create a service desk dashboard with ticket volume, SLA compliance, and mean time to resolution.
- Click Save to add the generated views to the workspace.
- Click Open in a new tab to review or modify the dashboard.
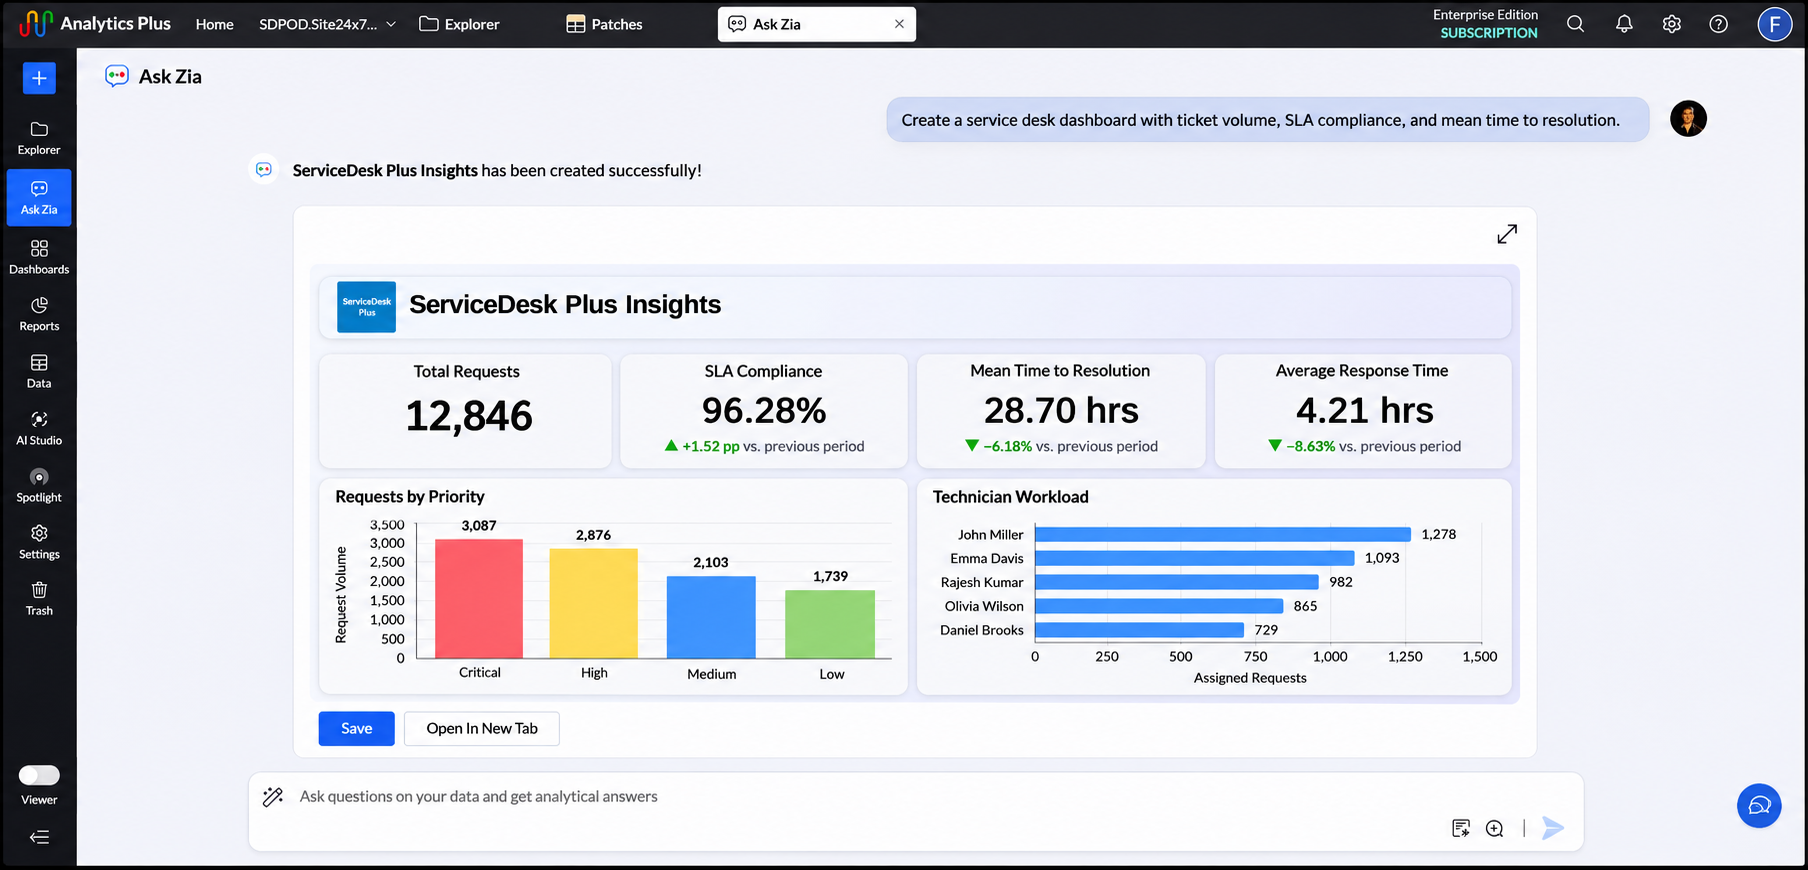
- Continue the conversation to refine the dashboard. You can request a layout, switch themes, or add and remove reports, KPIs, and widgets.
From the dashboard designer
- Click Create > Dashboard from the side navigation panel.
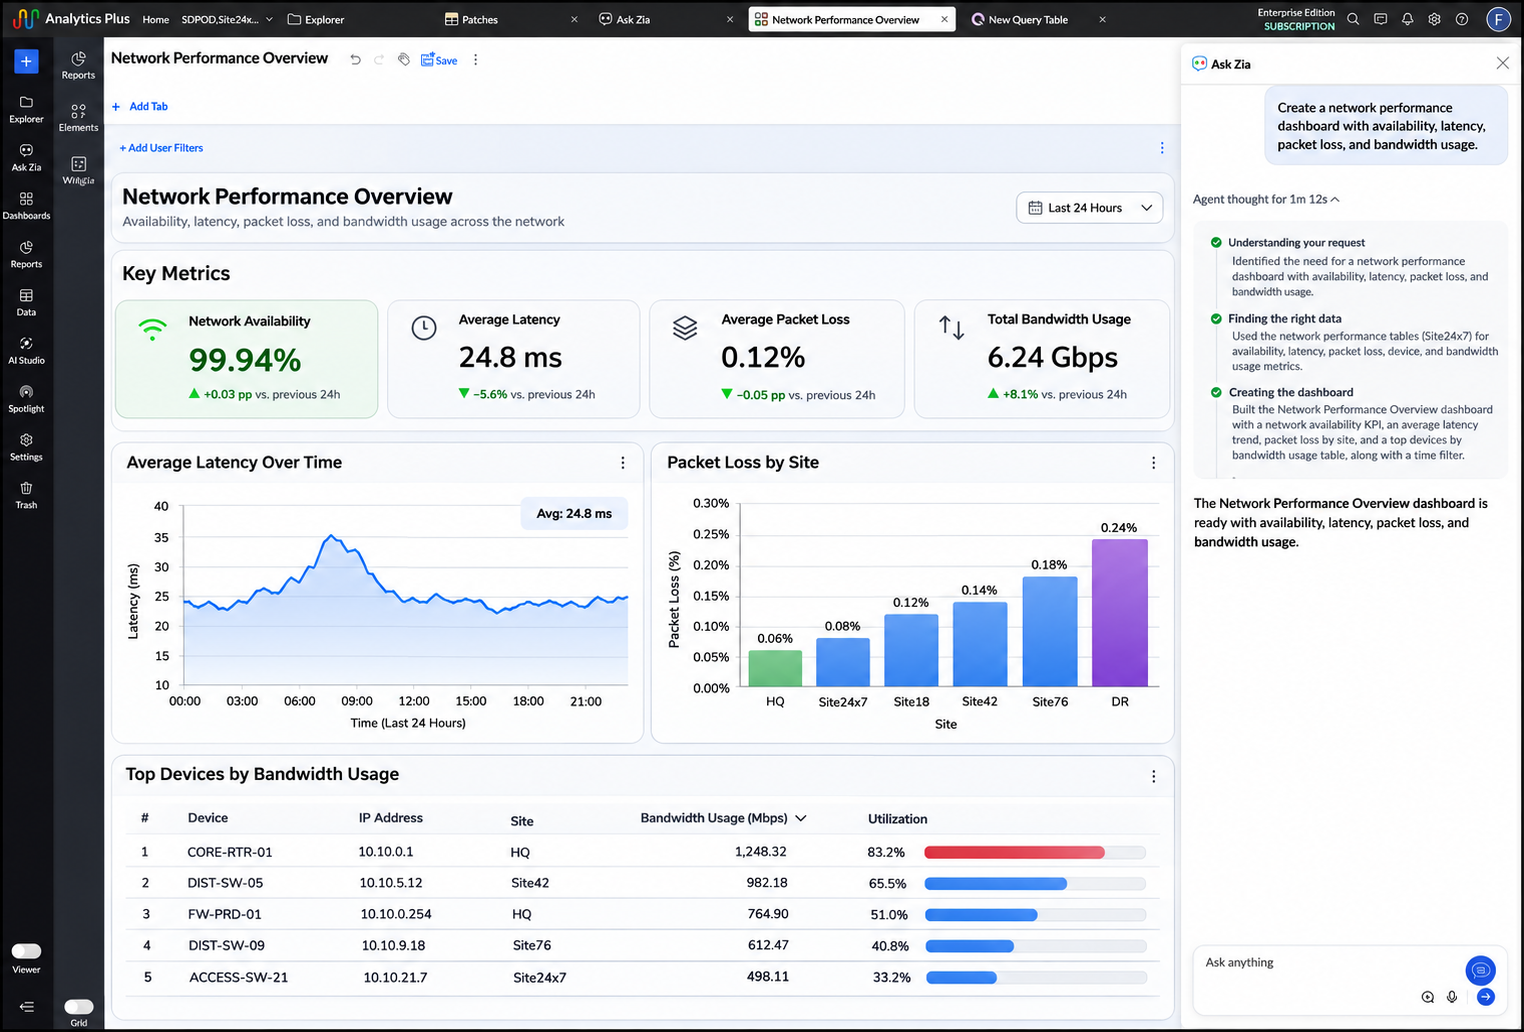
- In the prompt section, describe the dashboard and metrics you need.
- Review the changes on the dashboard canvas as the prompt is processed.
- Continue customizing the dashboard as required.
Explore data insights
Use follow-up questions to move from a broad overview to a focused investigation. Ask what happened, why a metric changed, what is likely to happen next, and which areas may require attention.
Analysis Agent
The Analysis Agent supports descriptive, diagnostic, and prescriptive analysis. It helps you understand IT performance, investigate changes, and identify possible next steps using the data available in the workspace.
Descriptive analysis
Descriptive analysis explains what happened by summarizing current and historical data, identifying trends, and highlighting patterns.
Example questions:
- How many critical incidents were created this quarter?
- Which business services experienced the most downtime?
- How did monthly SLA compliance change during the past year?
- Which support group resolved the highest number of requests?
Diagnostic analysis
Diagnostic analysis investigates why a change occurred. Ask follow-up questions to compare metrics, explore relationships, and identify factors that may have contributed to the outcome.
Example questions:
- Why did critical incident volume increase this month?
- Which factors contributed to the decline in SLA compliance?
- Why did one application experience more downtime than the others?
- Which incident categories contributed most to the increase in resolution time?

Recommendations
Ask Zia can suggest areas for further investigation or possible actions based on available data and detected trends. Evaluate every recommendation against your operational objectives, constraints, and change-management practices before acting on it.
Example questions:
- Which incident categories should the service desk prioritize to improve SLA compliance?
- Which recurring issues should be investigated to reduce ticket volume?
- Which infrastructure components require closer monitoring?
Create slideshows
Ask Zia can convert reports and dashboards into a narrative slideshow.
- Open Ask Zia from the side navigation panel.
- Describe the slideshow you need. For example, enter Create a slideshow summarizing monthly IT service performance.
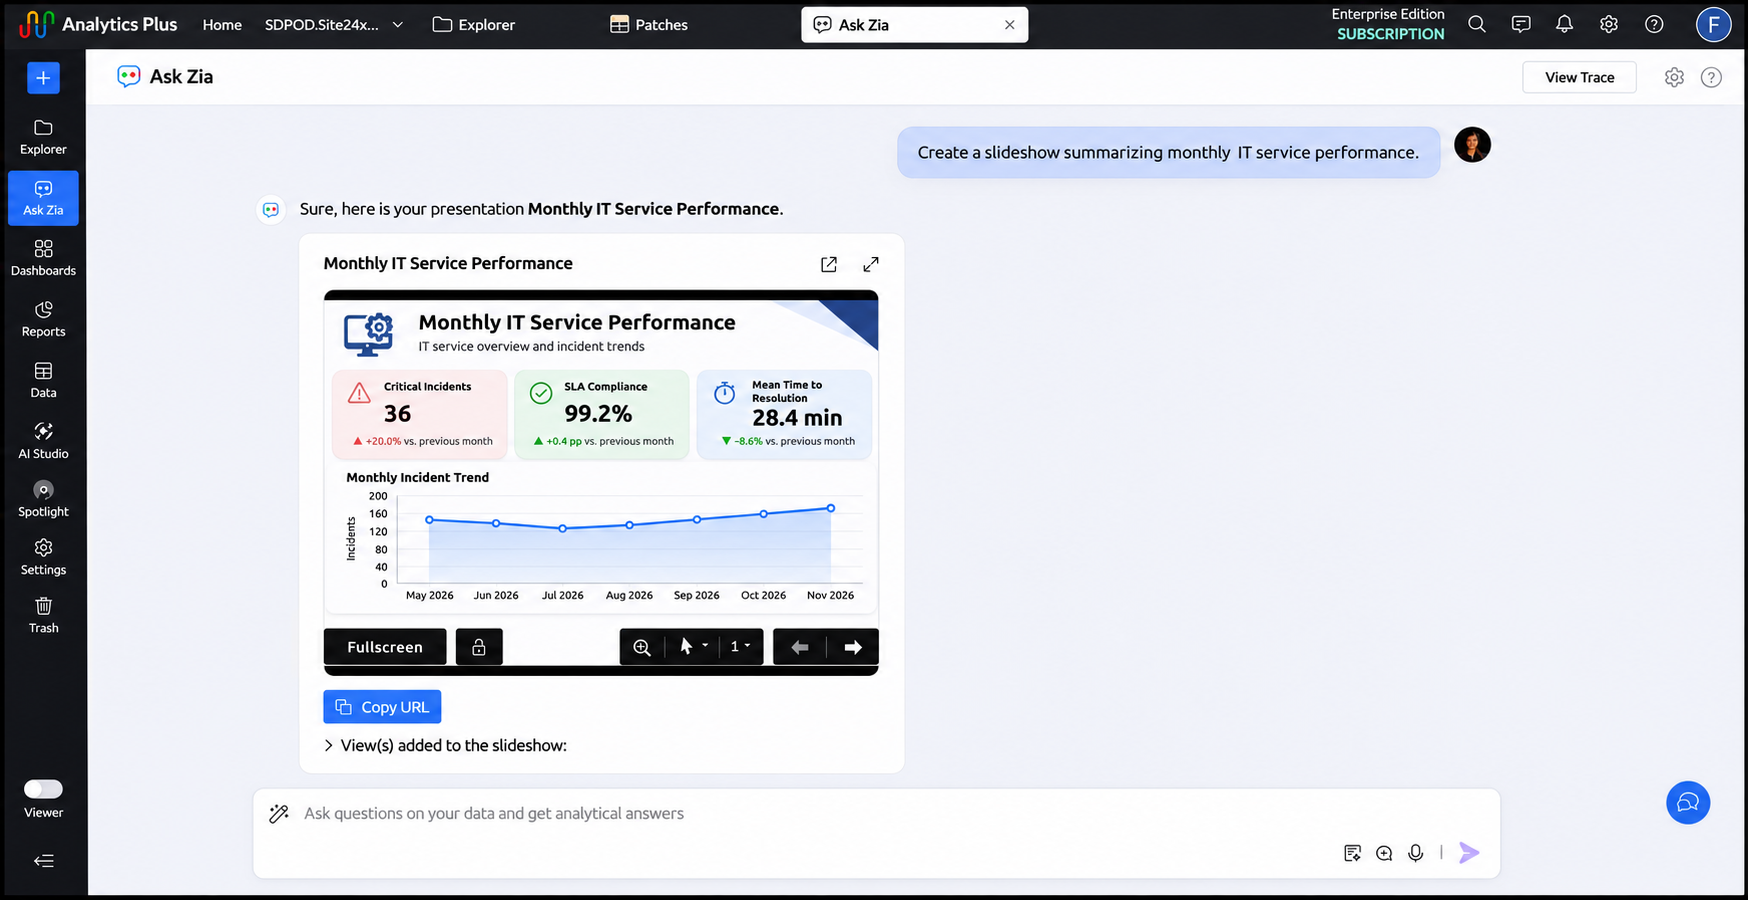
- Open the reports list to review the views used in the slideshow and add or remove views as required.
- Click Open in new tab to review the slideshow.
- Use a follow-up prompt to rename the slideshow when required.
Provide feedback
Use the thumbs-up or thumbs-down icons to rate an Ask Zia response. A thumbs-down rating opens a field where you can explain why the response was not useful. This feedback helps improve the accuracy and relevance of future responses.