Improving conversion rates using RUM insights
Category: Digital experience monitoring
Published on: October 17, 2025
8 minutes
In modern digital ecosystems, user experience (UX) and conversion rates are deeply intertwined. While marketing teams often focus on messaging, design, and CTAs, the underlying performance of an application—the milliseconds between a click and a response—has a measurable impact on user behavior and, consequently, business outcomes.
Real User Monitoring (RUM) bridges this gap by translating performance telemetry from real end-user interactions into actionable business intelligence. It moves organizations beyond synthetic benchmarks and lab-based tests into the reality of how users experience the product—on real devices, across global networks, and under actual load.
This article explores how RUM insights can be leveraged not merely for diagnosing performance issues, but for systematically improving digital conversion rates across web and mobile environments.
The technical basis: What RUM measures
Real User Monitoring collects telemetry directly from client-side sessions—typically through JavaScript agents for web apps or SDKs for mobile apps. Unlike synthetic monitoring, which executes pre-scripted tests from controlled environments, RUM operates passively and continuously, observing actual traffic from real users.
Key performance metrics include:
- Page load metrics: Time to First Byte (TTFB), First Contentful Paint (FCP), Largest Contentful Paint (LCP), DOMContentLoaded, and Fully Loaded Time.
- Interactivity metrics: First Input Delay (FID), Interaction to Next Paint (INP), and cumulative UI responsiveness.
- Stability and visual metrics: Cumulative Layout Shift (CLS), visual completeness, and rendering consistency.
- Network-level insights: DNS lookup time, connection latency, and TLS negotiation.
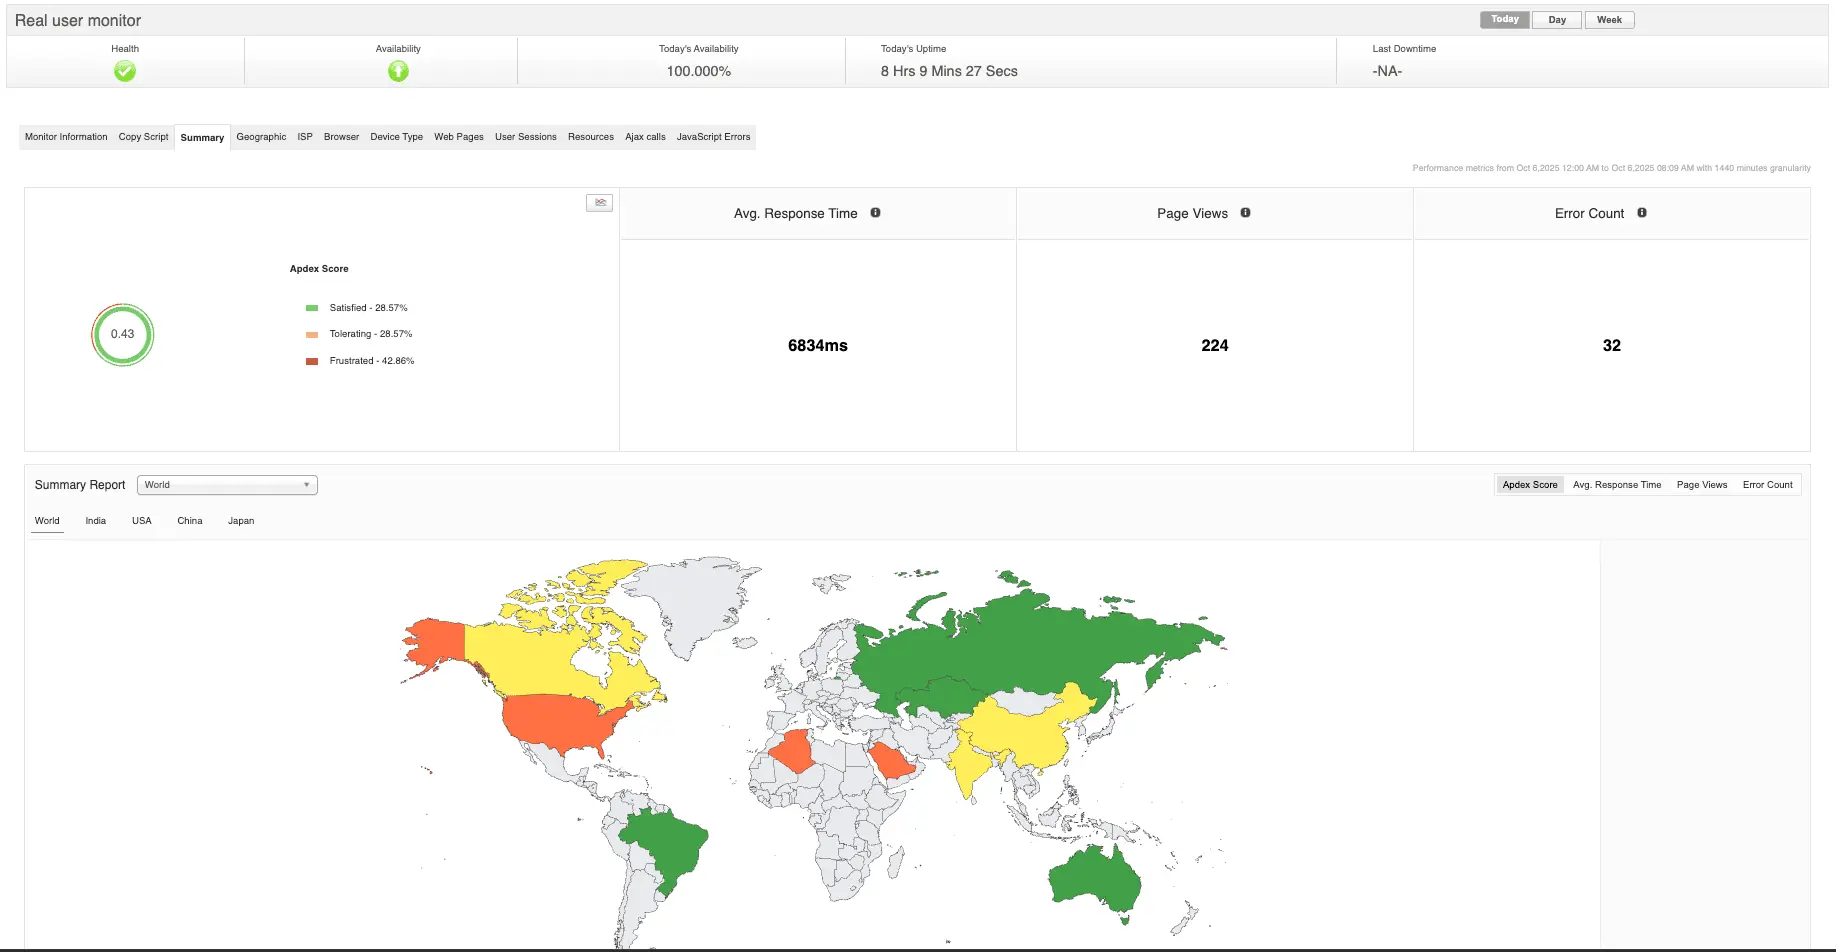
- Geographical and device segmentation: Performance breakdowns by region, device type, browser, and network conditions.
When aggregated and contextualized, these metrics reveal how performance variations correlate with behavioral indicators such as session duration, bounce rate, and conversion probability.
The performance–conversion correlation
Numerous studies, including those from Google, Amazon, and Akamai, have demonstrated that even small degradations in page performance can erode conversion rates significantly. A one-second delay in page load can reduce conversions by up to 7%. However, the true value of RUM lies in quantifying your specific correlation between speed and revenue, rather than relying on industry averages.
For instance, a retail site may find that when LCP exceeds 3 seconds, checkout completion drops by 10%. A SaaS product may discover that slow dashboard loading increases churn risk among new users. These relationships are context-dependent, and RUM provides the empirical evidence needed to identify them.
The analytical model typically follows these steps:
- Data correlation: Overlay RUM metrics with conversion funnel analytics.
- Threshold analysis: Identify the inflection points where latency starts impacting conversion likelihood.
- Segment comparison: Contrast high-performing cohorts (eg: Users with <2s load times) against lower-performing ones to quantify the delta in conversion.
- Revenue attribution: Translate performance improvements into projected business outcomes (eg: “Reducing median LCP by 500ms may yield a 4% revenue lift”).
Turning RUM data into optimization strategy
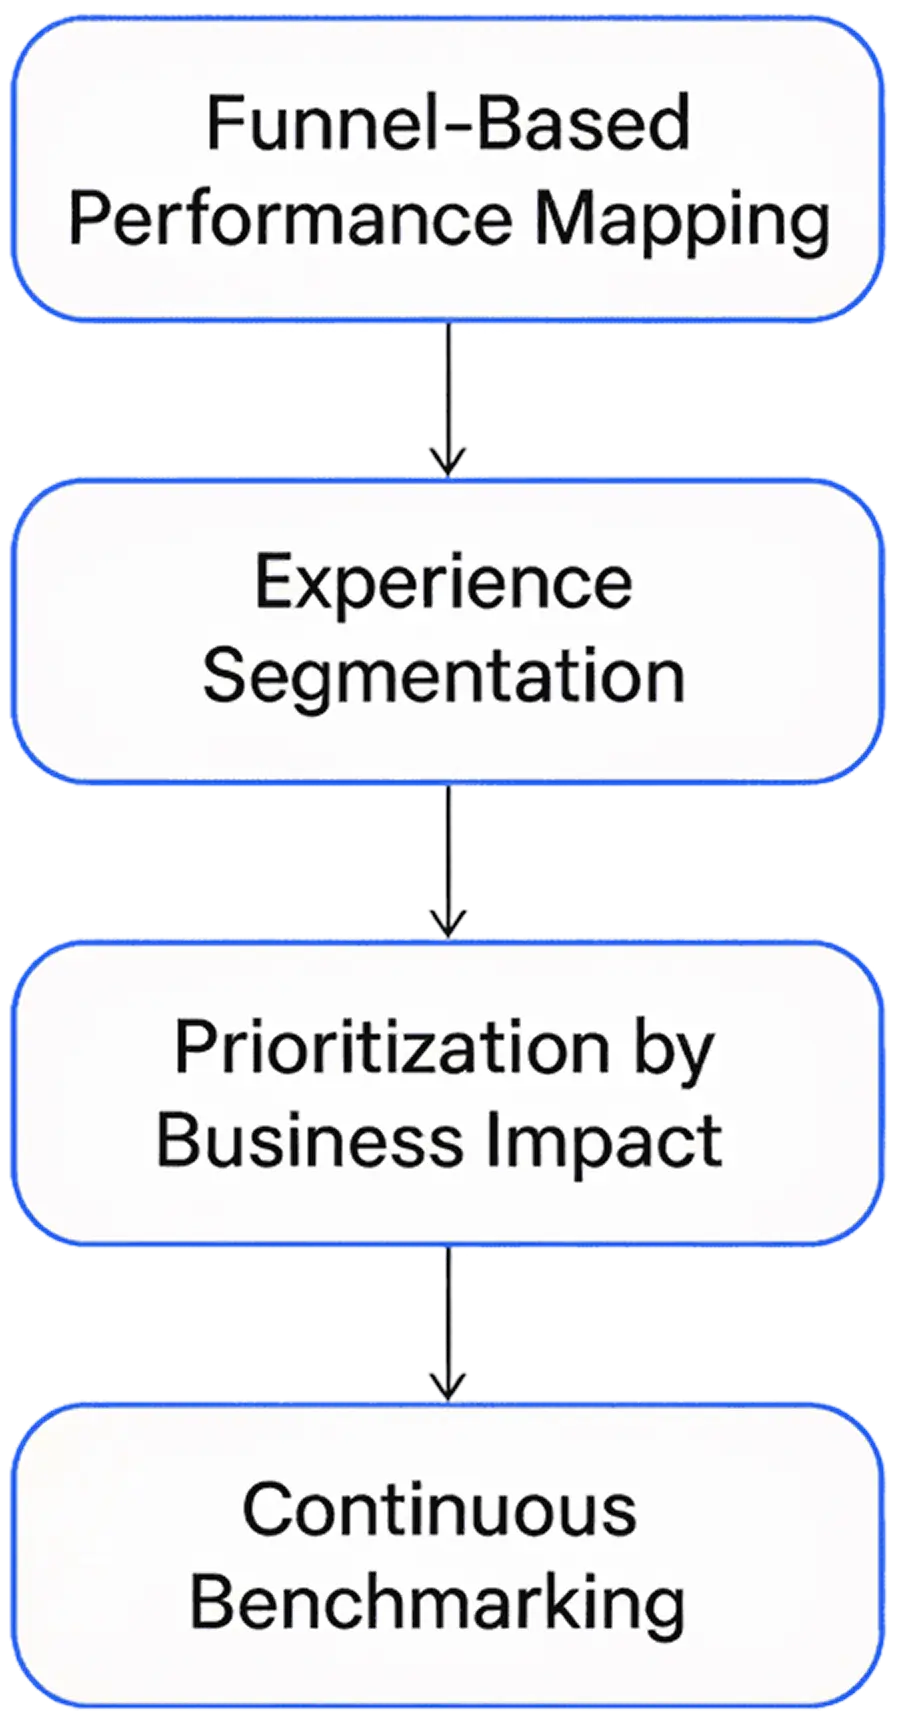
Raw telemetry is not inherently valuable; interpretation and prioritization make it actionable. Mature organizations operationalize RUM insights through structured frameworks.

1. Funnel-based performance mapping
Link performance metrics directly to critical conversion steps—homepage visit, product view, cart addition, checkout, payment, or signup. By mapping RUM data to funnel progression, teams can identify where slowdowns coincide with user drop-offs.
2. Experience segmentation
Performance impact is rarely uniform. Segmenting users by geography, device type, or network speed often reveals hidden friction. For example, a site may perform well in the U.S. but suffer significant latency in Southeast Asia due to suboptimal CDN routing or missing edge caching.
3. Prioritization by business impact
Rather than optimizing for global averages, RUM allows data-driven prioritization—focusing on pages or transactions that generate the most revenue or engagement. If a slow checkout page accounts for 30% of total revenue, it takes precedence over optimizing static content pages.
4. Continuous benchmarking
RUM supports longitudinal analysis. By comparing performance trends across releases, teams can validate whether optimizations truly enhance user outcomes or merely shift bottlenecks elsewhere.
Common insights that drive conversion gains
When properly instrumented, RUM surfaces patterns that often explain conversion fluctuations:
- Render-blocking assets: CSS or third-party scripts delaying above-the-fold content.
- JavaScript execution bottlenecks: Large bundles or main-thread blocking operations affecting FID and INP.
- CDN inefficiencies: Poor cache hit ratios or missing edge nodes causing latency variance by region.
- Image and media optimization: Oversized assets impacting LCP.
- Third-party dependencies: Ad trackers, analytics tags, or widgets slowing interactive readiness.
- Session replays and UX diagnostics: Combining RUM with session replay tools pinpoints where slowdowns translate into abandonment.
Each optimization opportunity uncovered by RUM can be tied to measurable business outcomes, making it easier to justify engineering investments in performance.
Integrating RUM into the observability stack
RUM becomes exponentially more valuable when integrated into a broader observability framework that includes:
- Synthetic monitoring: Complements RUM by detecting regressions before users do.
- Application performance monitoring (APM) Correlates client-side delays with backend transactions and database latency.
- Infrastructure metrics: Provides context on whether user-side slowness originates from server resource contention or external dependencies.
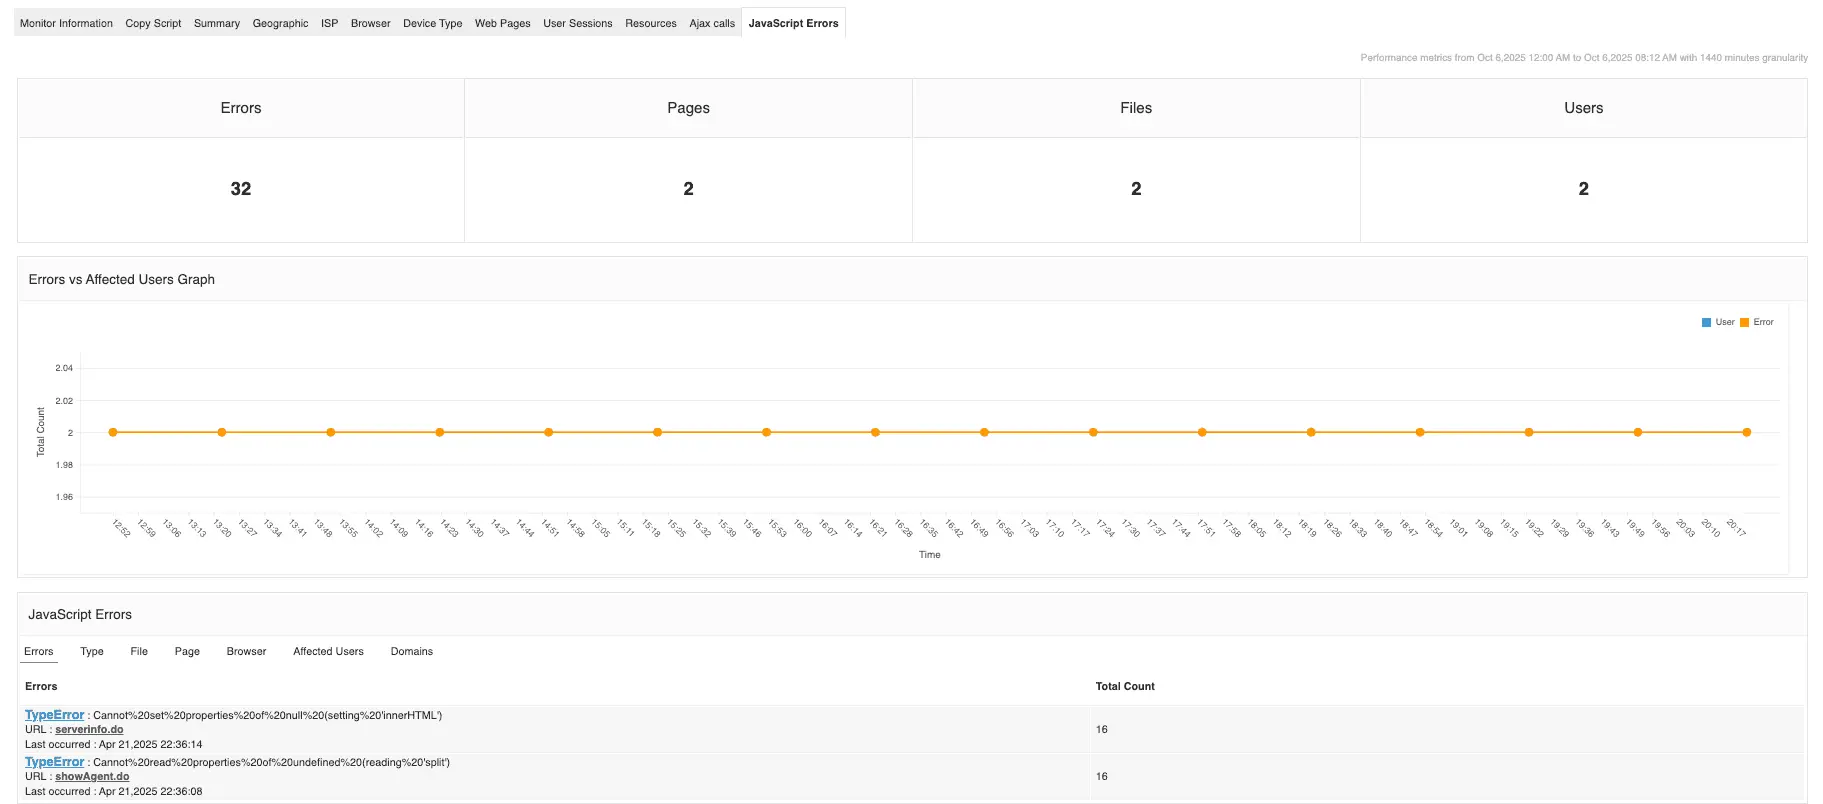
- Error and log analytics: Links front-end issues with specific backend logs or exceptions.
This unified visibility enables cross-layer diagnosis—connecting a spike in client-side FCP to an overloaded EC2 instance, a database connection pool issue, or a misconfigured CDN policy.
Operationalizing RUM insights
Once RUM telemetry is centralized, performance teams typically establish automated workflows:
- Alerting: Trigger alerts when critical metrics like LCP or FID exceed thresholds for high-value pages.
- SLOs and SLIs: Define performance-based Service Level Objectives (SLOs) tied directly to conversion-critical flows.
- Regression detection: Use RUM baselines as quality gates in CI/CD pipelines to prevent performance drift.
- Feedback loop: Feed insights into sprint retrospectives to ensure performance remains a standing engineering priority.
The end goal is a closed-loop system where RUM insights continuously inform both engineering and business decisions.
From metrics to measurable impact with Applications Manager
Improving conversion rates goes far beyond refining design or tweaking CTAs—it begins with understanding how performance directly shapes user behavior. Real user monitoring (RUM) delivers this understanding by revealing how every second of latency or rendering delay influences engagement and decision-making. When organizations integrate RUM into their broader observability strategy, they move from guesswork to evidence-based optimization, connecting performance metrics to tangible business outcomes.
This is where platforms like Applications Manager bridge the gap between technical visibility and strategic insight. By unifying RUM data with synthetic, APM, and infrastructure metrics, Applications Manager gives teams a complete performance picture—from frontend experiences to backend dependencies—helping them pinpoint what’s truly slowing users down. With this clarity, teams can prioritize the optimizations that matter most to business growth, reduce time to resolution, and transform performance efficiency into measurable conversion gains. Every millisecond saved with Applications Manager isn’t just faster—it’s smarter, turning technical excellence into real business impact.


Want to see it in action? You can schedule a personalized demo or download a 30-day free trial and experience what unified monitoring feels like.

