CLI Tool
The CLI (Command Line Interface) Tool allows users to execute performance data collection commands on servers that support SSH/Telnet directly from the Applications Manager web console. This tool helps verify the output of specific metrics collected from the server and can assist in troubleshooting monitoring issues.
Note: This tool is supported in Applications Manager version v176200 and above.
This tool can be used to:
- Run metric-related commands on monitored servers.
- View output results in real-time.
- Export results for analysis or support purposes.
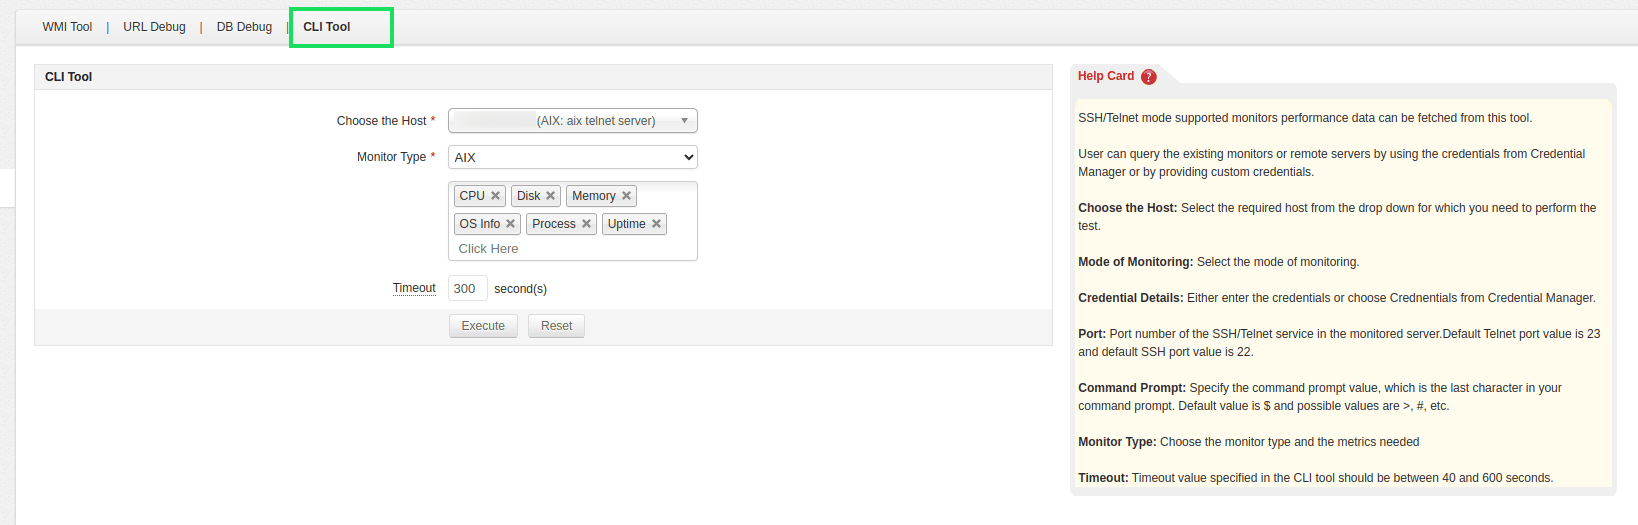
Steps to Adding a New Host
If you wish to run commands on a server that is not already added as a monitor, you need to enter the following information:
- Go to Settings → Self Help Tools → CLI Tool in the Applications Manager web console.
- Select the option to add a new server.
- Enter the host name or IP address of the server.
- Select the mode of monitoring as either SSH or Telnet.
- Specify the credentials manually or choose from the list of existing credential profiles.
- Enable the public key authentication checkbox if you are using key-based authentication.
- Provide the username used to access the server.
- Depending on the authentication method selected, enter the password or upload the private key and passphrase.
- Specify the character used as the command prompt on the server (Default: $).
- Enter the port number for the SSH or Telnet service (Default: SSH port - 22|Telnet port - 23).
- Select the appropriate monitor type for the server (for example, Linux Server or Windows Server).
- Based on the selected monitor type, a list of supported metrics will be displayed. Choose the metrics you want to query.
- Set a timeout value for the command execution. This value should be between 40 and 600 seconds.
- After entering all the required information, click the Execute button.
On completing the above steps, the command will be executed on the selected host, and the output will be displayed in a table along with the execution time in milliseconds. You can choose to export the output by copying it to the clipboard, downloading it as a PDF, or sending it directly to the Applications Manager support team.
- This tool is useful for troubleshooting issues related to performance metric collection.
- Appropriate error messages will be displayed in case of failures (e.g., authentication issues, timeouts, unsupported metrics).