ISP Latency Monitor
The ISP Latency Monitor tracks the quality of the network path between an end-user location (an End User Monitoring (EUM) Agent) and any target host or service, whether on the public Internet or on your internal network. It runs a traceroute and ping from each EUM Agent to a chosen target and converts the raw output into a clean set of metrics along with a multi-location network path chart, which helps identify where along the path performance issues occur.
- ISP Latency Monitor is supported from Applications Manager v182000 and EUM Agent v22.21 onwards.
- Refer to the prerequisites before creating this monitor.
- When the EUM Agent is started as root user, Real Browser Monitor (RBM) using Firefox for data collection will fail - Firefox does not launch under the root user.
Creating a new ISP Latency monitor
Prerequisites for monitoring ISP Latency monitor metrics:Click here
Using the REST API to add a new ISP Latency monitor:Click here
To create an ISP Latency monitor, follow the steps given below:
- Click on New Monitor link. Choose ISP Latency Monitor under 'Services' category.
- Specify the Display Name of the monitor.
- Provide the Host Name / IP Address of the target host you want to measure latency against.
- Select the Protocol to be used for the traceroute and ping checks. (TCP, UDP or ICMP).
- If the protocol is TCP or UDP, specify the Port number of the target host.
- If you are adding a new monitor from a Central Server, select a Probe Server.
- Select the Monitor Group with which you want to associate the monitor to, from the combo box (optional). You can choose multiple groups to associate your monitor.
- Associate the monitor instance to the agent.
- Enable Run on Server option to run the monitor in the local instance of Applications Manager.
- Enable Run on Agent option to run the monitor from multiple end-user locations. Select the necessary EUM agents from where you want this monitor to be executed.
- Click Add Monitor(s). This adds the ISP Latency monitor and the monitoring will be started as per the polling interval configured.
- If the UDP protocol is selected on a Windows EUM Agent, the monitor automatically falls back to the ICMP protocol.
- If the target is an IPv6 address and the TCP protocol is selected on a Windows EUM Agent, the monitor automatically falls back to the ICMP protocol.
Monitored Parameters
Go to the Monitors Category View by clicking the Monitors tab. Click on the ISP Latency Monitor available in the Services section. Displayed is the bulk configuration view of the ISP Latency Monitor, distributed into three tabs:
- Availability tab gives the Availability history for the past 24 hours or 30 days.
- Performance tab gives the Health Status and events for the past 24 hours or 30 days.
- List view enables you to perform bulk admin configurations.
Following are the list of metrics shown in the ISP Latency Monitor in their corresponding tabs:
Overview
The Overview displays the key latency, packet loss, jitter, hop count and MTU metrics for the selected ISP Latency monitor.
| Parameter | Description |
|---|---|
| Latencies of all EUM Agents | |
| ISP Latency Monitor | Name of the ISP Latency monitor deployed in the EUM agent. |
| Latency | Round-trip time taken to reach the target host (in milliseconds). |
| Hop Count | Number of routers (hops) traversed on the path to the target host. |
| Packet Loss | Percentage of packets that failed to reach the destination, computed from a parallel ping check. |
| Jitter | Variance in round-trip time between successive packets, computed from a parallel ping check (in milliseconds). |
| Maximum Transmission Unit | Maximum Transmission Unit (MTU) reported in the traceroute output when available (in bytes). |
Network Path Analysis
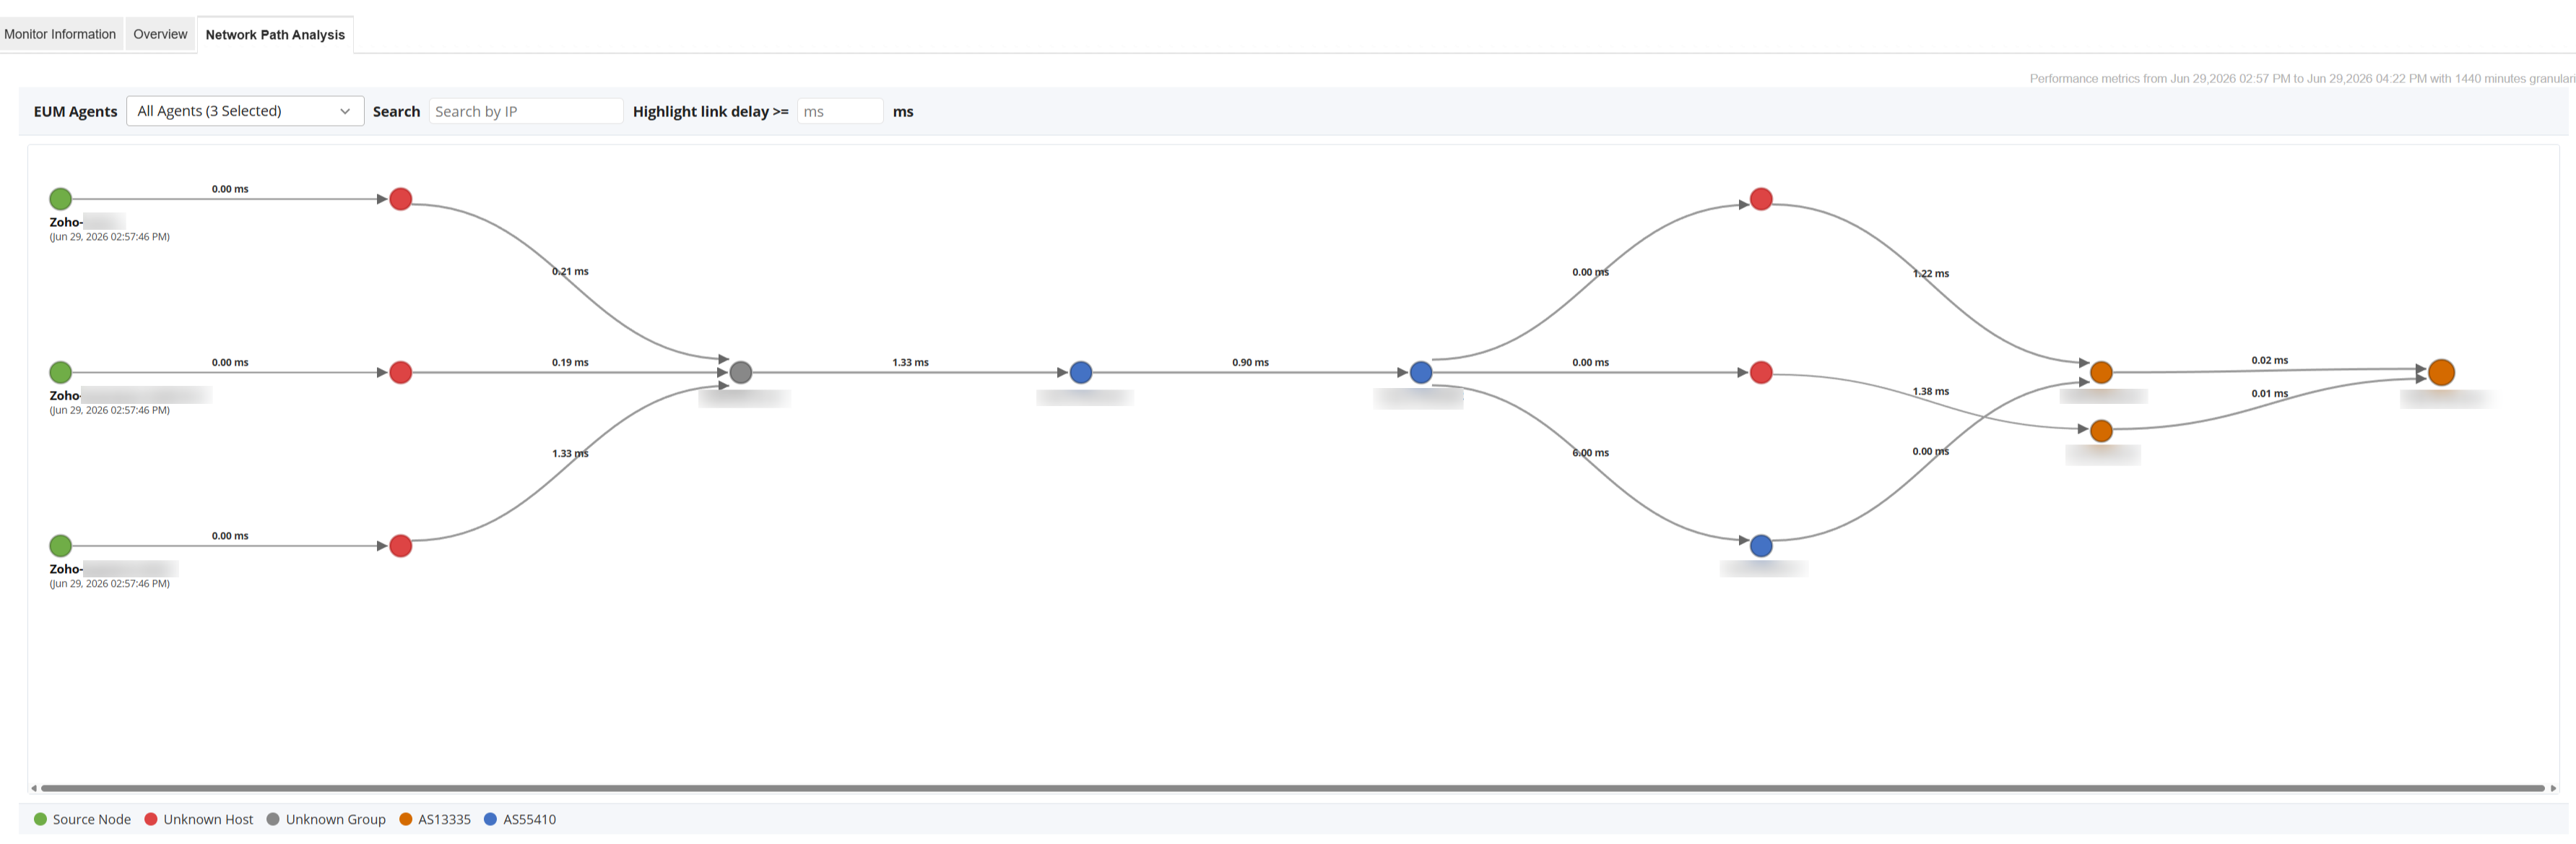
The Network Path Analysis tab displays the multi-location network path chart built from the traceroute snapshot, which can be used to identify where on the path performance issues occur such as slow down. When the monitor runs on multiple EUM Agents, the parent monitor's Network Path Analysis tab shows the consolidated network path from all the agents in a single chart, enabling multi-path analysis.
Use the Search option to locate a specific host in the chart by its IP address, and the Highlight link delay option to highlight links whose latency is above a specified threshold. Combined with the EUM Agents filter, which lets you narrow the chart down to specific agents, these options help you quickly pinpoint the network segment causing performance issues.