TongWeb Monitoring
TongWeb is a robust Java EE application server widely adopted for hosting web applications. ManageEngine Applications Manager’s TongWeb monitoring enables you to observe key JVM, transaction, and resource metrics in real time — helping you detect performance bottlenecks, resource constraints, and configuration issues before they impact users.
Why monitor TongWeb?
- Gain end-to-end visibility into JVM internals, class loading, and garbage collection behavior
- Track response times, throughput and error rates at the request-processor level
- Monitor thread pools, stuck threads, and utilization
- Observe application-level web metrics (sessions, deployments, rejections)
- Correlate TongWeb metrics with underlying infrastructure and other application stacks
Gain end-to-end visibility into JVM internals, class loading, and garbage collection behavior
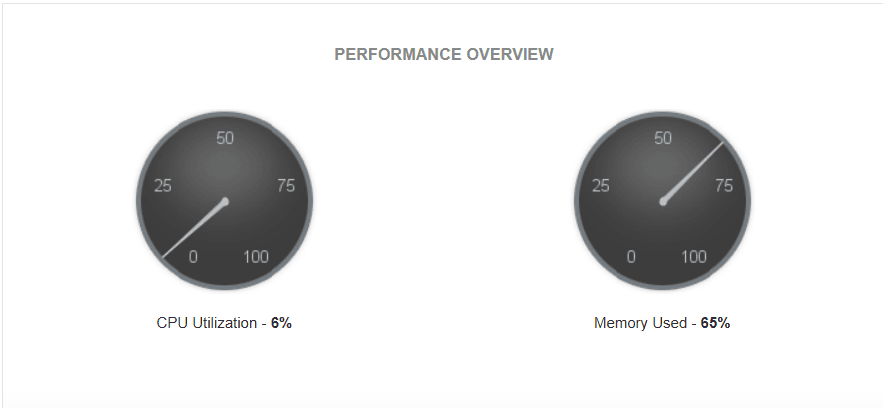
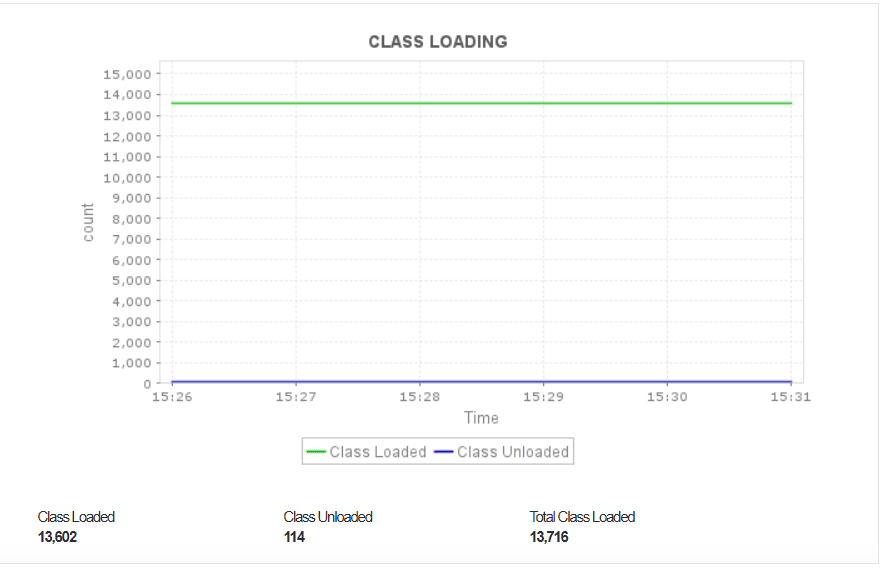
Monitoring the JVM internals of your TongWeb server helps identify issues related to memory consumption, class loading and garbage collection (GC) activity. Keeping an eye on heap and non-heap memory usage helps prevent memory leaks and “OutOfMemoryError” crashes, while observing class loading trends ensures that excessive or repetitive class loading doesn't degrade performance.
GC monitoring provides insights into how efficiently memory is reclaimed—helping you detect long pause times or frequent collections that can slow down application responsiveness.

Track response times, throughput and error rates at request-processor level
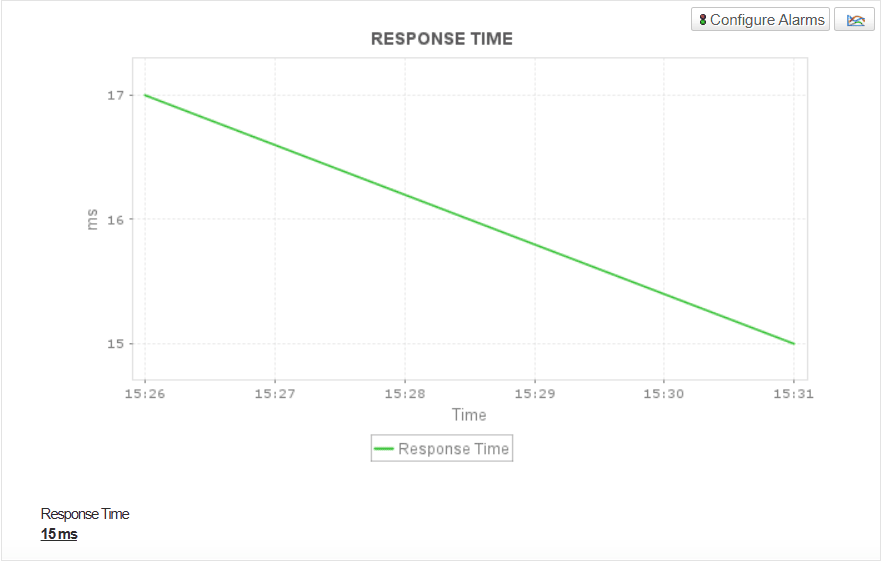
By monitoring key request-processor metrics, you gain an accurate view of how efficiently TongWeb handles user requests. Response time tracking reveals delays or bottlenecks in request handling, while throughput metrics indicate overall load and capacity utilization.

Monitoring error rates enables quick detection of abnormal spikes, failed requests, or misconfigurations that may affect performance.Together, these metrics help maintain consistent service levels and deliver a smooth end-user experience.

Monitor thread pools, stuck threads and utilization
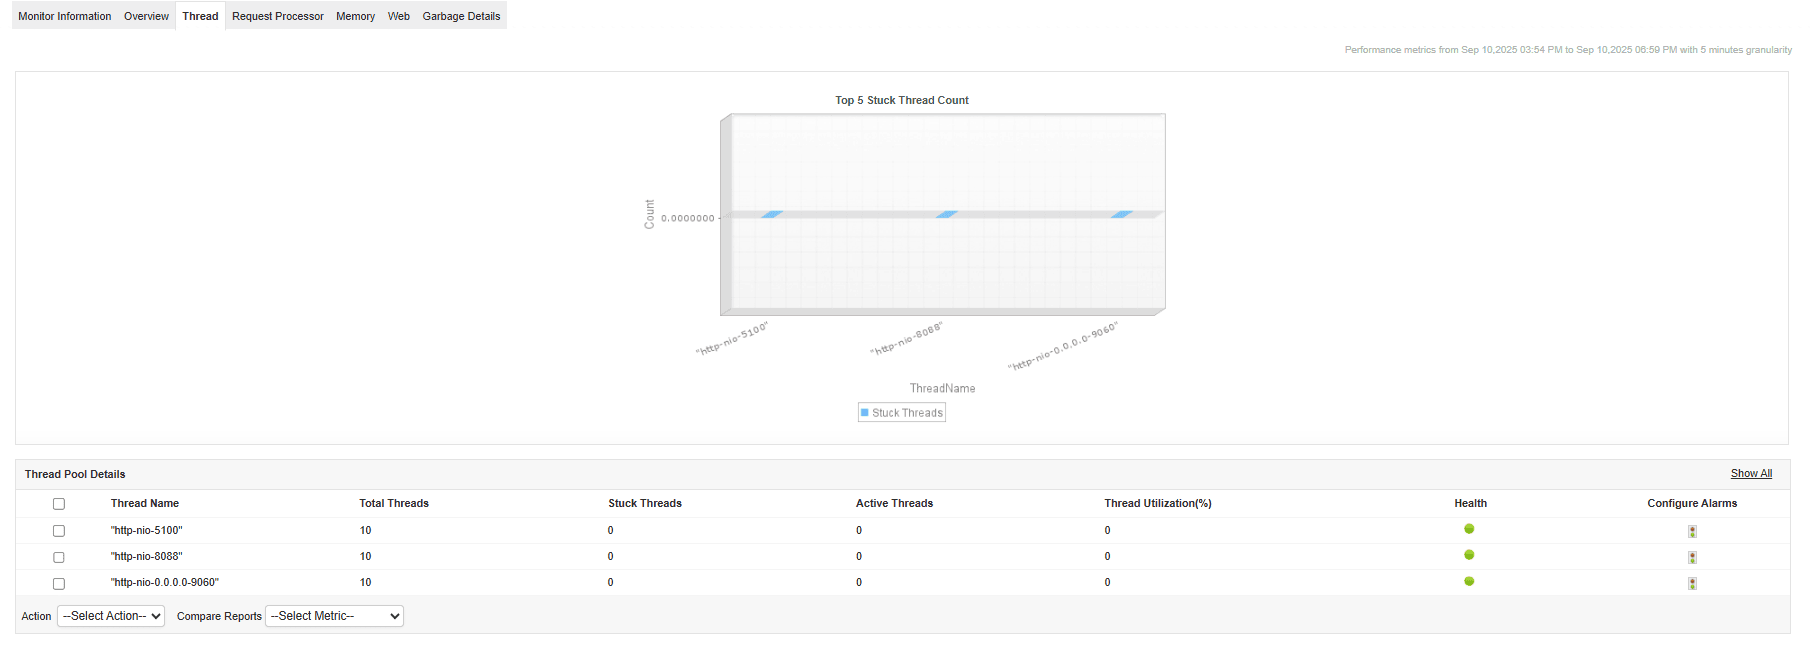
Thread pool monitoring helps you understand how TongWeb manages concurrent requests and background tasks. High thread utilization or a growing count of stuck threads can signal contention issues, unoptimized code, or resource starvation. By keeping track of thread activity, administrators can proactively detect blocked threads or deadlocks and adjust pool sizes or configurations before they impact throughput or cause downtime. This ensures that the server continues to process incoming requests efficiently under varying loads.

Observe application-level web metrics (sessions, deployments, rejections)
Monitoring application-level web metrics provides valuable insights into user activity and application stability. Tracking active sessions and session expirations helps estimate user load and detect anomalies such as unexpected session drops or high rejection counts.

Keeping tabs on deployment status allows administrators to ensure that all web applications are up and responding correctly. These insights support capacity planning and help maintain reliable, uninterrupted user interactions.
Correlate TongWeb metrics with underlying infrastructure and other application stacks
TongWeb rarely runs in isolation—it typically interacts with databases, web services, and network components. By correlating TongWeb performance metrics with data from other monitored layers in Applications Manager, such as database or server health, you can identify the true root cause of performance degradation. This end-to-end correlation helps isolate whether slowness originates in the JVM, the web layer, or an external dependency, leading to faster troubleshooting and improved optimization of your entire application ecosystem.
Stay ahead with complete visibility and control
Ensure your TongWeb applications run at peak performance with ManageEngine Applications Manager. Download the 30-day free trial of Applications Manager to monitor TongWeb server and explore the full range of features today!


