Constructing Questions for Ask Zia
You can ask your question to Ask Zia in plain English. Ask Zia will understand your question's intent and will reply with the most appropriate report that matches your question. However, there can be some communication gaps like how it exists among people.
This section explains how best you can communicate with Ask Zia.
How to Construct Questions?
Ask Zia can understand the intent in your questions. It can resolve ambiguity and generate the best possible insights for your questions. The questions you construct can be one of the following types.
Constructing questions
Ask Zia provides the flexibility of putting forth questions in any format, regardless of the phrasing or the words used.
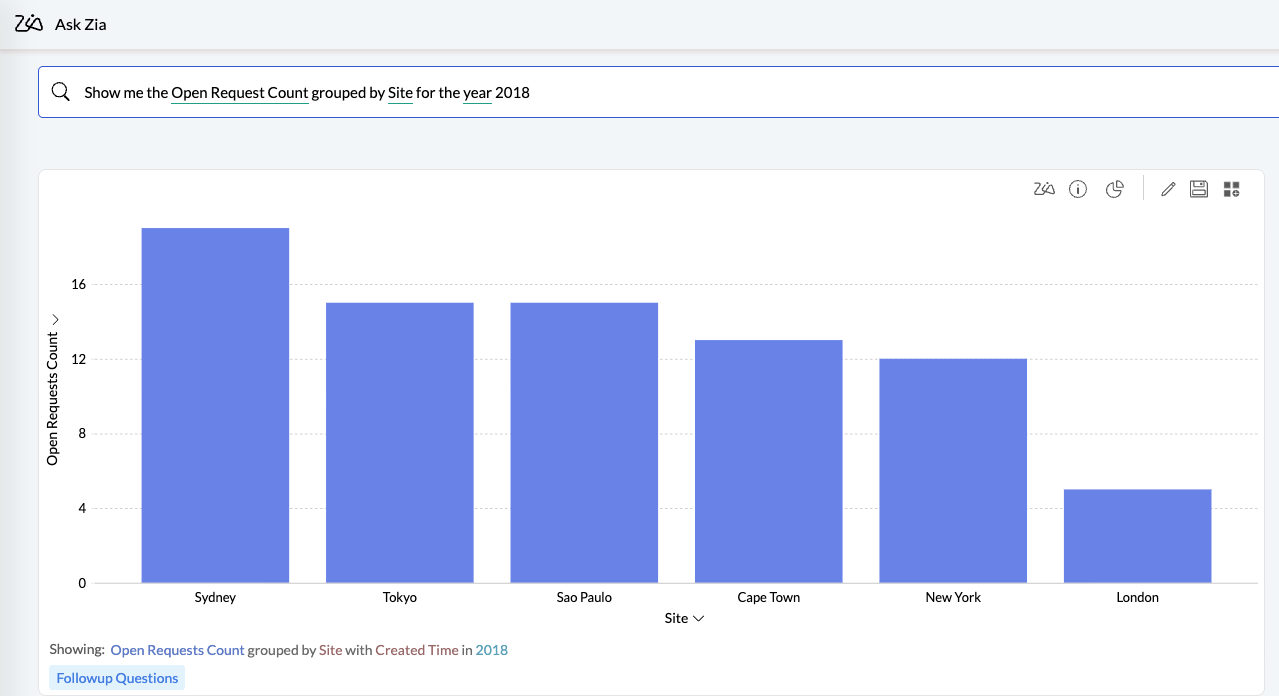
Structured questions
Questions that are fully formed structured sentences can be used with Ask Zia. For example, "Show me the Open Request Count grouped by Site for the year 2018".
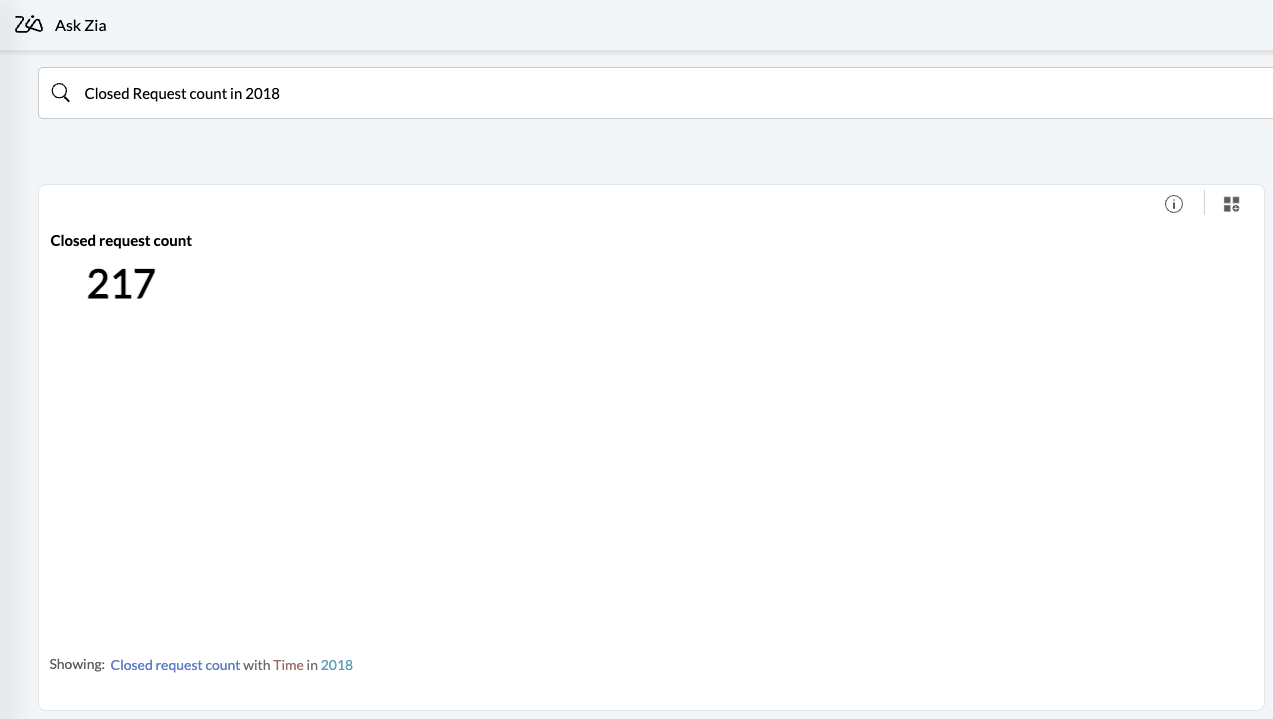
Unstructured questions
Fragmented and incomplete sentences can also be posted as questions to Ask Zia. For example, "Closed Request count in 2018", displays a widget with the total number of requests closed in 2018.
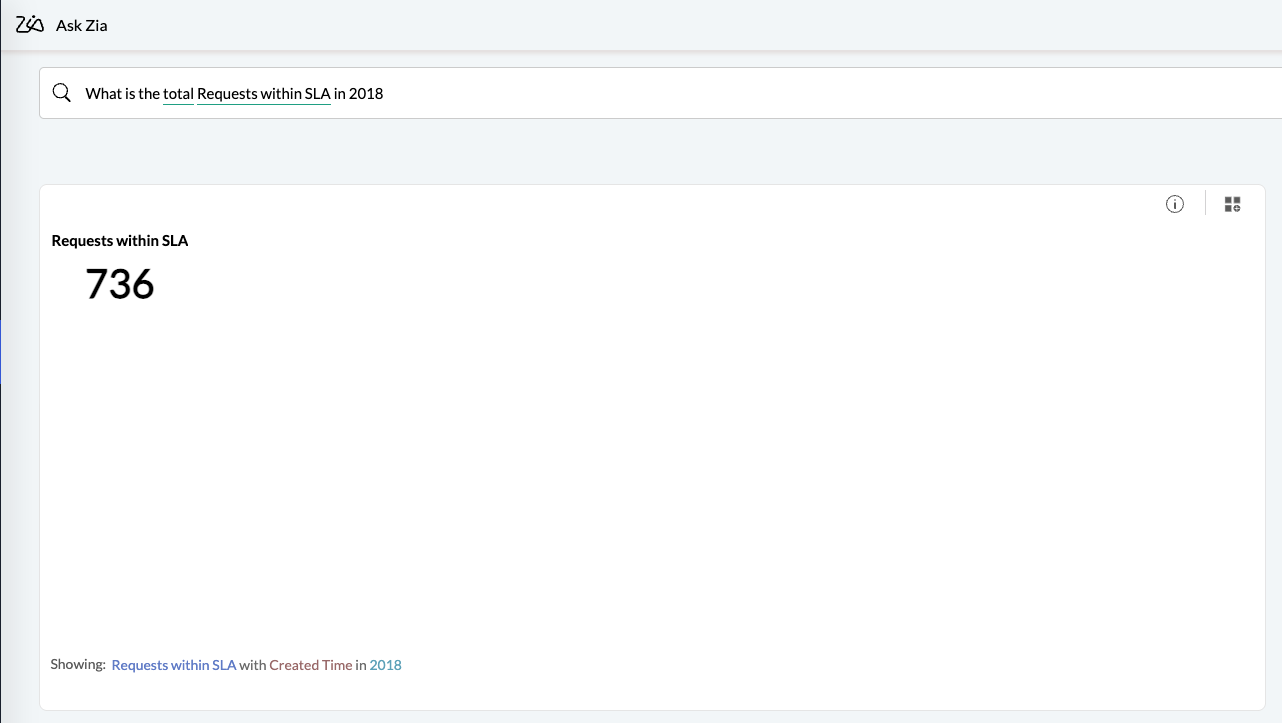
WH questions
WH-questions (that is, questions starting with When, Where, How, What, etc.) are supported in Ask Zia. For example, the query “What is the total number of Requests within SLA in 2018?” displays a widget showing the requests that met SLA in 2018.
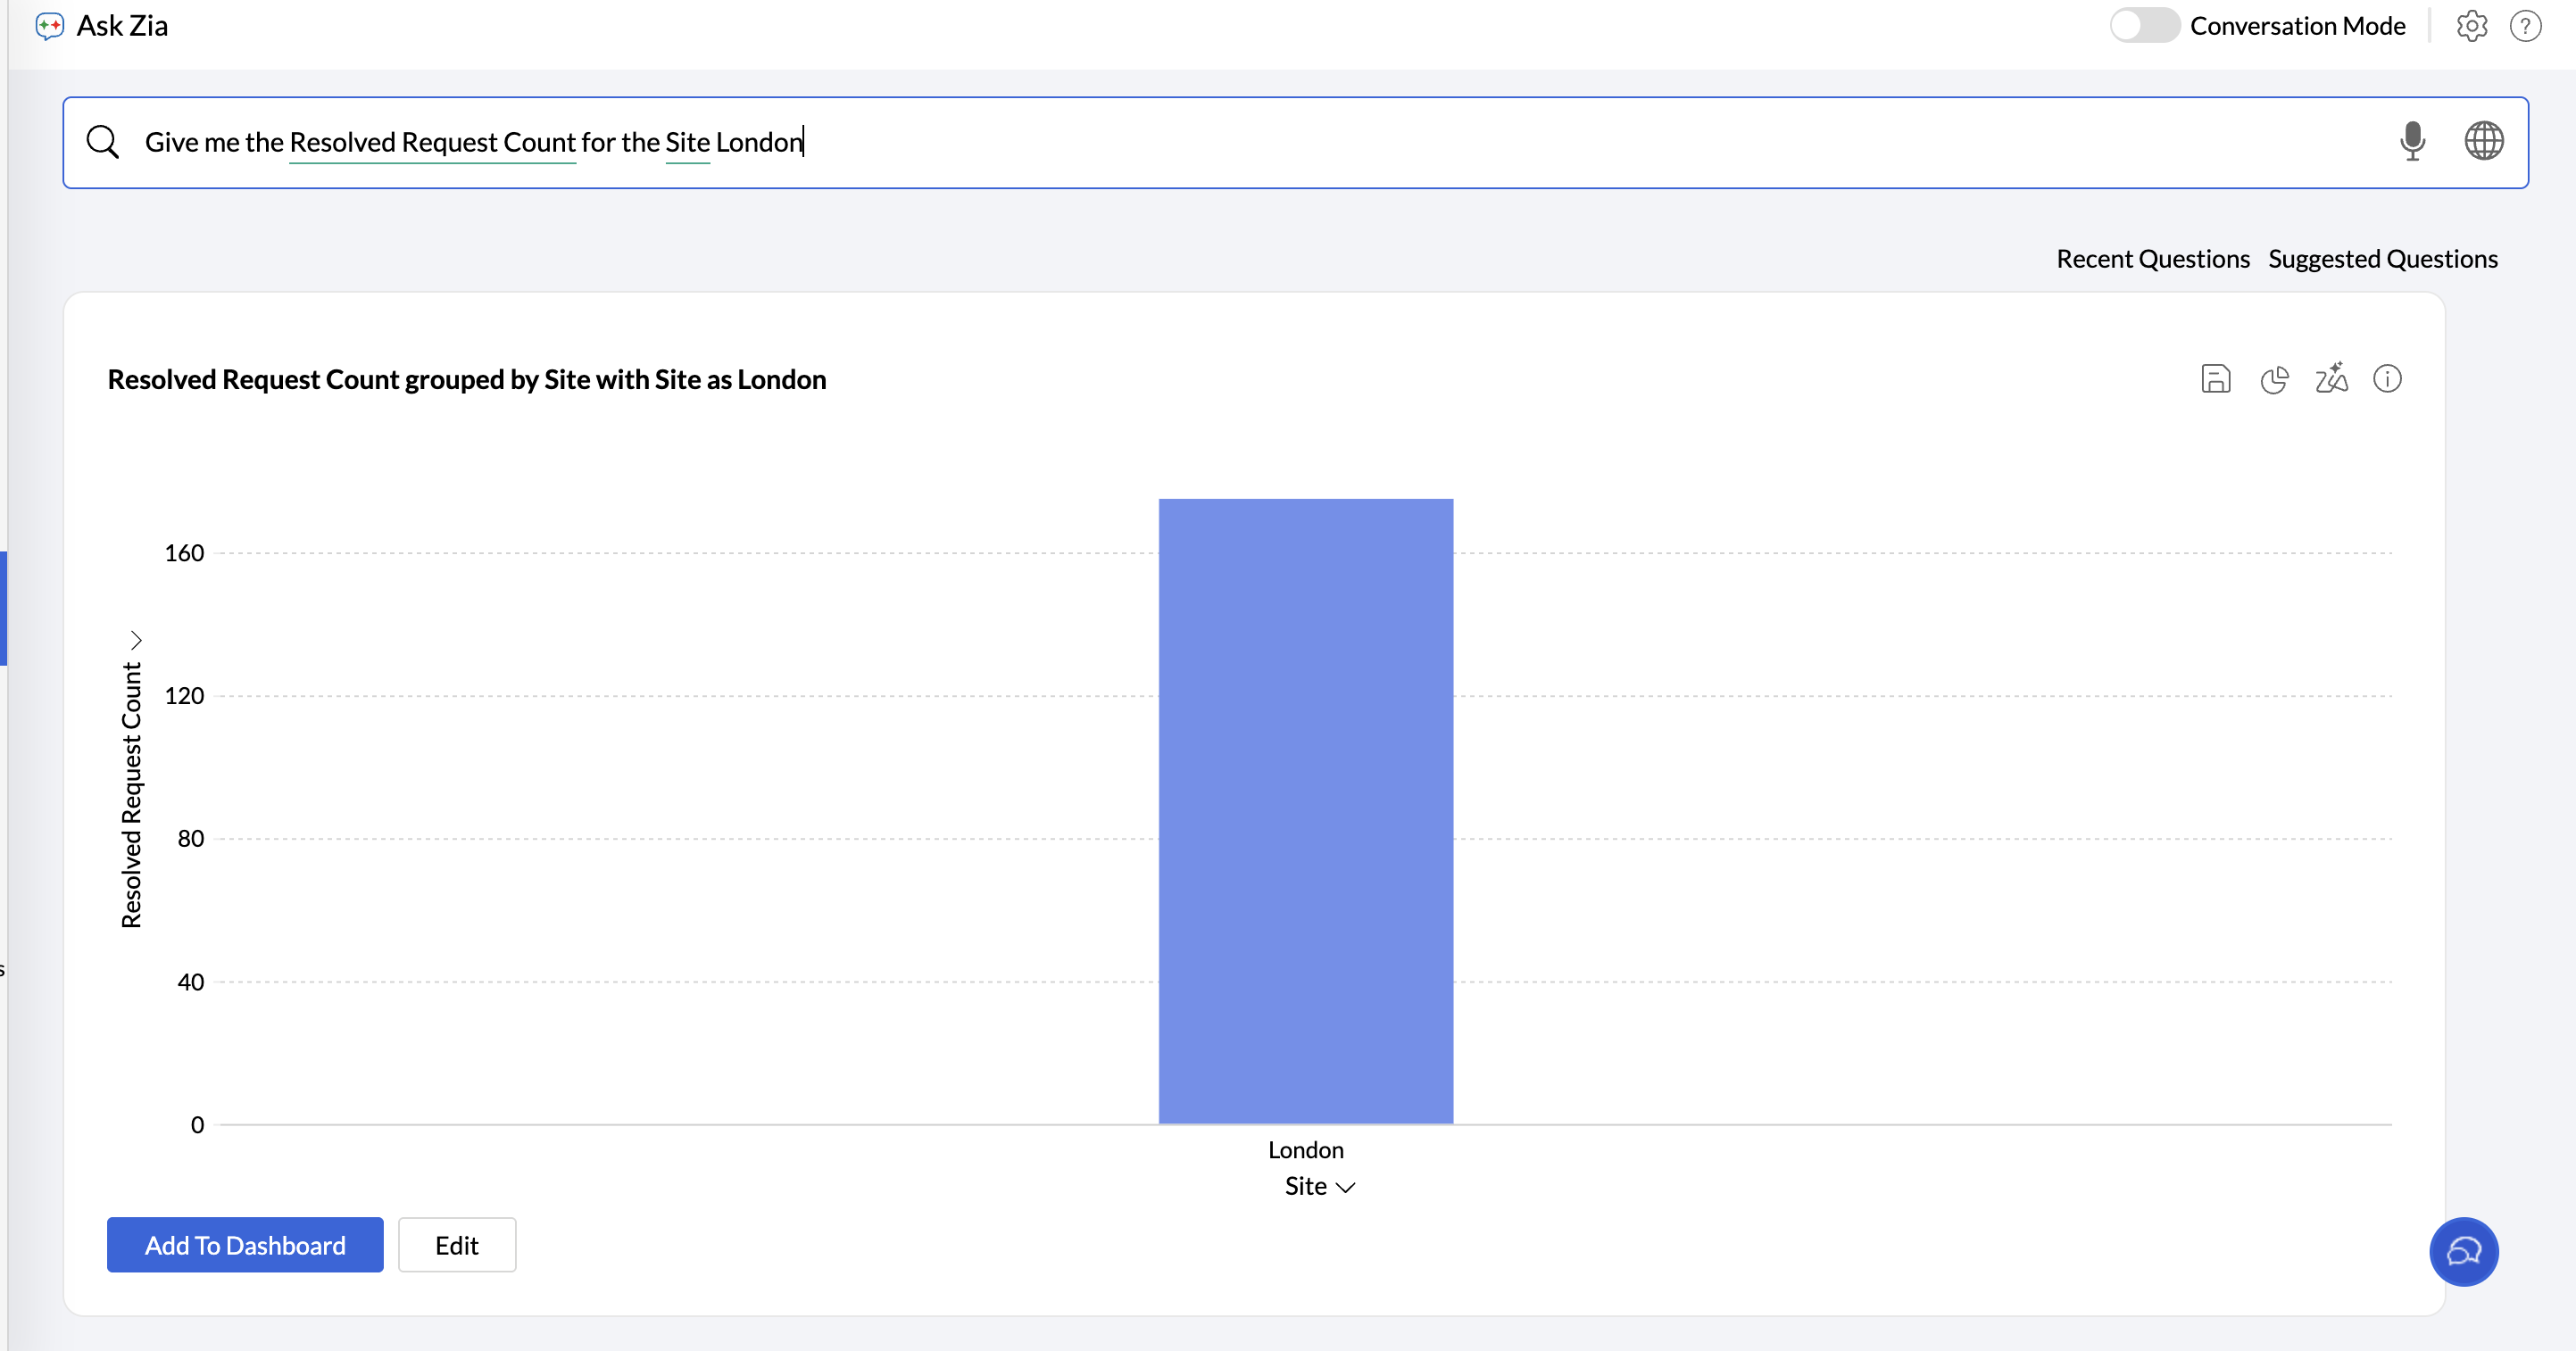
Explicit information
Questions that contain explicit information (i.e. names of columns present your tables) can be used in Ask Zia. The below question will get the total Resolved Requests Count across site.
Implicit information
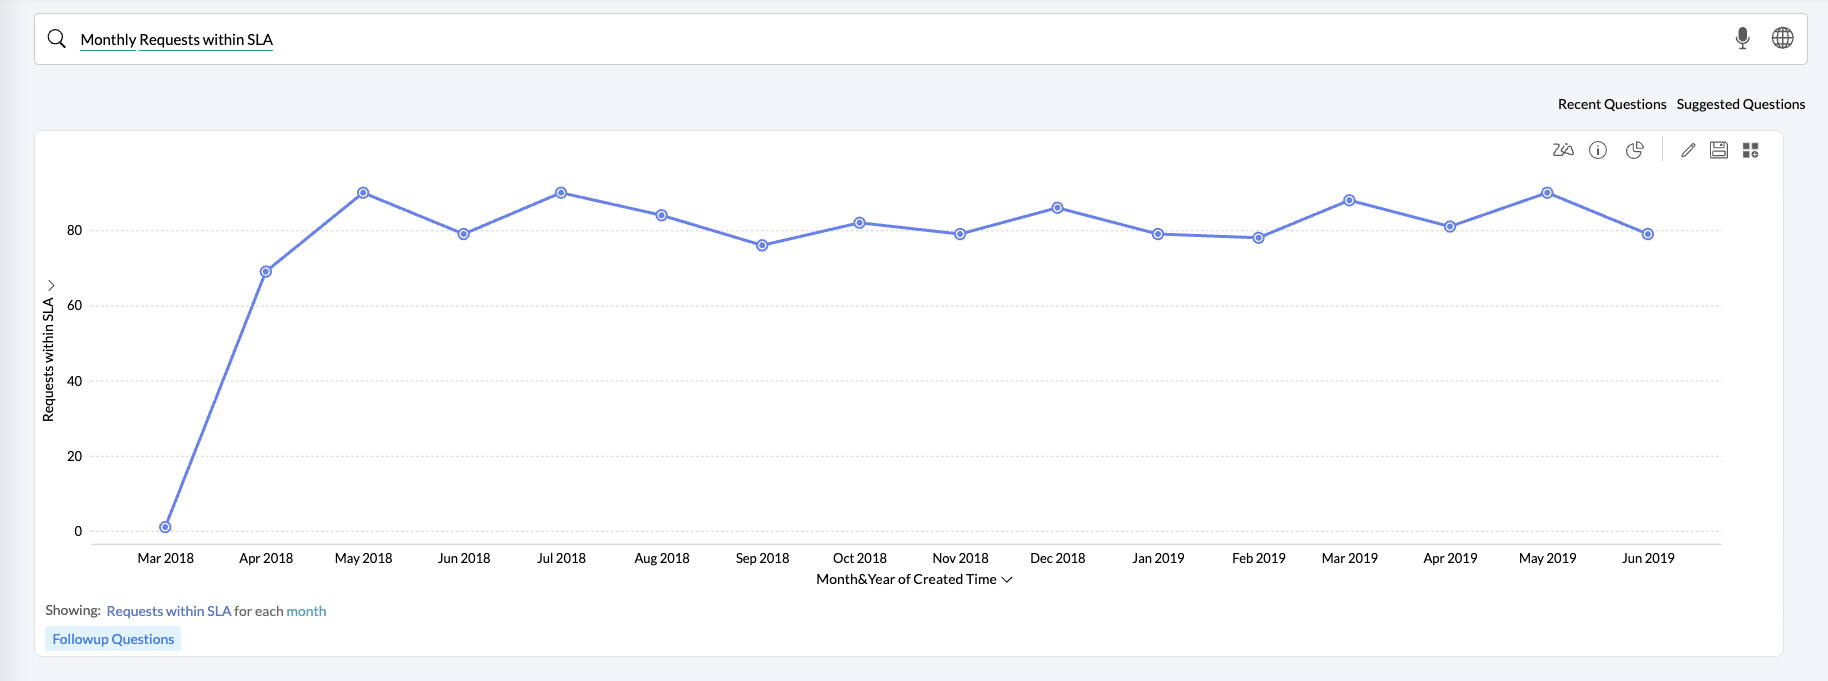
Your question can include implicit information. Ask Zia detects time-based terms such as daily, monthly, quarterly, and yearly, identifies the relevant date column in your dataset, and generates the appropriate visualization. For example, in the following query, Zia recognizes the term monthly and plots Requests within SLA across months.
Column values
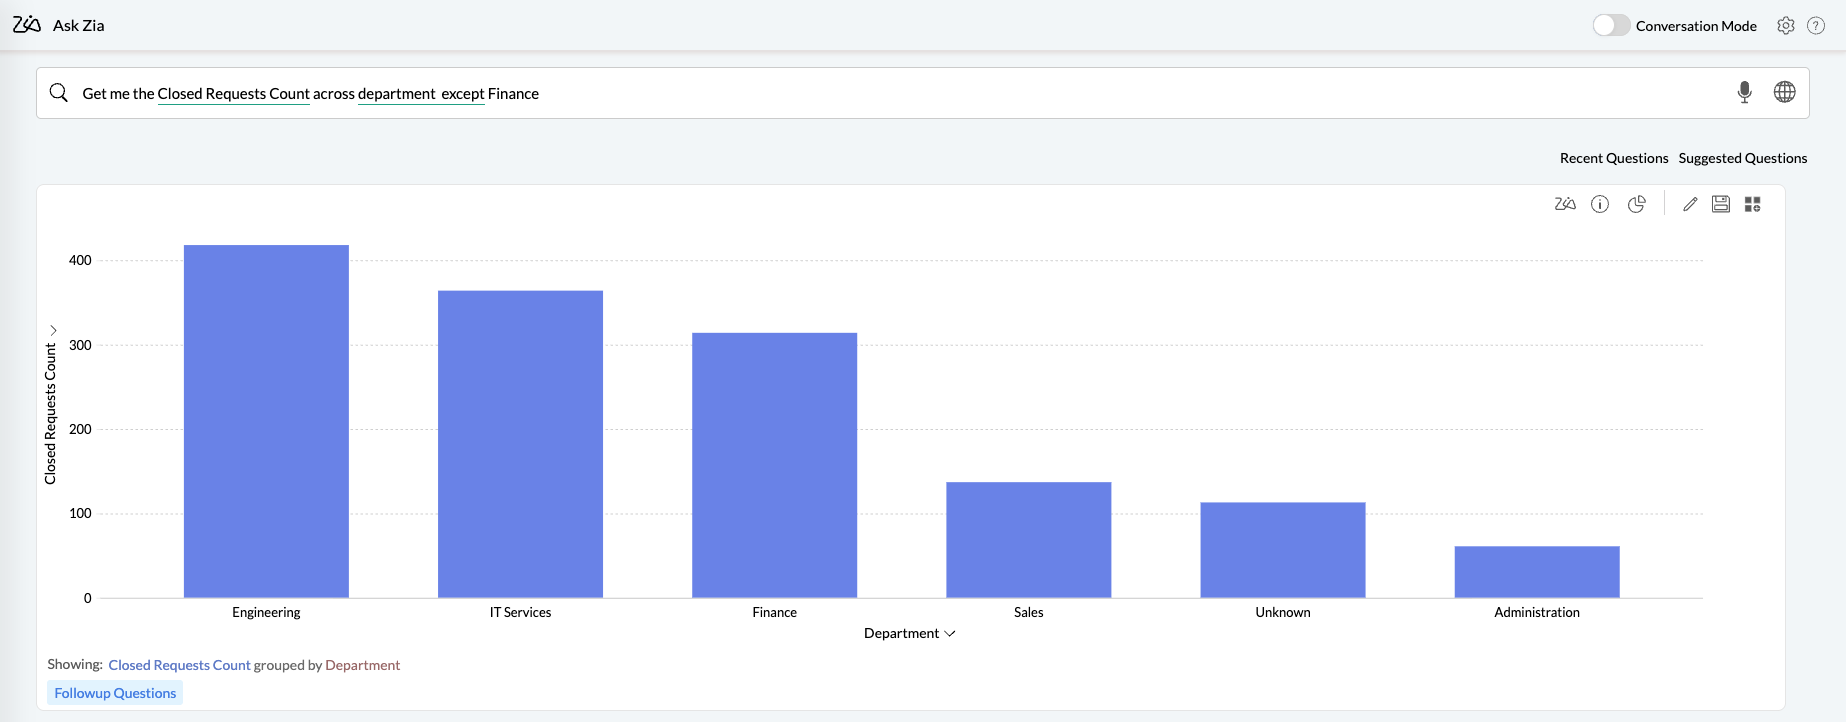
You can phrase questions about the data present in different columns in a table. For example, "Give me the Closed Requests Count except Finance" identifies the word Finance as a value in the column Region, and displays a chart filtering out that value.
Across different tables
Similarly, questions linking data from different tables and application modules can also be used. Ask Zia will interpret the question based on the way the tables are joined, and generate the most accurate report. Click here to know more about Joining Tables.
Formula columns
Questions can also be posted about formula metrics created over data tables. Click here to know more about formulas.
Typographical Error
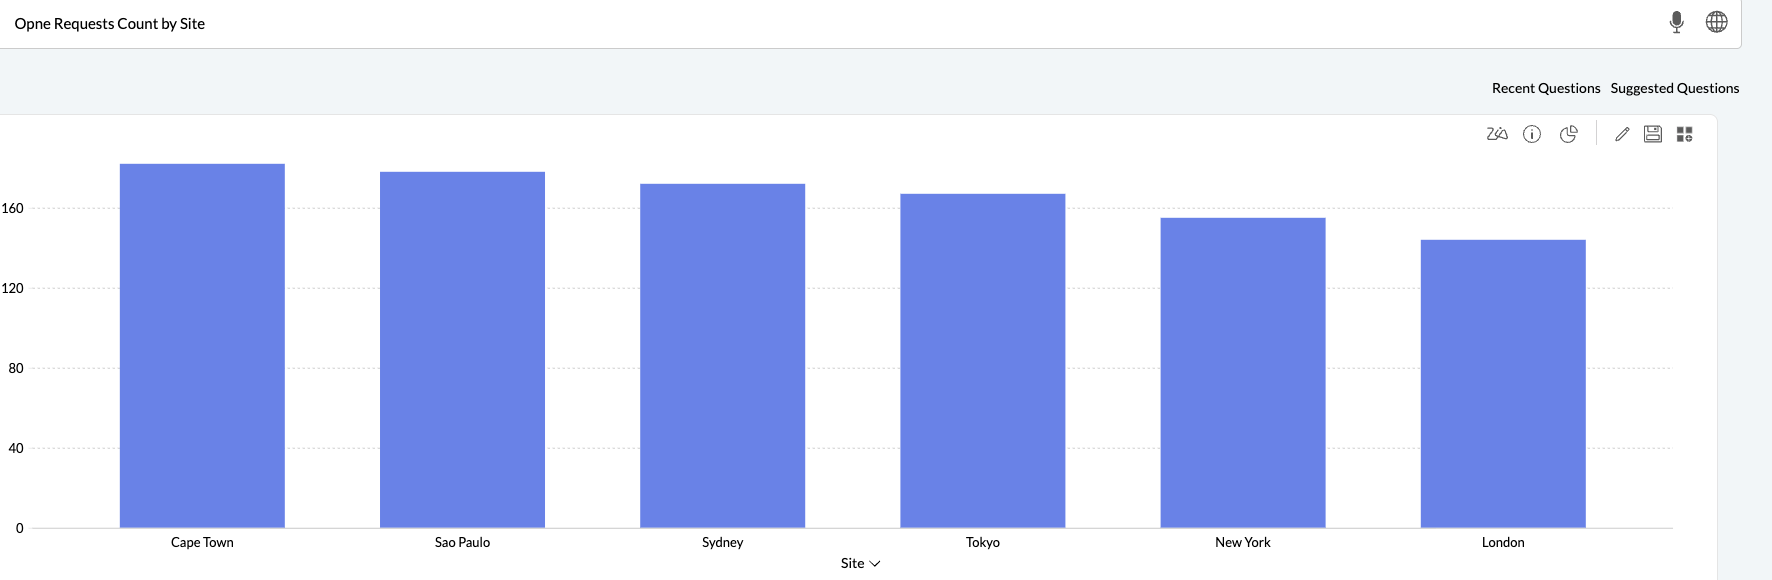
Questions that contain any typographical error can also be interpreted by Ask Zia. In this case, ther term 'Opne' will be matched with Open.
What can be achieved in Ask Zia?
Ask Zia supports creating the following types of queries.
Ask for a Metric
Apply Summary Functions
Predictive Analysis
Statistical Measures
Group the Metric Column
Sort Data
Ask for a Metric
You can ask for a single metric or multiple metrics in a question like sales, my top salesman, what is the most sold product, etc.,
Single Metric
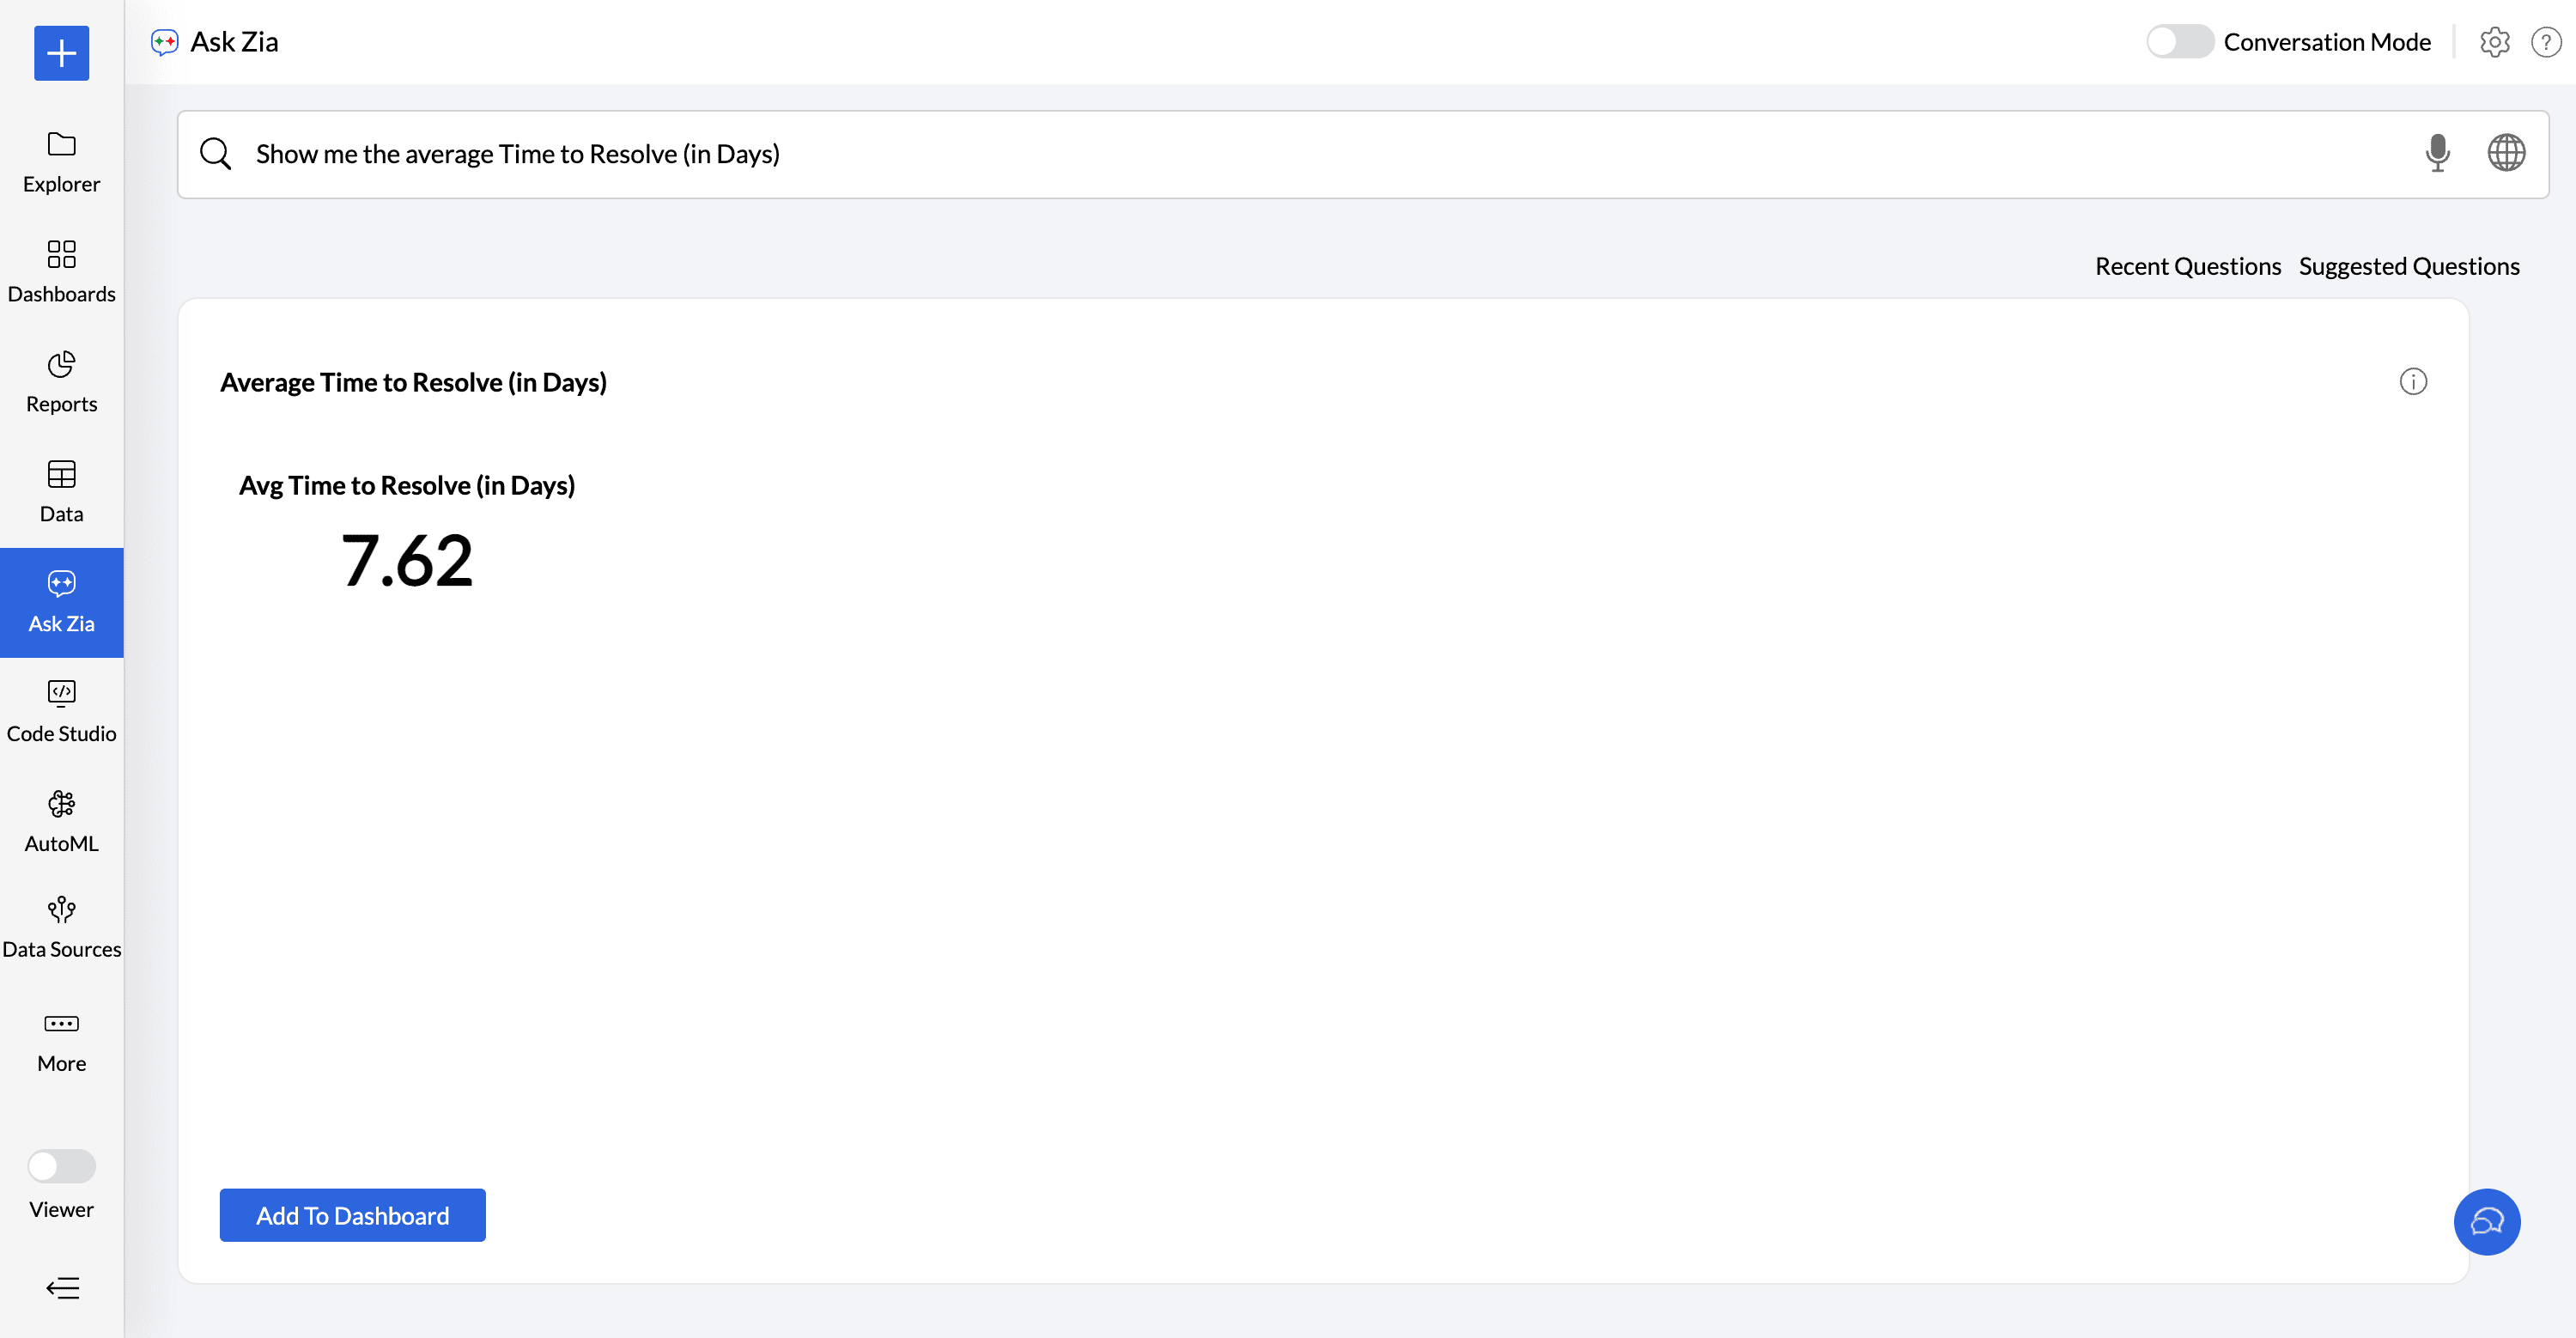
You can ask for a single metric in your question. The following question will get the average time to resolve in days as a Numeric KPI widget.
Show me the average Time to Resolve( in days)
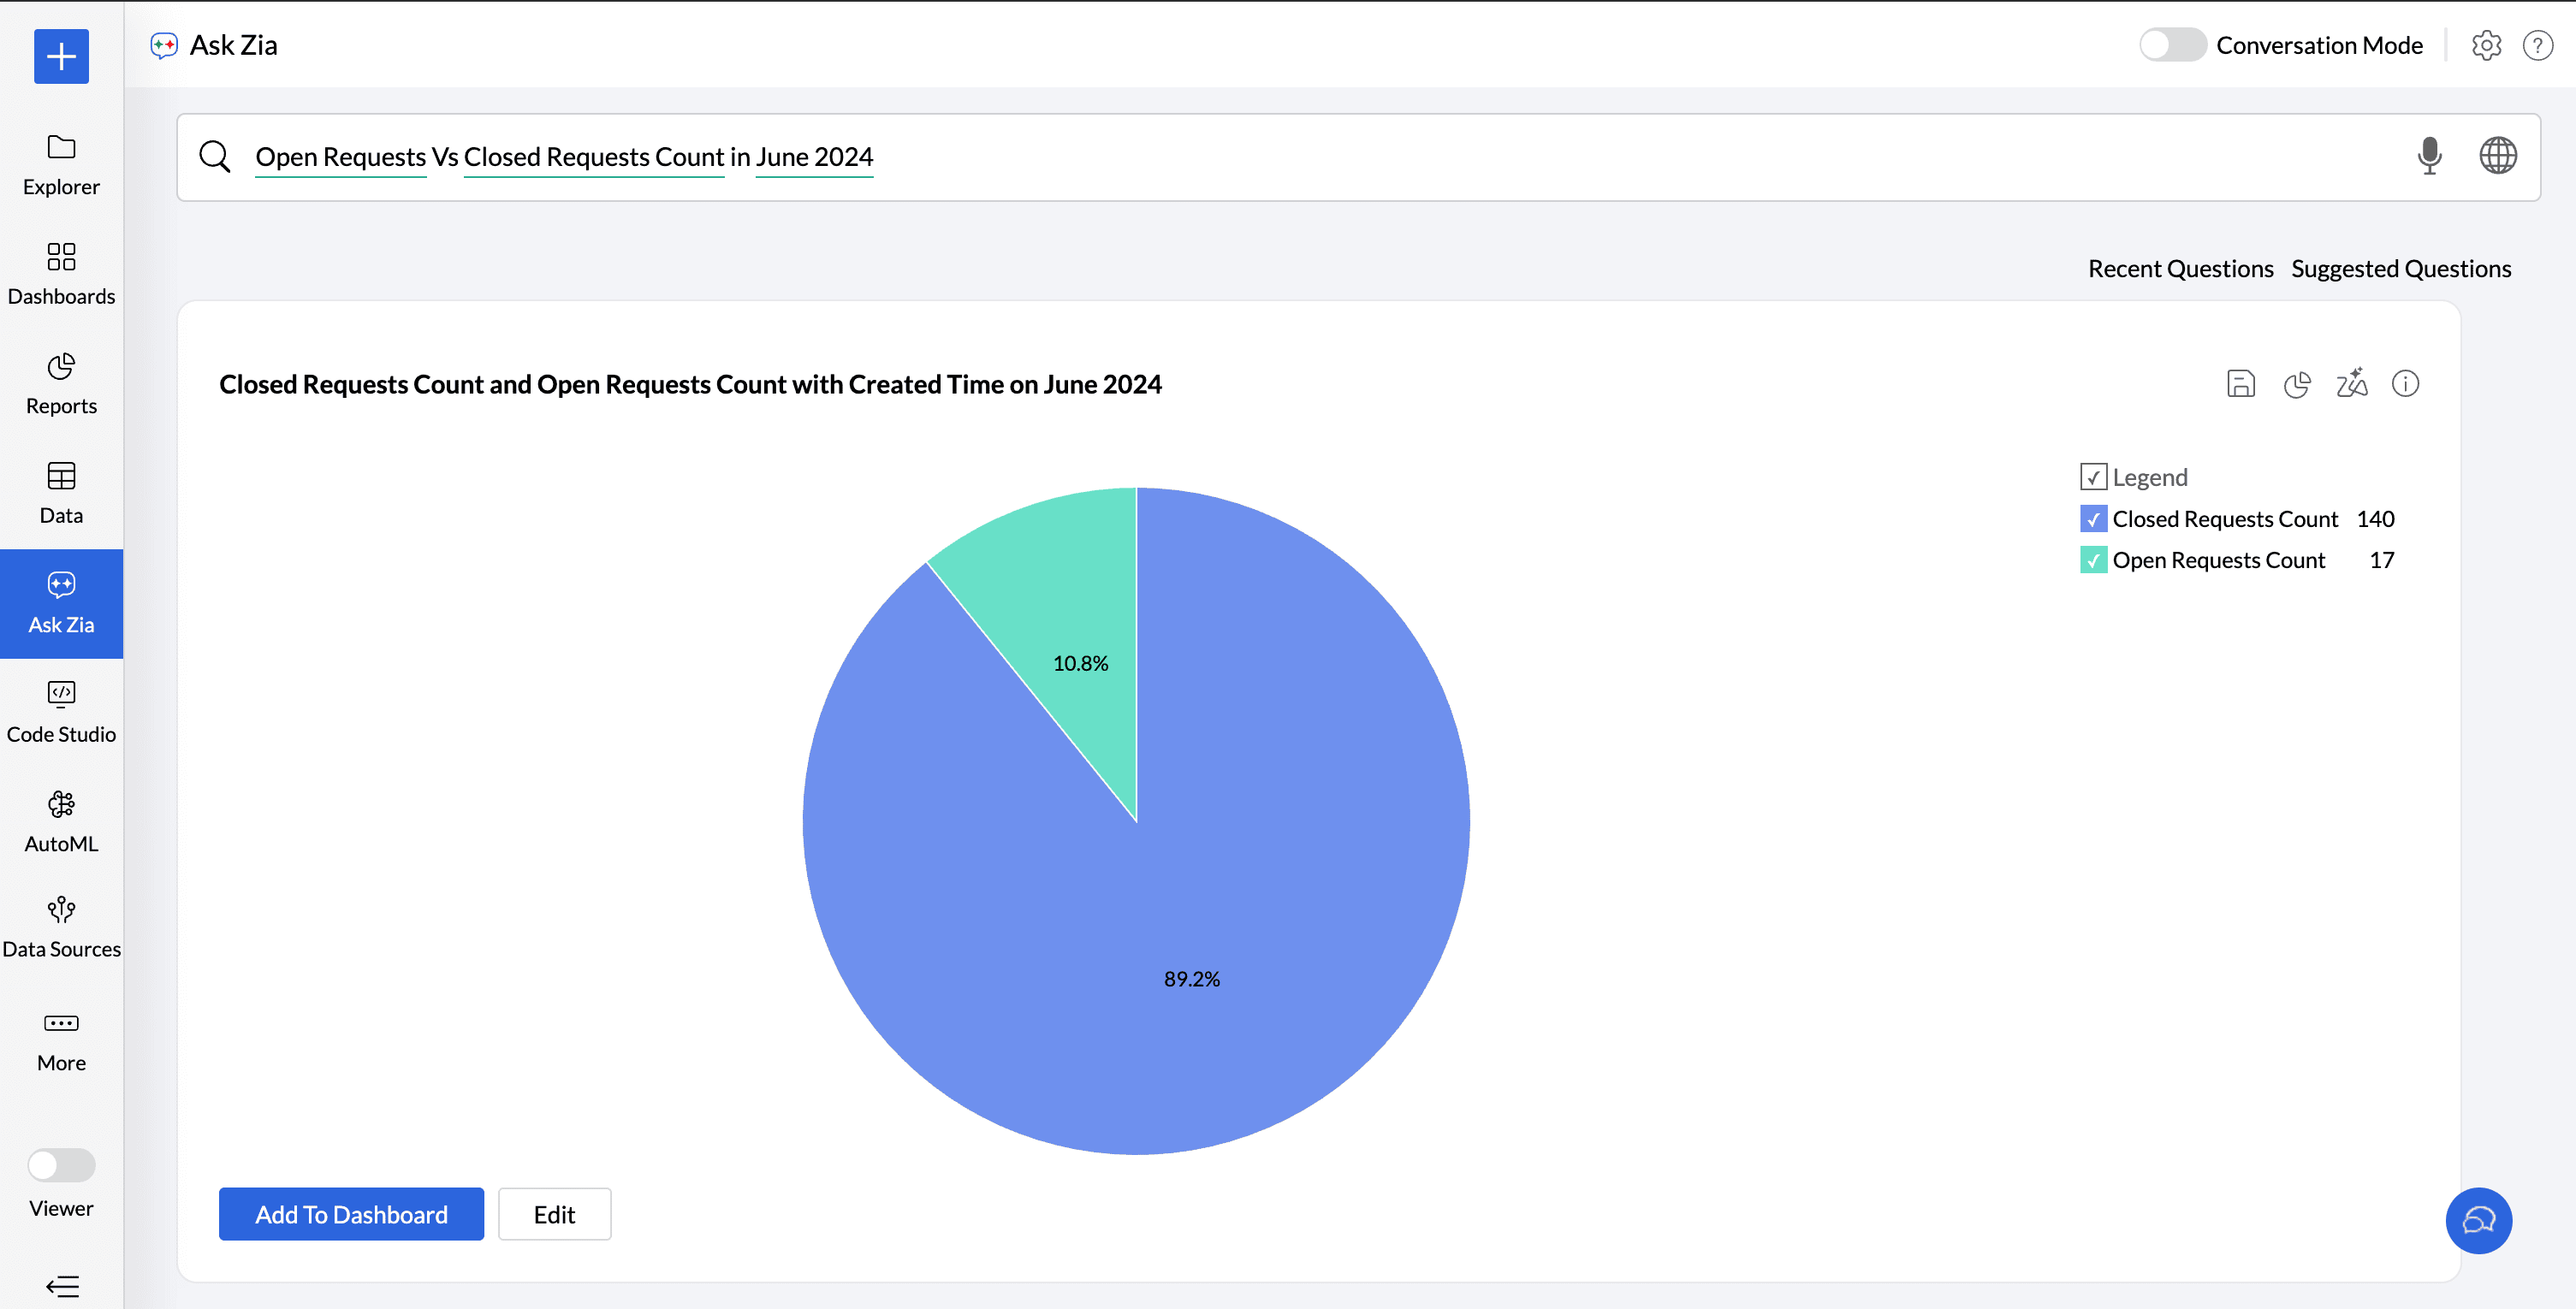
Multiple Metrics
You can ask for multiple metrics in a question. The below question gets Open Requests Vs Closed Requests count on June 2024 as a pie chart.
Open Requests Vs Closed Requests
Apply Summary Functions
Analytics Plus Cloud provides a wide range of summary functions like Sum, Count, Average, Running Total etc., Ask Zia will try to apply the best possible function over your column. You can choose to change them in your question.
Summary Function
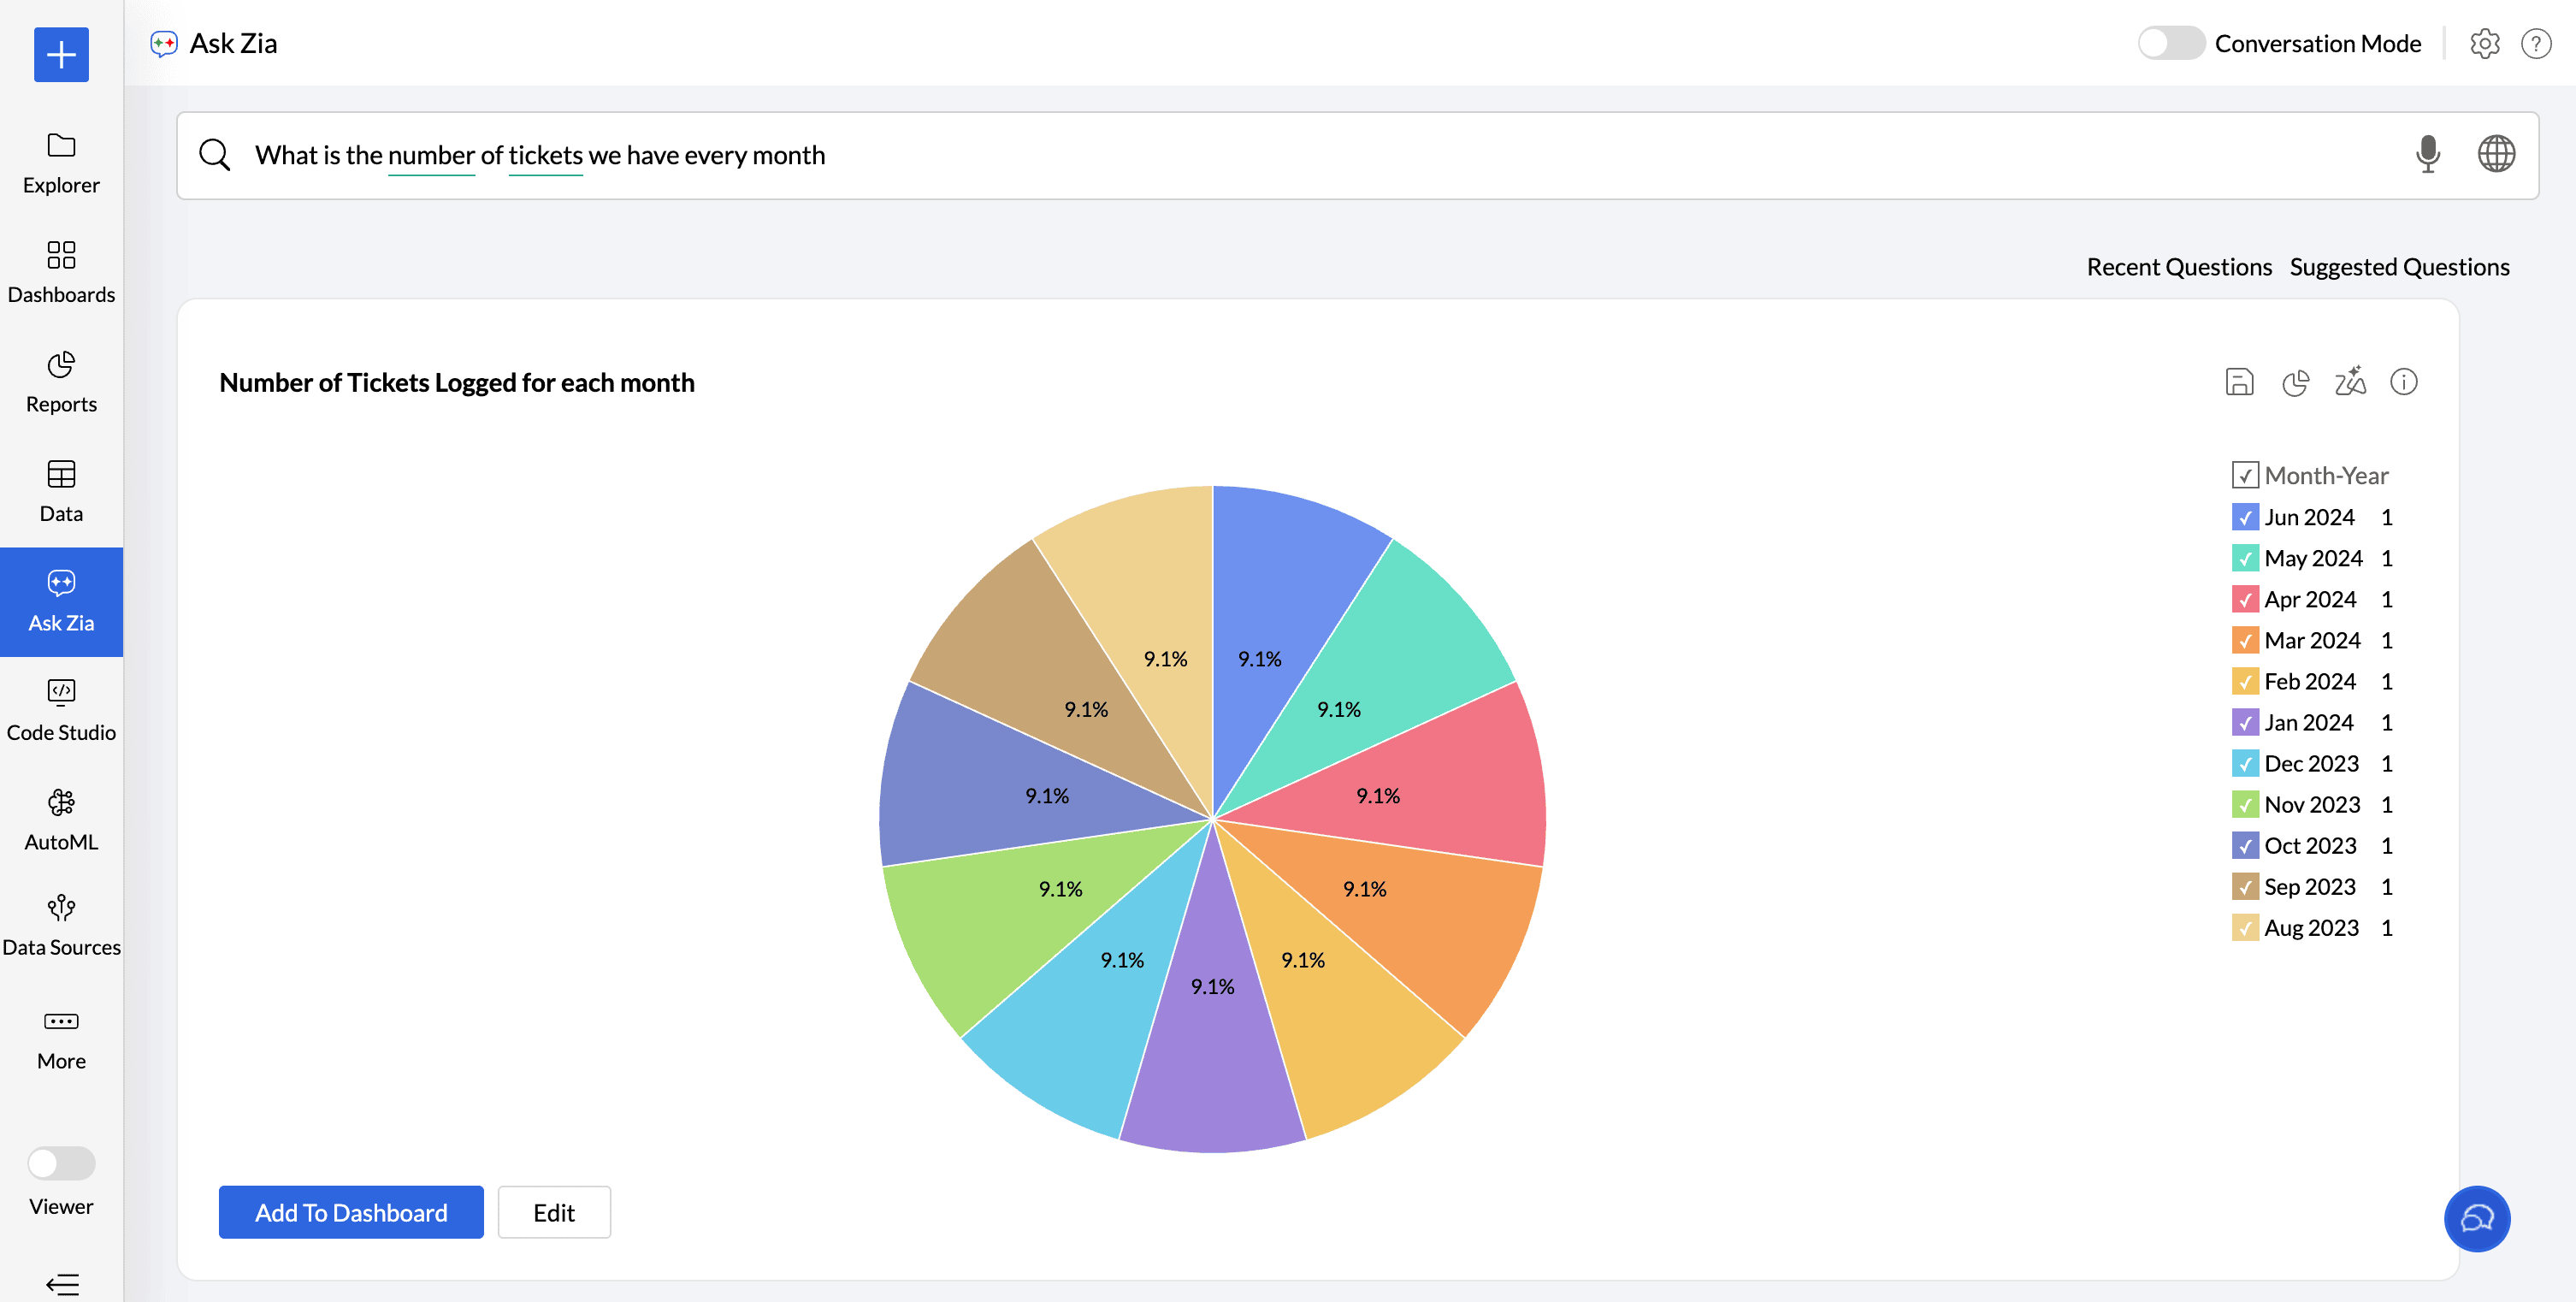
You can choose the apply the supported summary functions over a metric column by explicitly specifying them in your question.
what is the number of tickets we have every month?
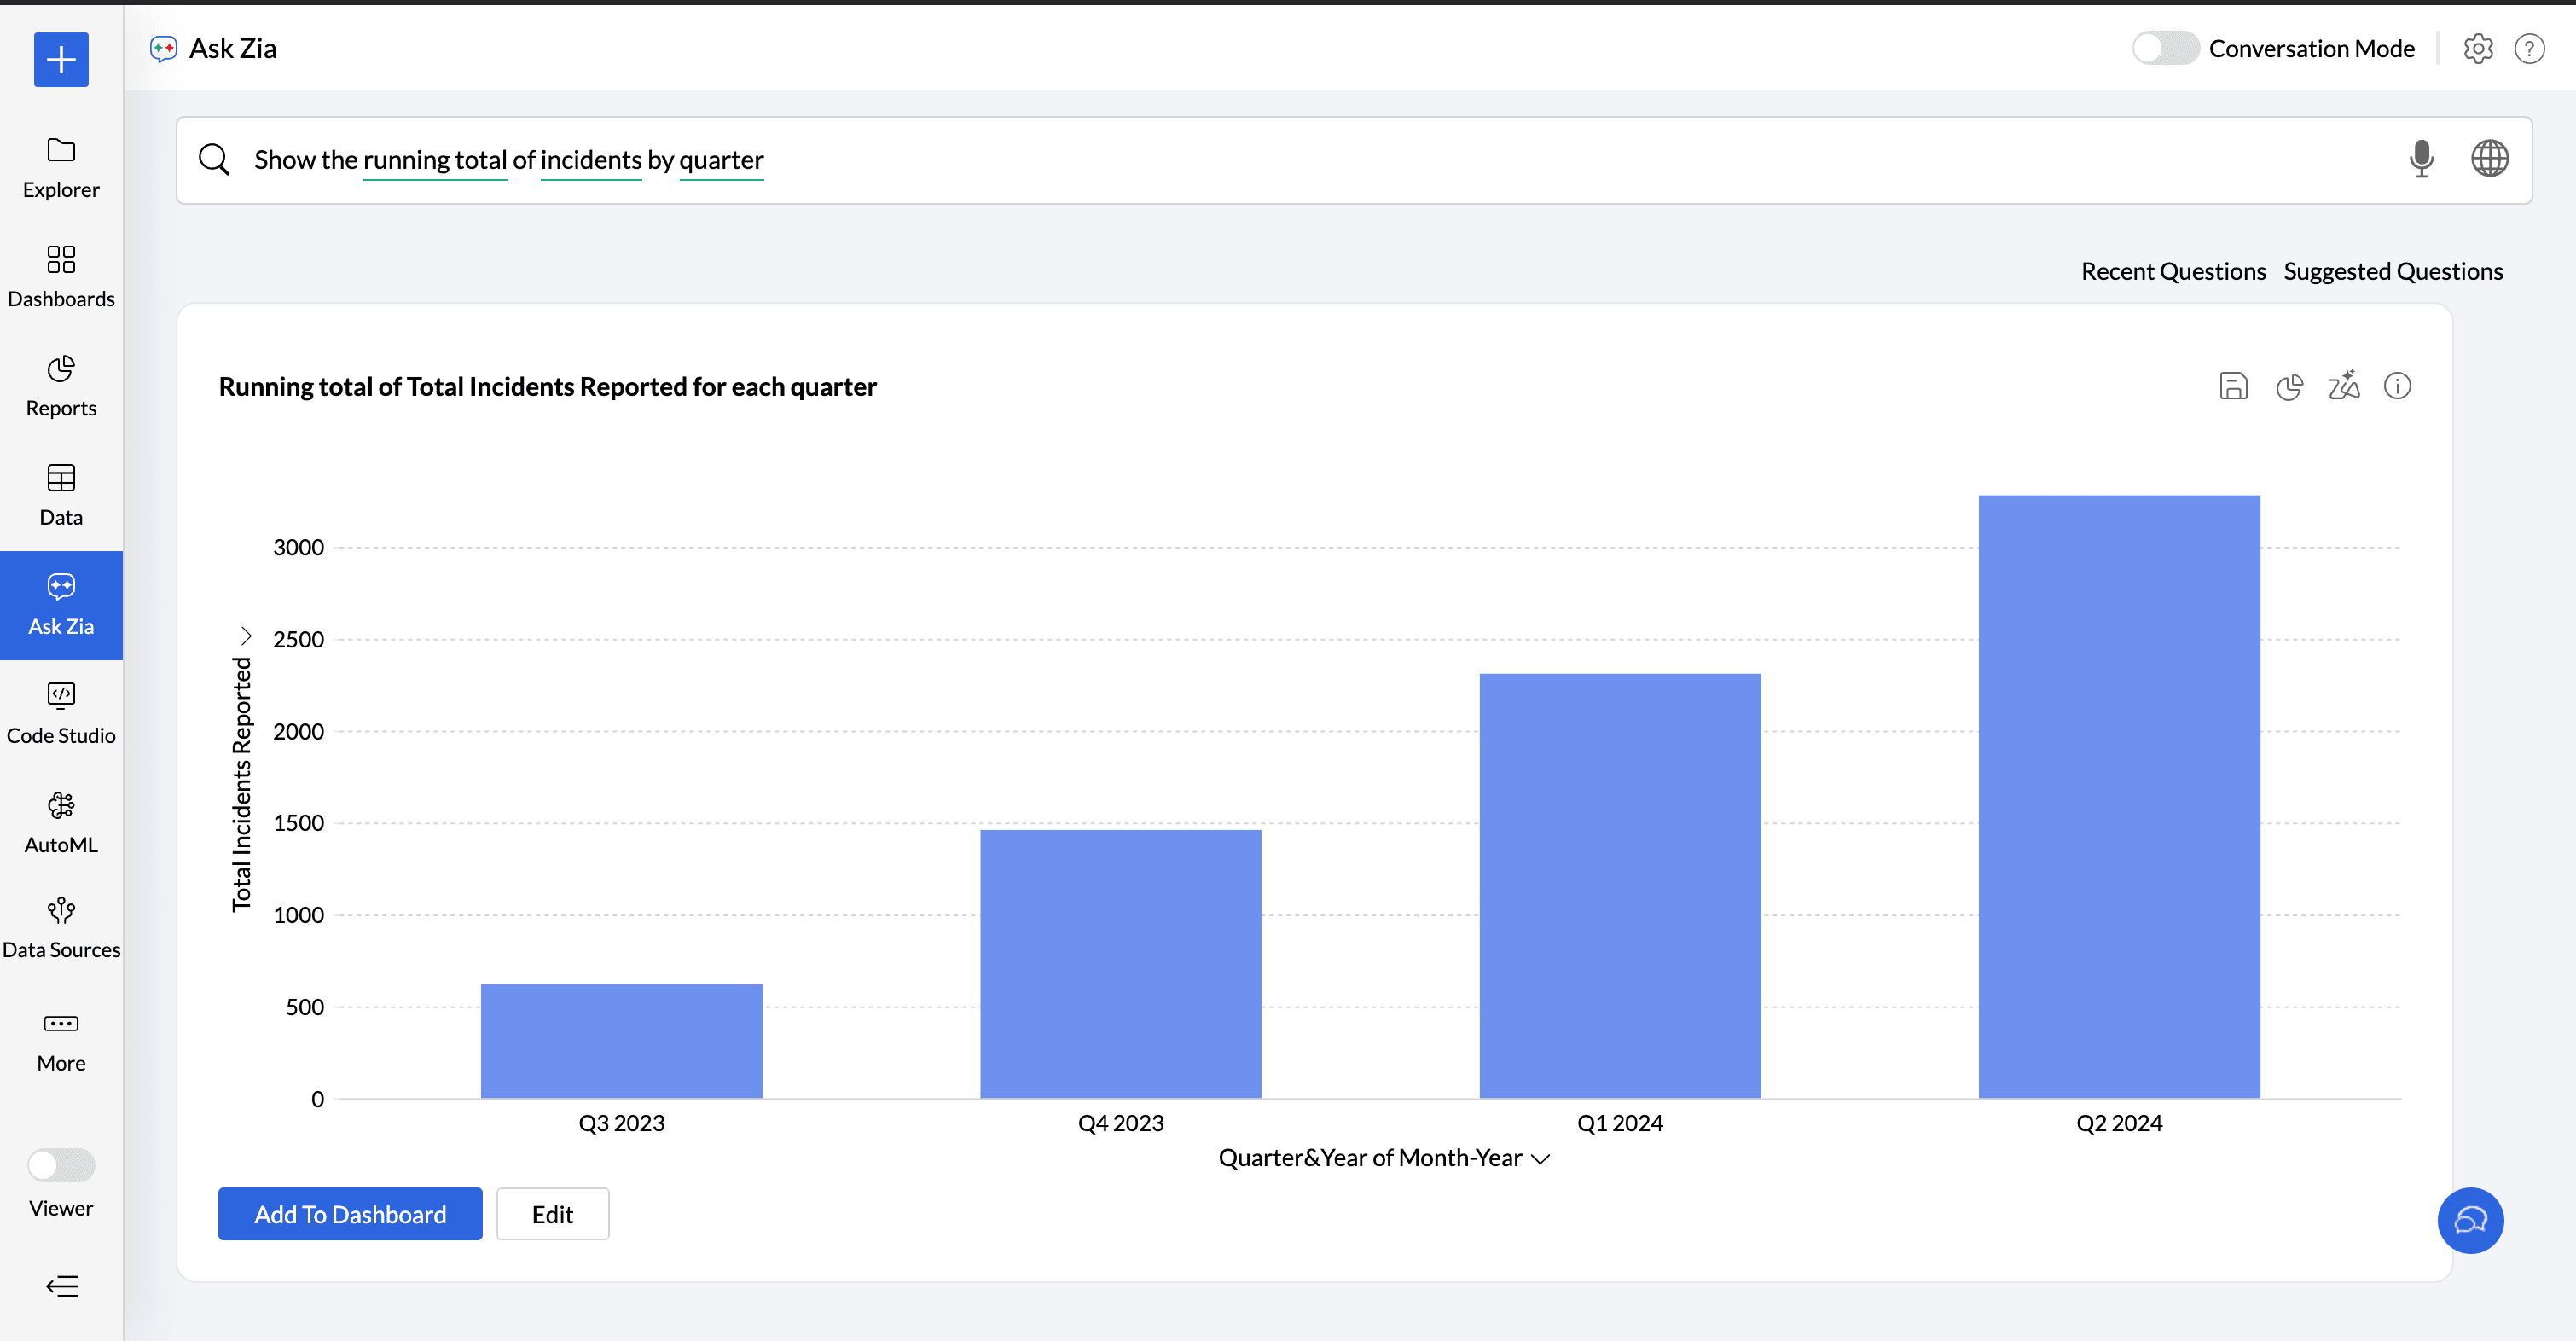
Advanced Summary Function
Ask Zia can also apply advanced summary functions. The below question applies the advanced summary function running total of incidents and calculates it across the quarters.
Show me the running total of incidents by Quarter.
Predictive Analysis
Ask Zia supports predictive analysis. You can easily predict the data trend or forecast your future data.
Forecast
You can forecast the data by simply asking for the future data. For example, you can give a simple query such as "Get me the incidents count for next 6 months".
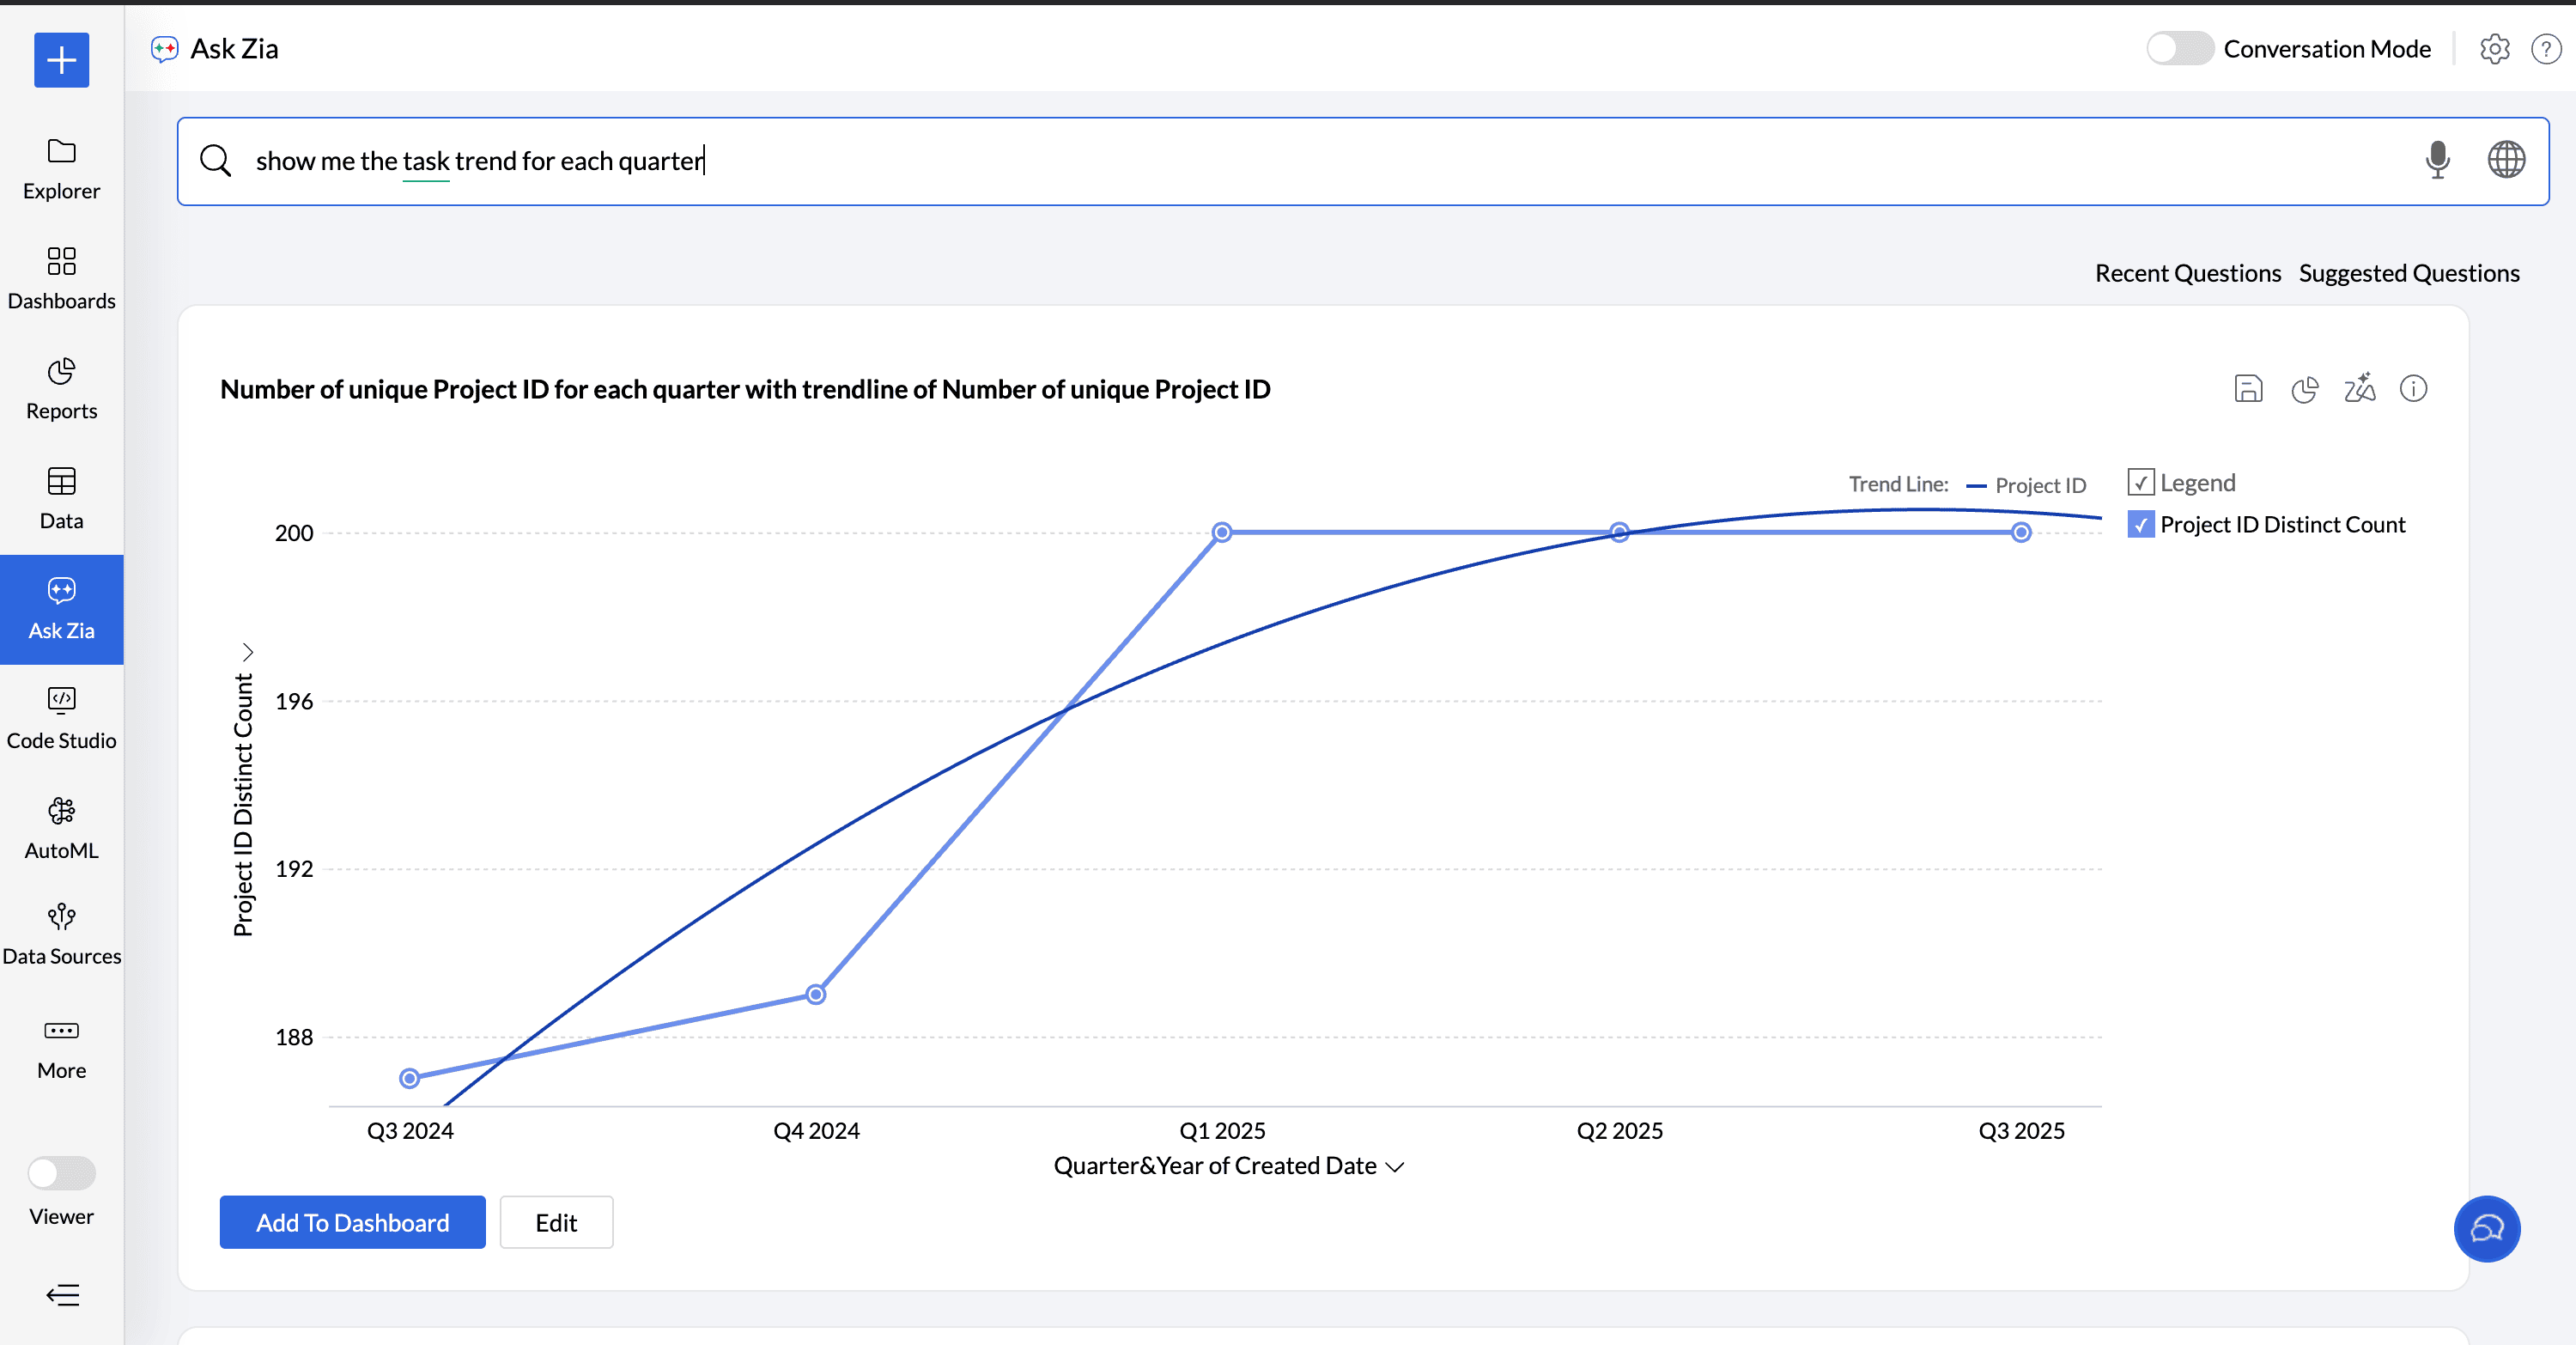
Trend Line
Ask Zia supports adding a trendline to your chart. In addition, you can also forecast data and include a trendline in the chart by using terms such as trend or trendline in your question.
In the following example, Ask Zia predicts the task trend.
Show me the Task Trend
Statistical Measures
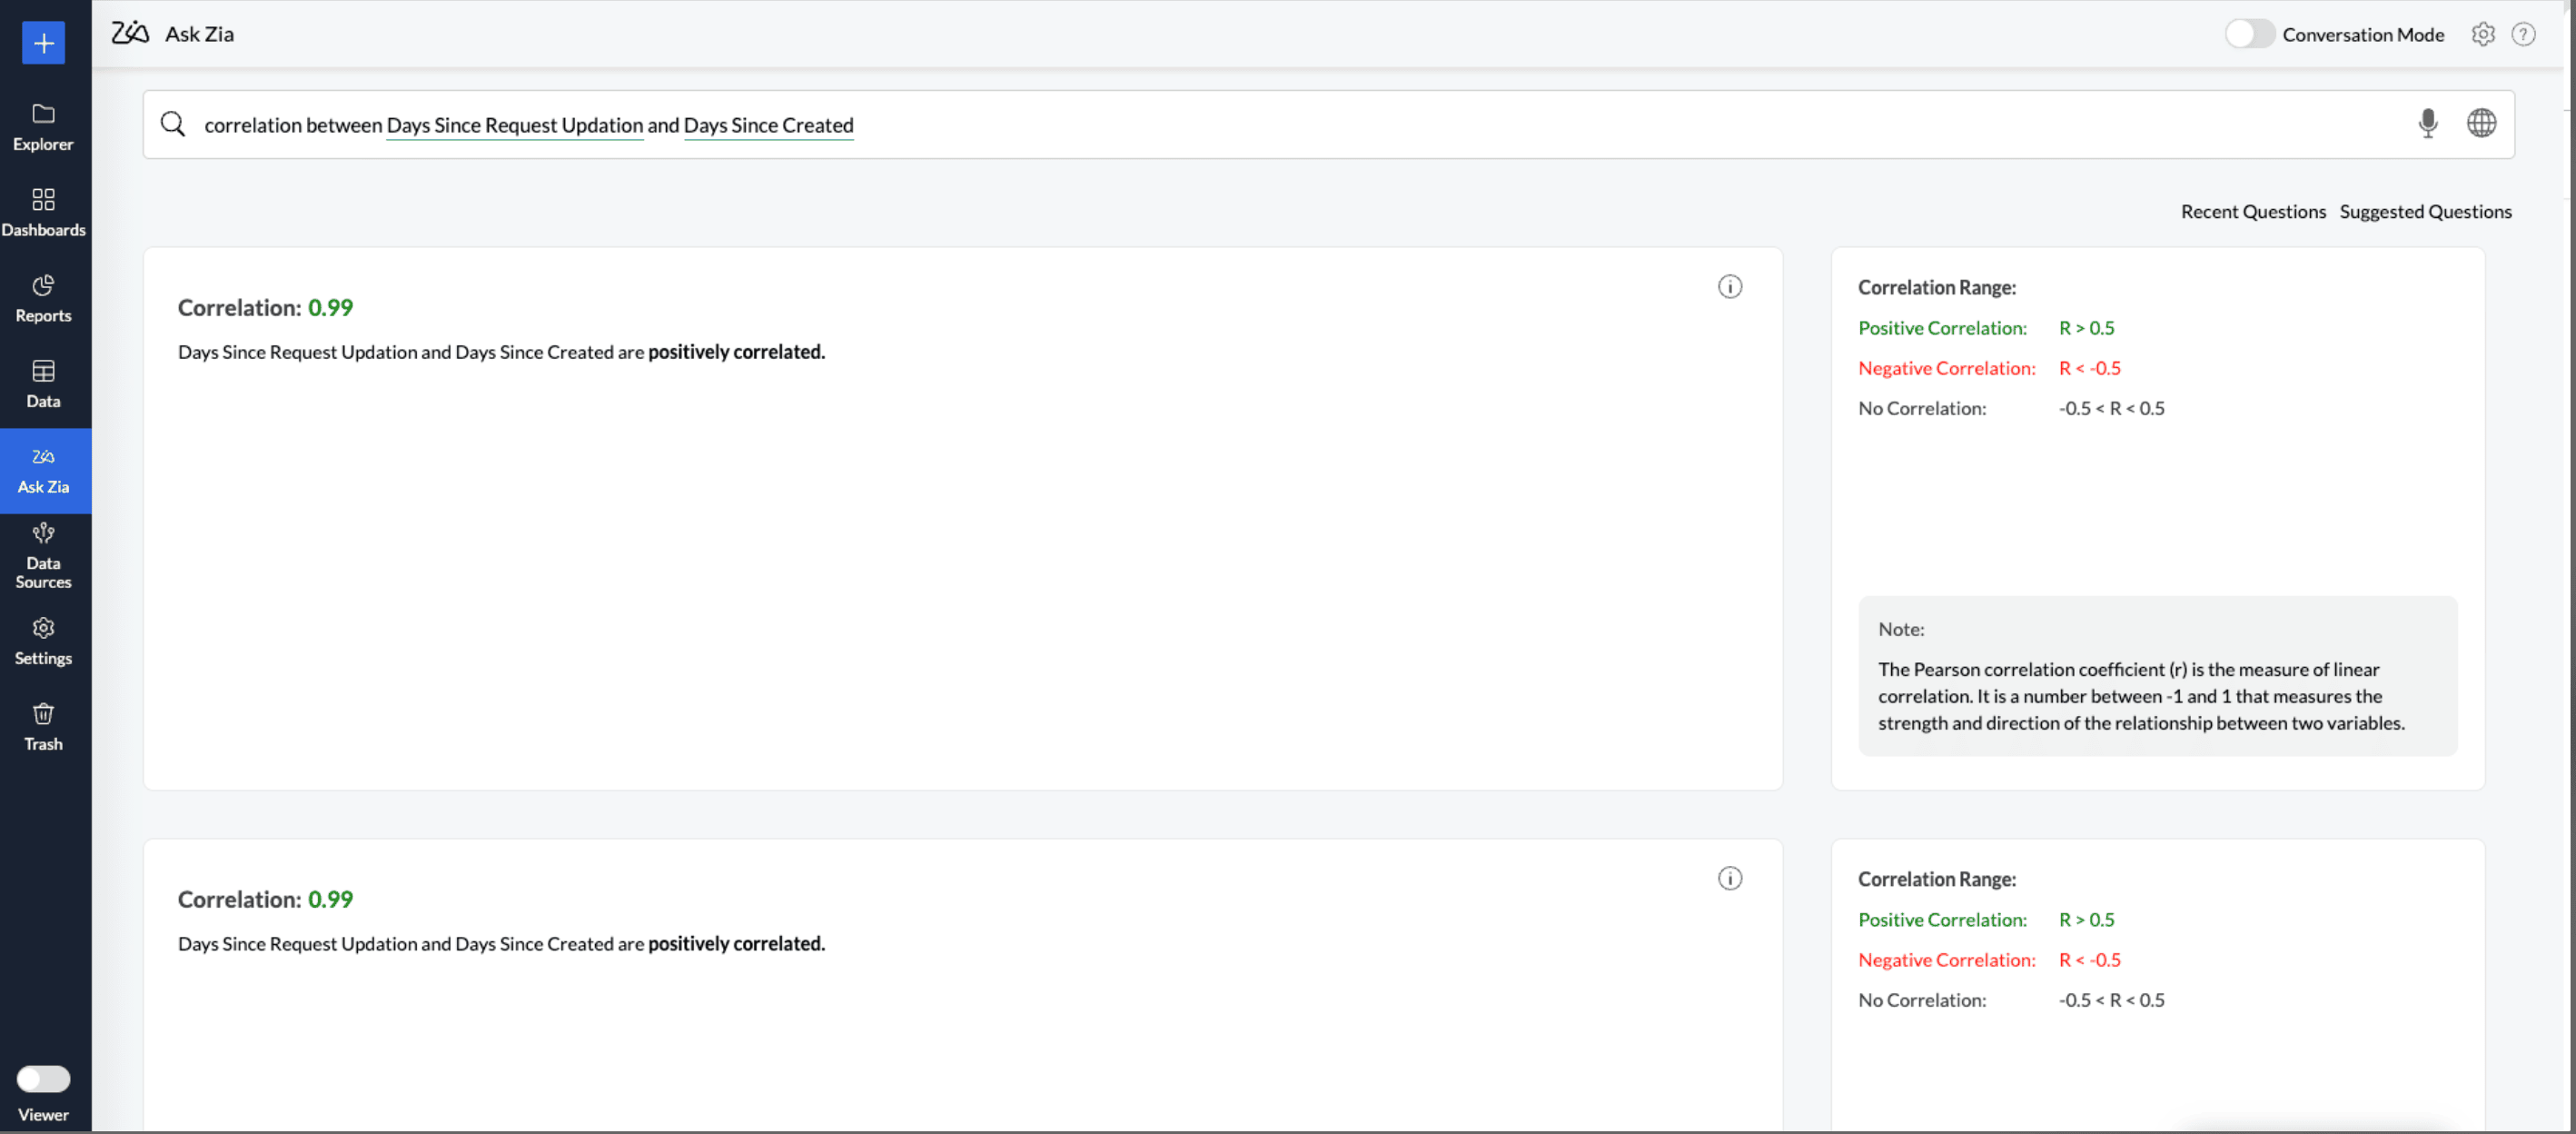
Find the correlations between metrics
Correlation helps find if and how strongly two measures are related to each other. If a measure or variable increases or decreases together, they are positively correlated. If one measure tends to increase and another one decreases, then they are negatively correlated.
Zia computes the correlation using Pearson's Correlation Coefficient, which is the covariance of the two variables to the product of their standard deviations.
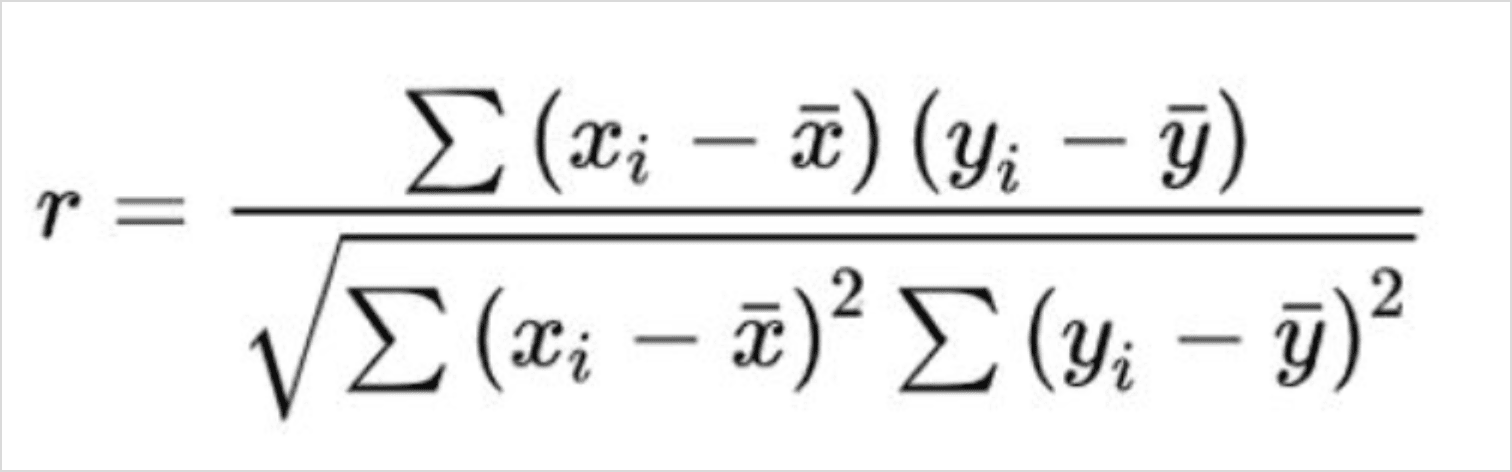
The value of the Pearson's Correlation Coefficient ranges from -1 to +1.
R > 0.5 indicates a positive linear relationship.
R value between - 0.5 and 0.5 (- 0.5 < R < 0.5) indicates no linear relationship.
R < - 0.5 indicates a negative linear relationship.
Sample query:
Give me or find the correlation between Days Since Request Updation and Days Since Created
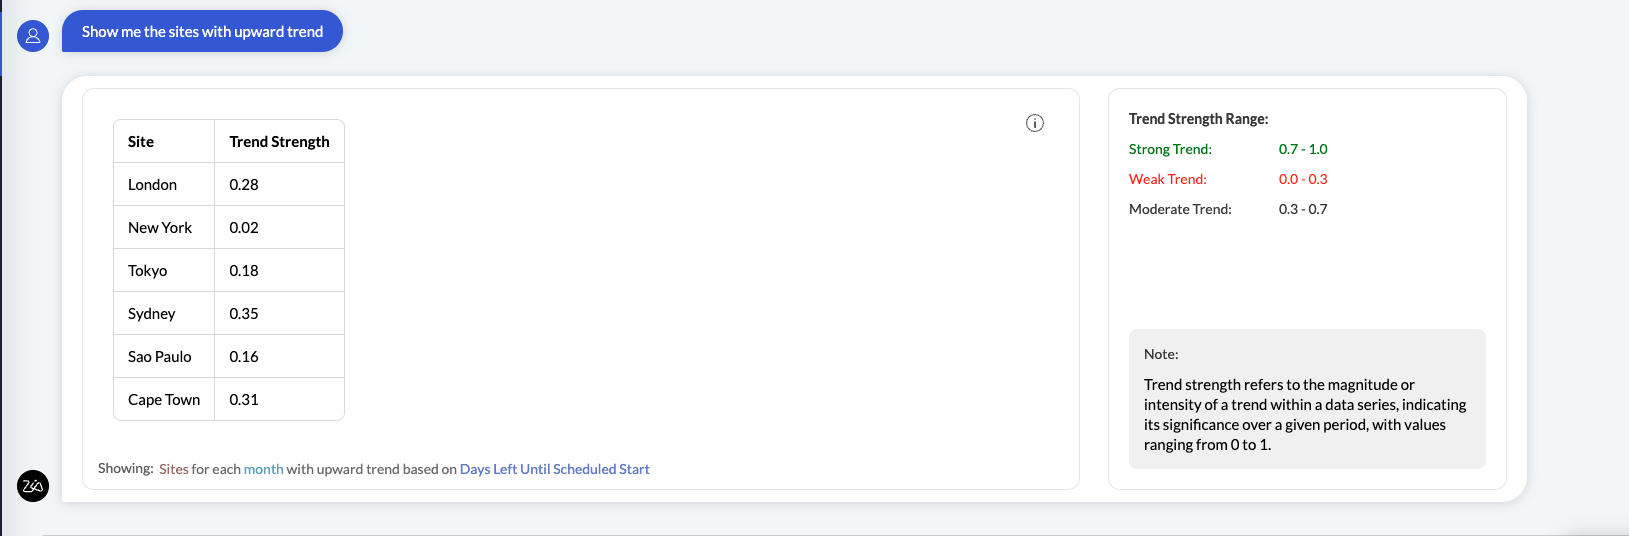
Find Trends Strength in the data
Trend strength is a statistical measure used to determine how strongly data is moving in an upward or downward direction. It helps assess whether a trend is likely to continue or weaken.
If the value ranges between 0.0 to 0.3, it indicates a weak trend meaning the data does not follow a clear upward or downward path.
If the value ranges between 0.3 to 0.7, then it indicates a moderate trend meaning the data shows a relatively consistent direction (upward or downward), but with occasional fluctuations or deviations.
If the value ranges between 0.7 to 1.0, it indicates a strong trend meaning the data consistently moves in one direction (upward or downward).
Show me the sites with upward trend:
Group the Metric Column
You can group the metric column using phrases like group by / categorised by / across. The following types of groupings are supported.
Single Metric by a Single Dimension
Single Metric by Multiple Dimensions
Multiple Metrics by a Single Dimension
Multiple Metrics by Multiple Dimensions
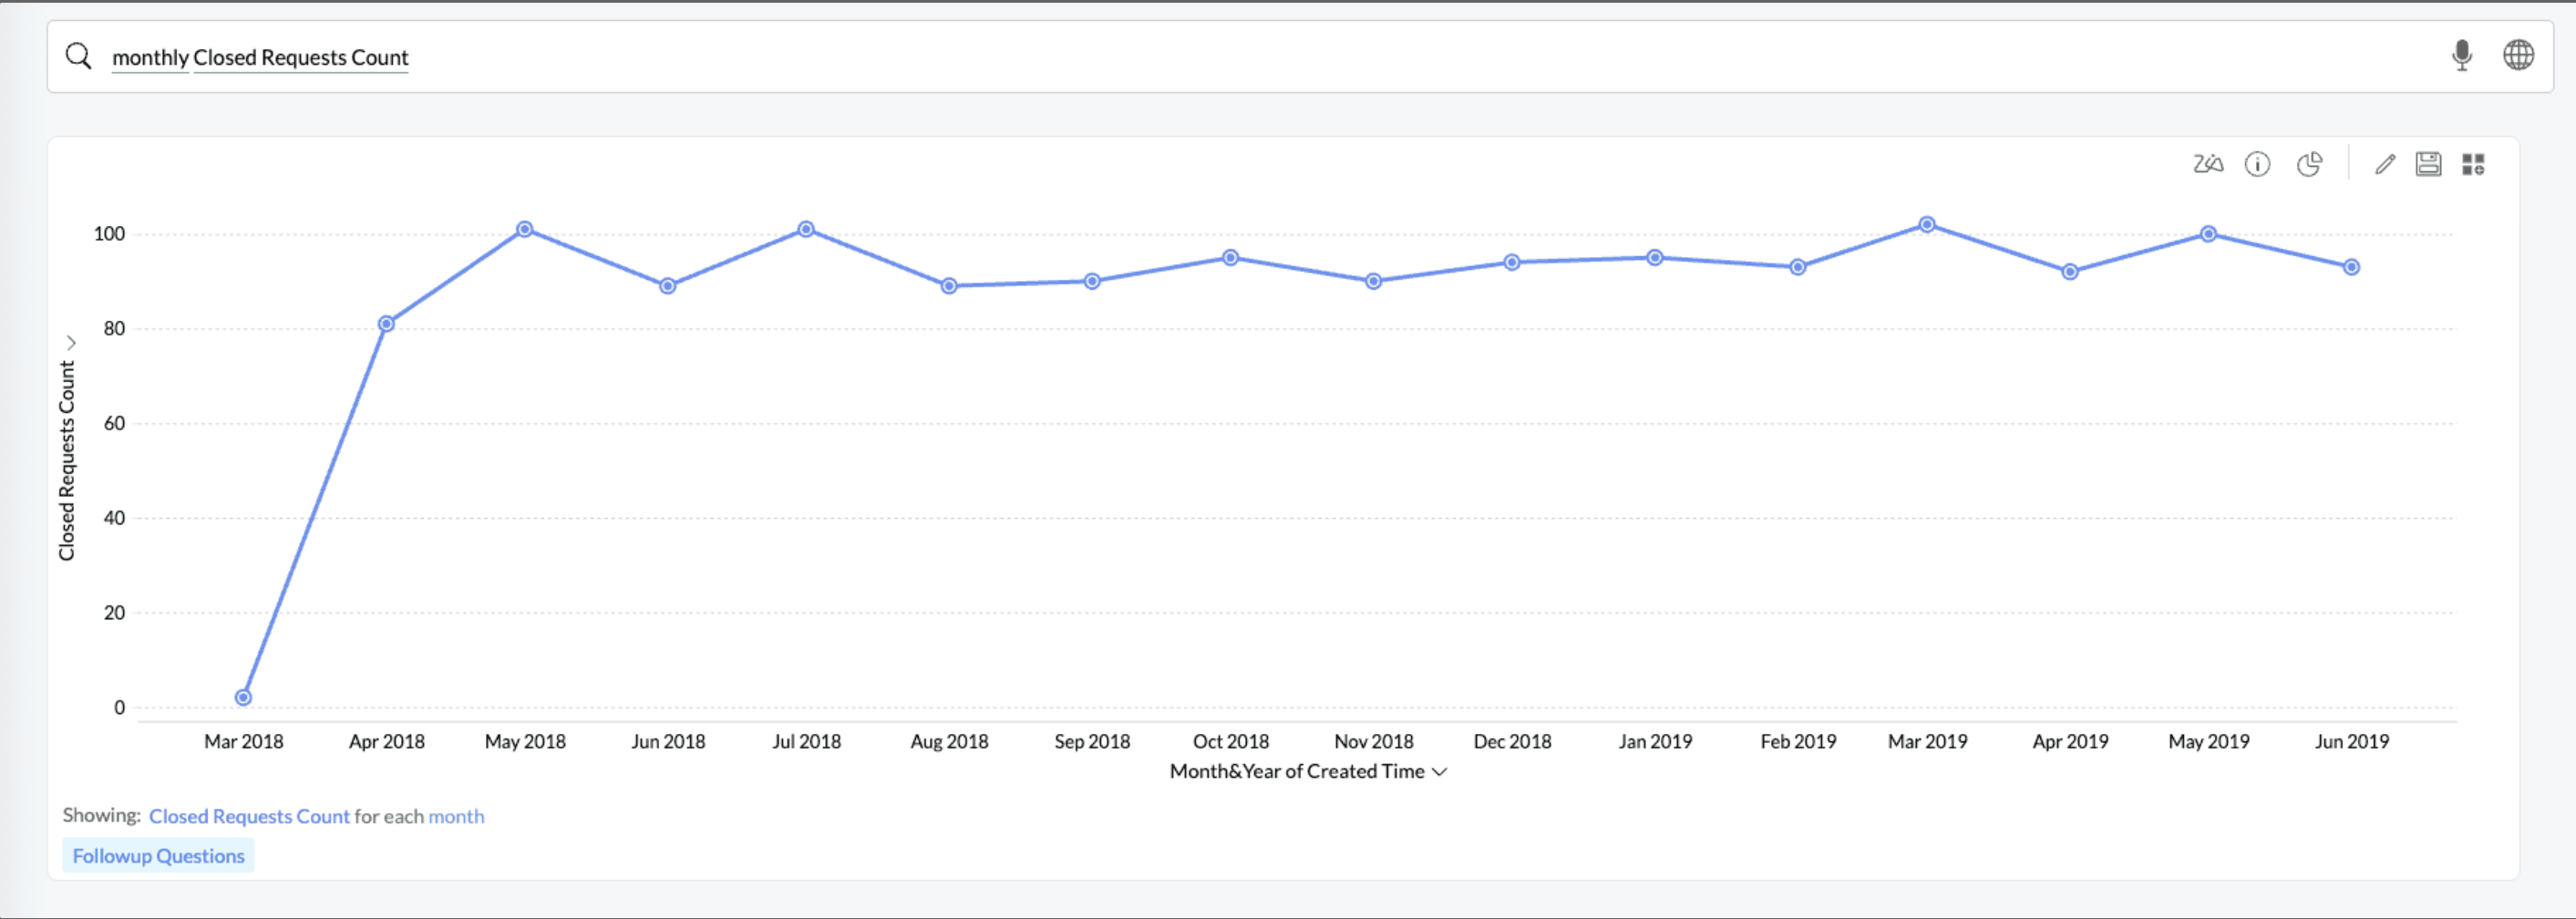
Single Metric by a Single Dimension
Monthly Closed Requests Count
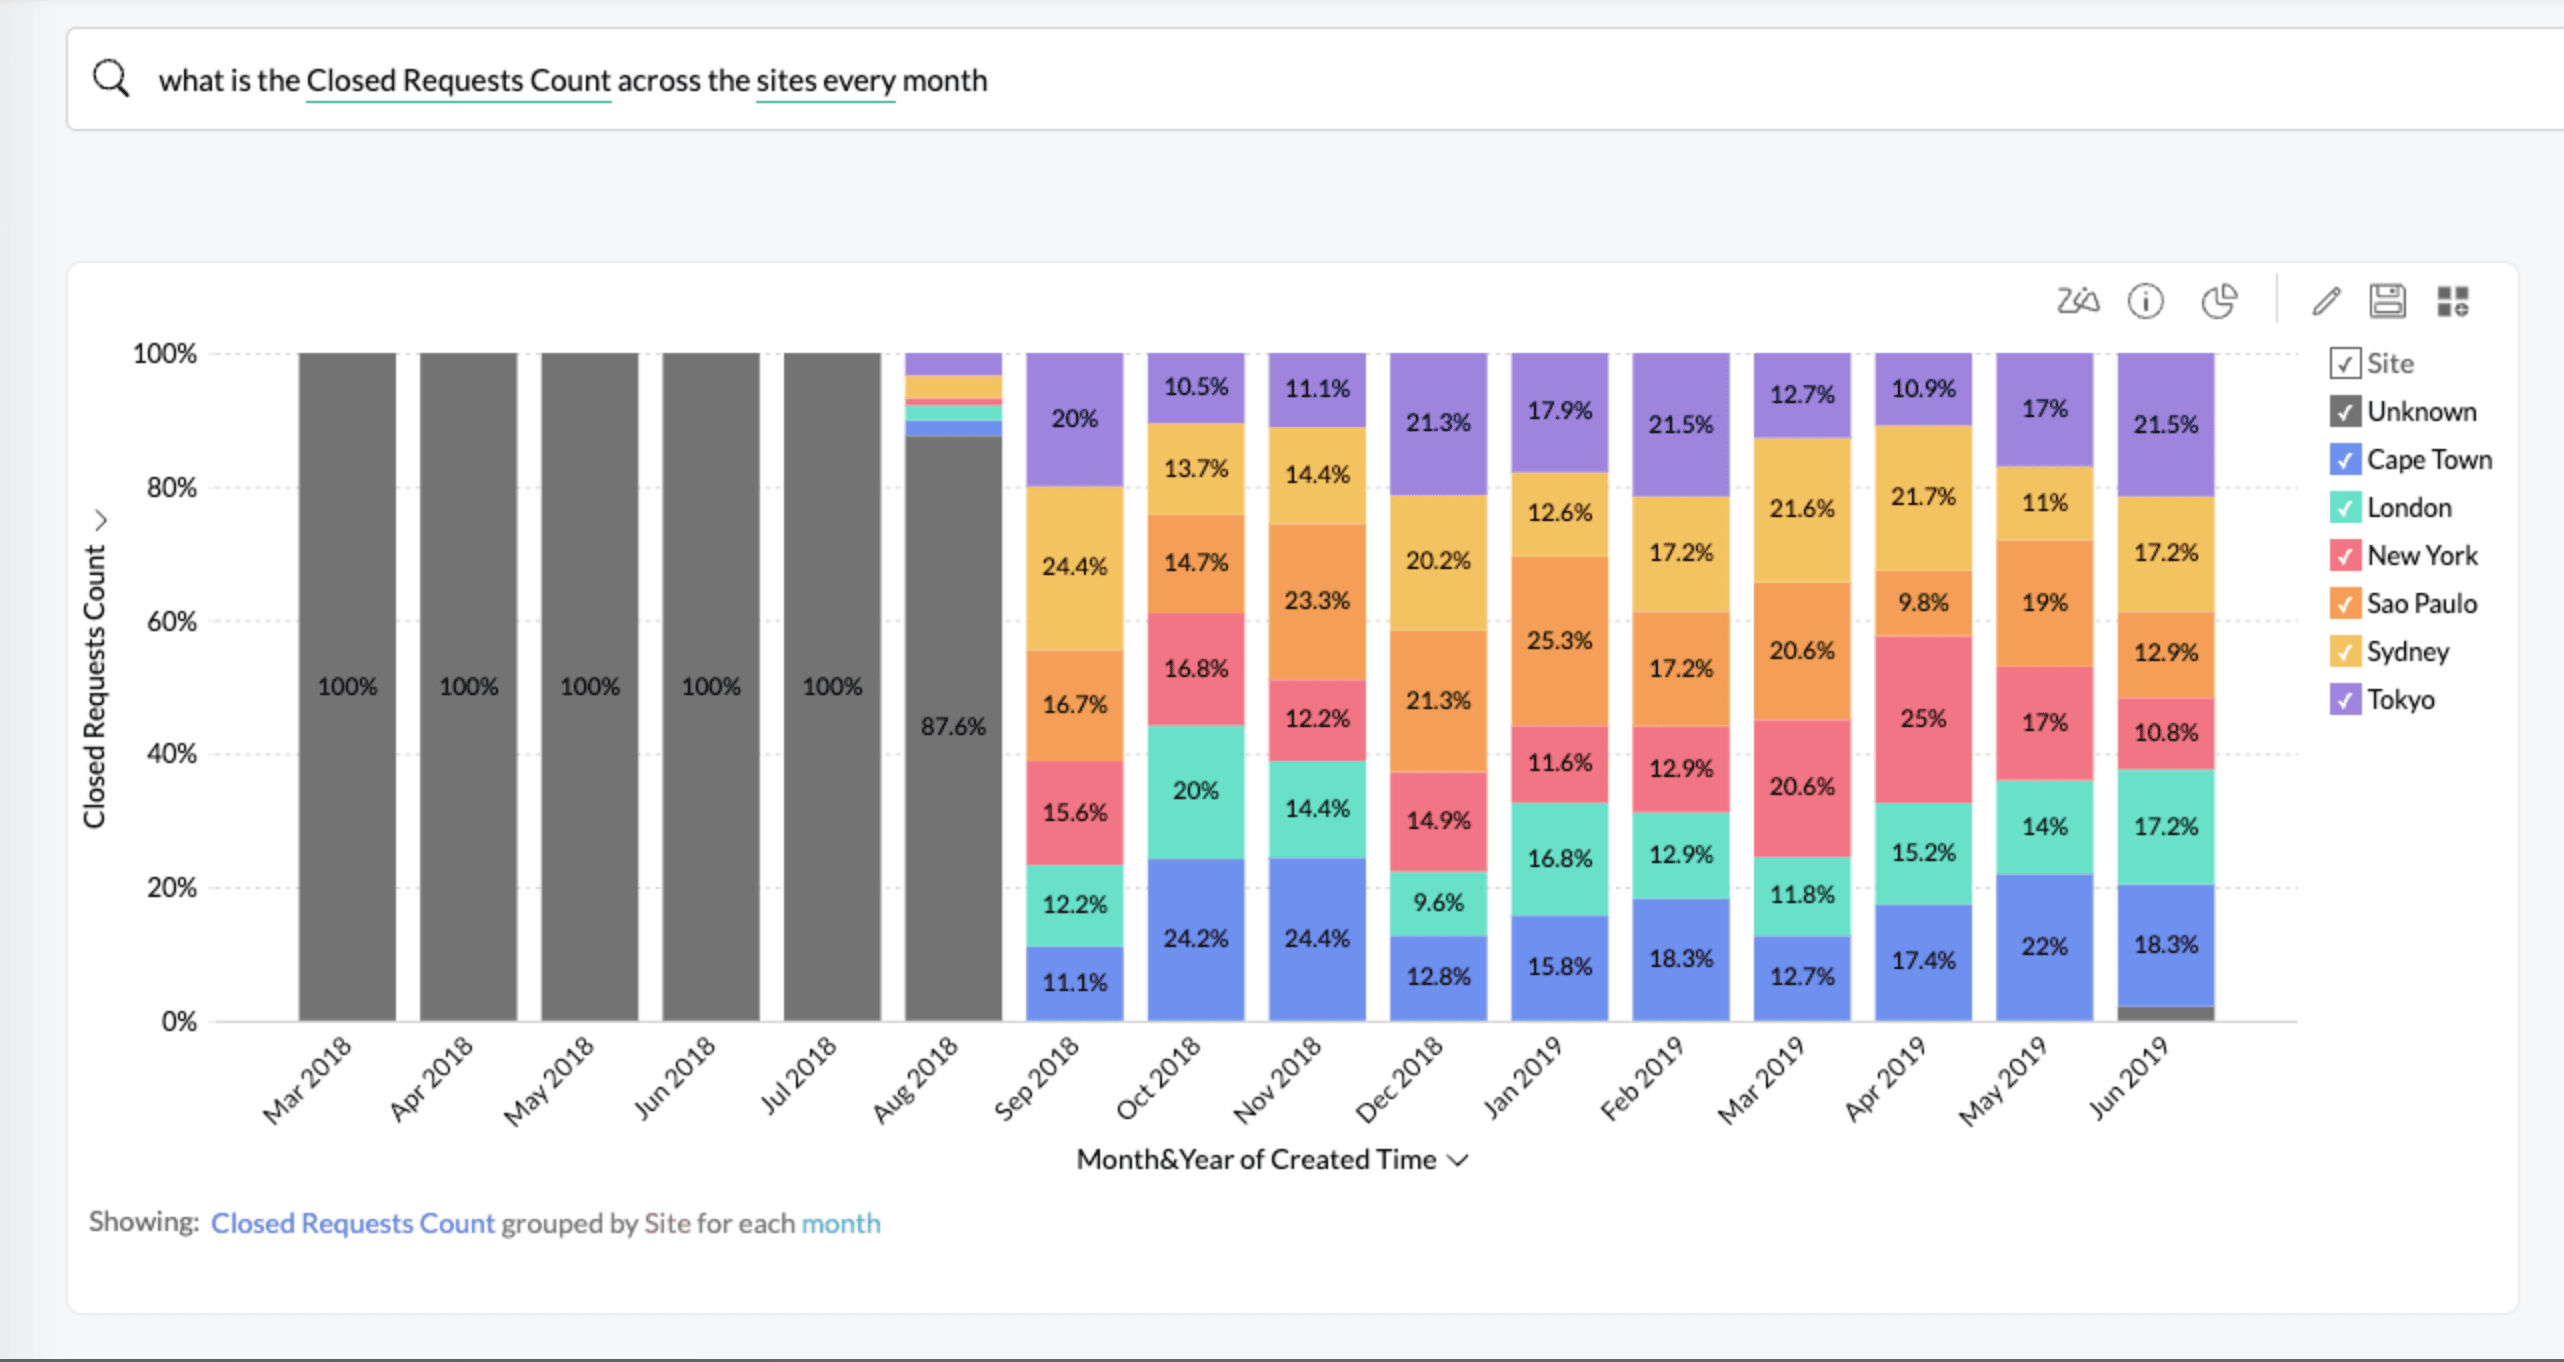
Single Metric by Multiple Dimensions
what is the Closed Requests Count across the sites every month?
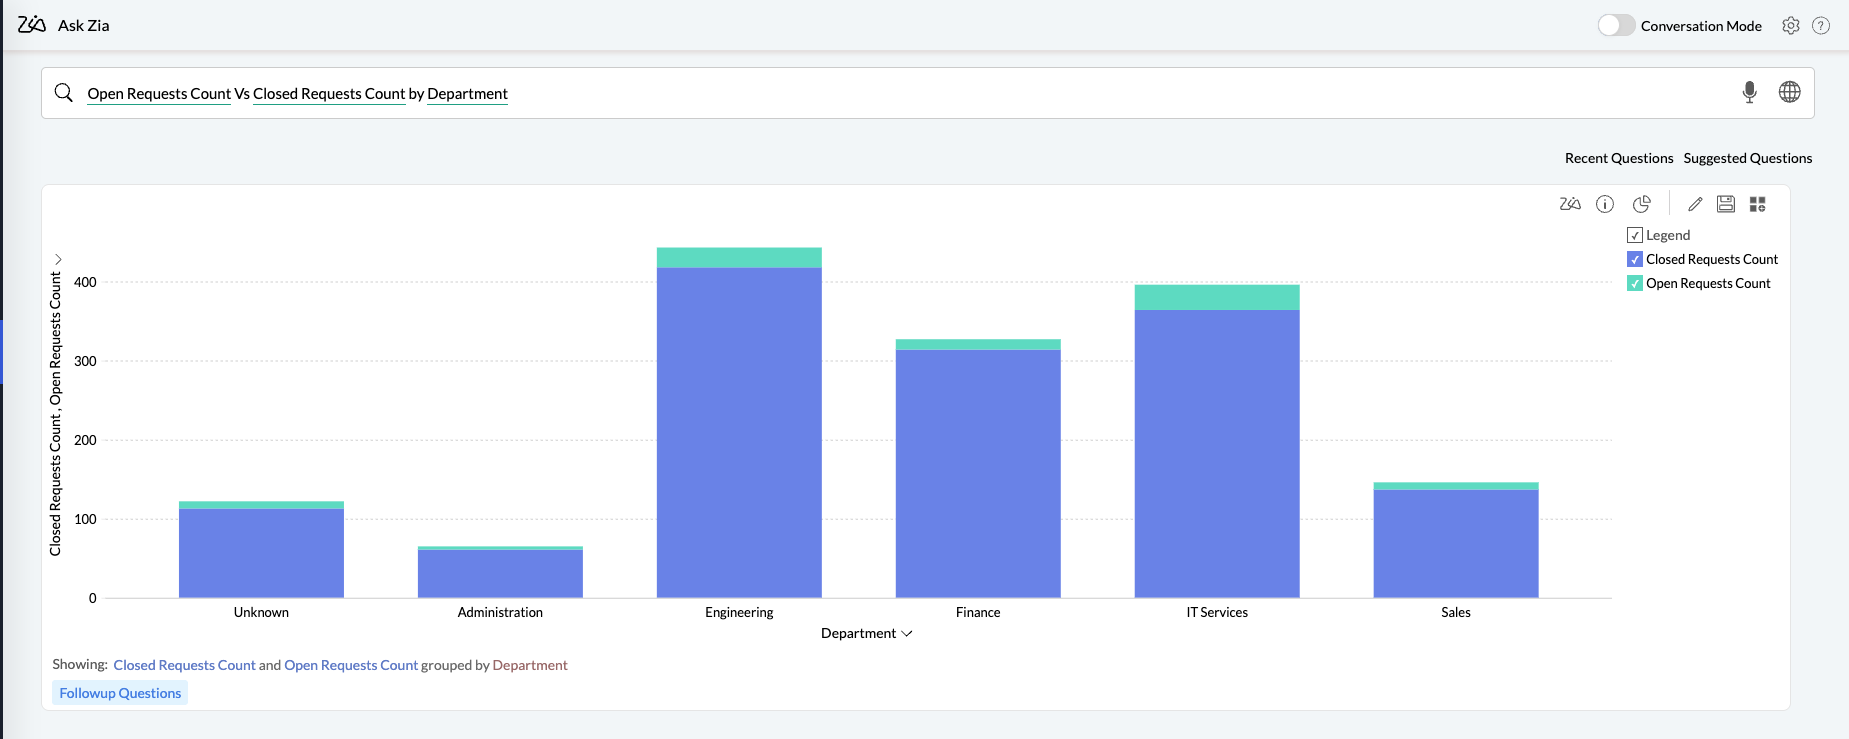
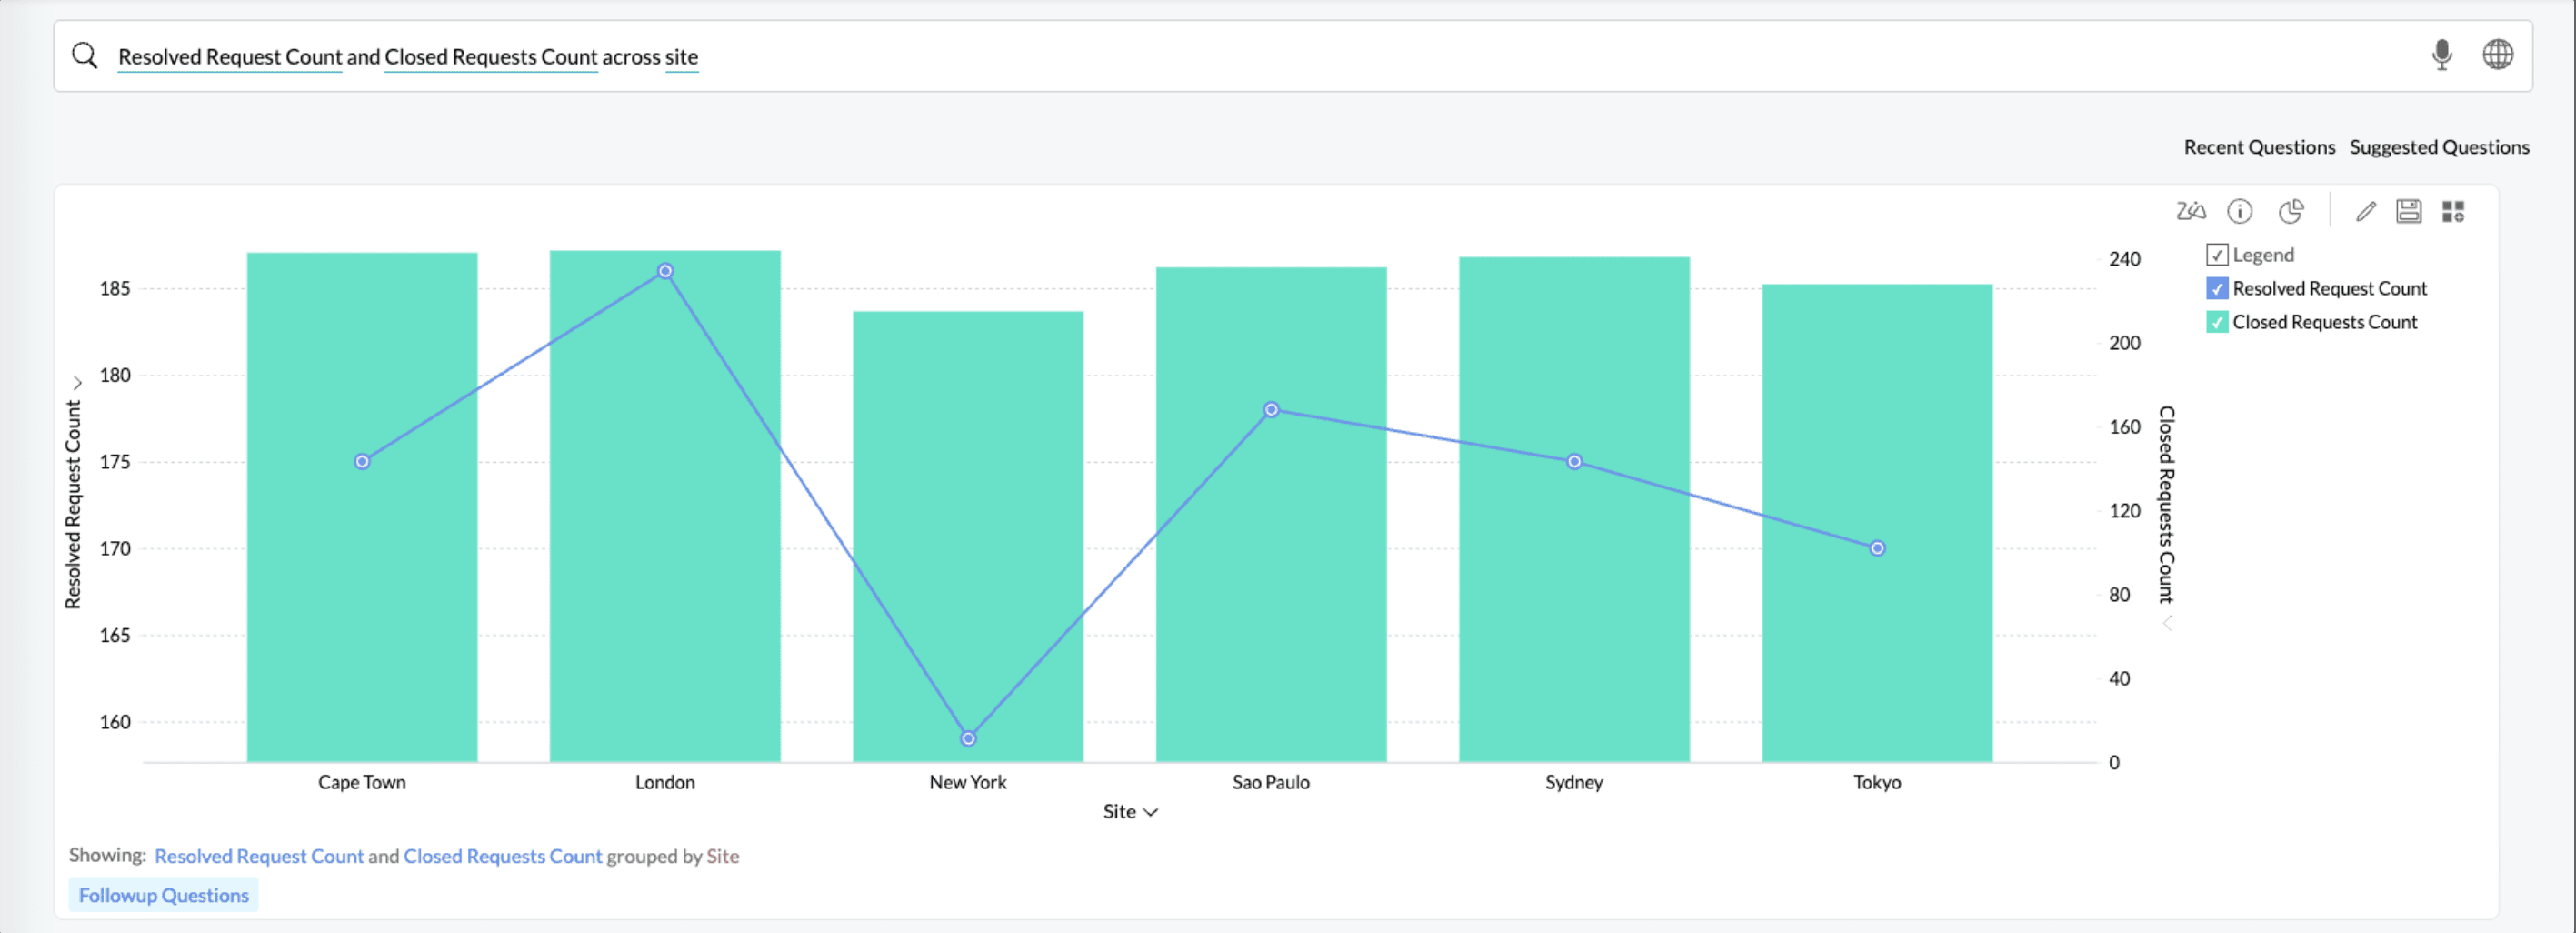
Multiple Metrics by a Single Dimension
Resolved Request Count and Closed Request Count across Site
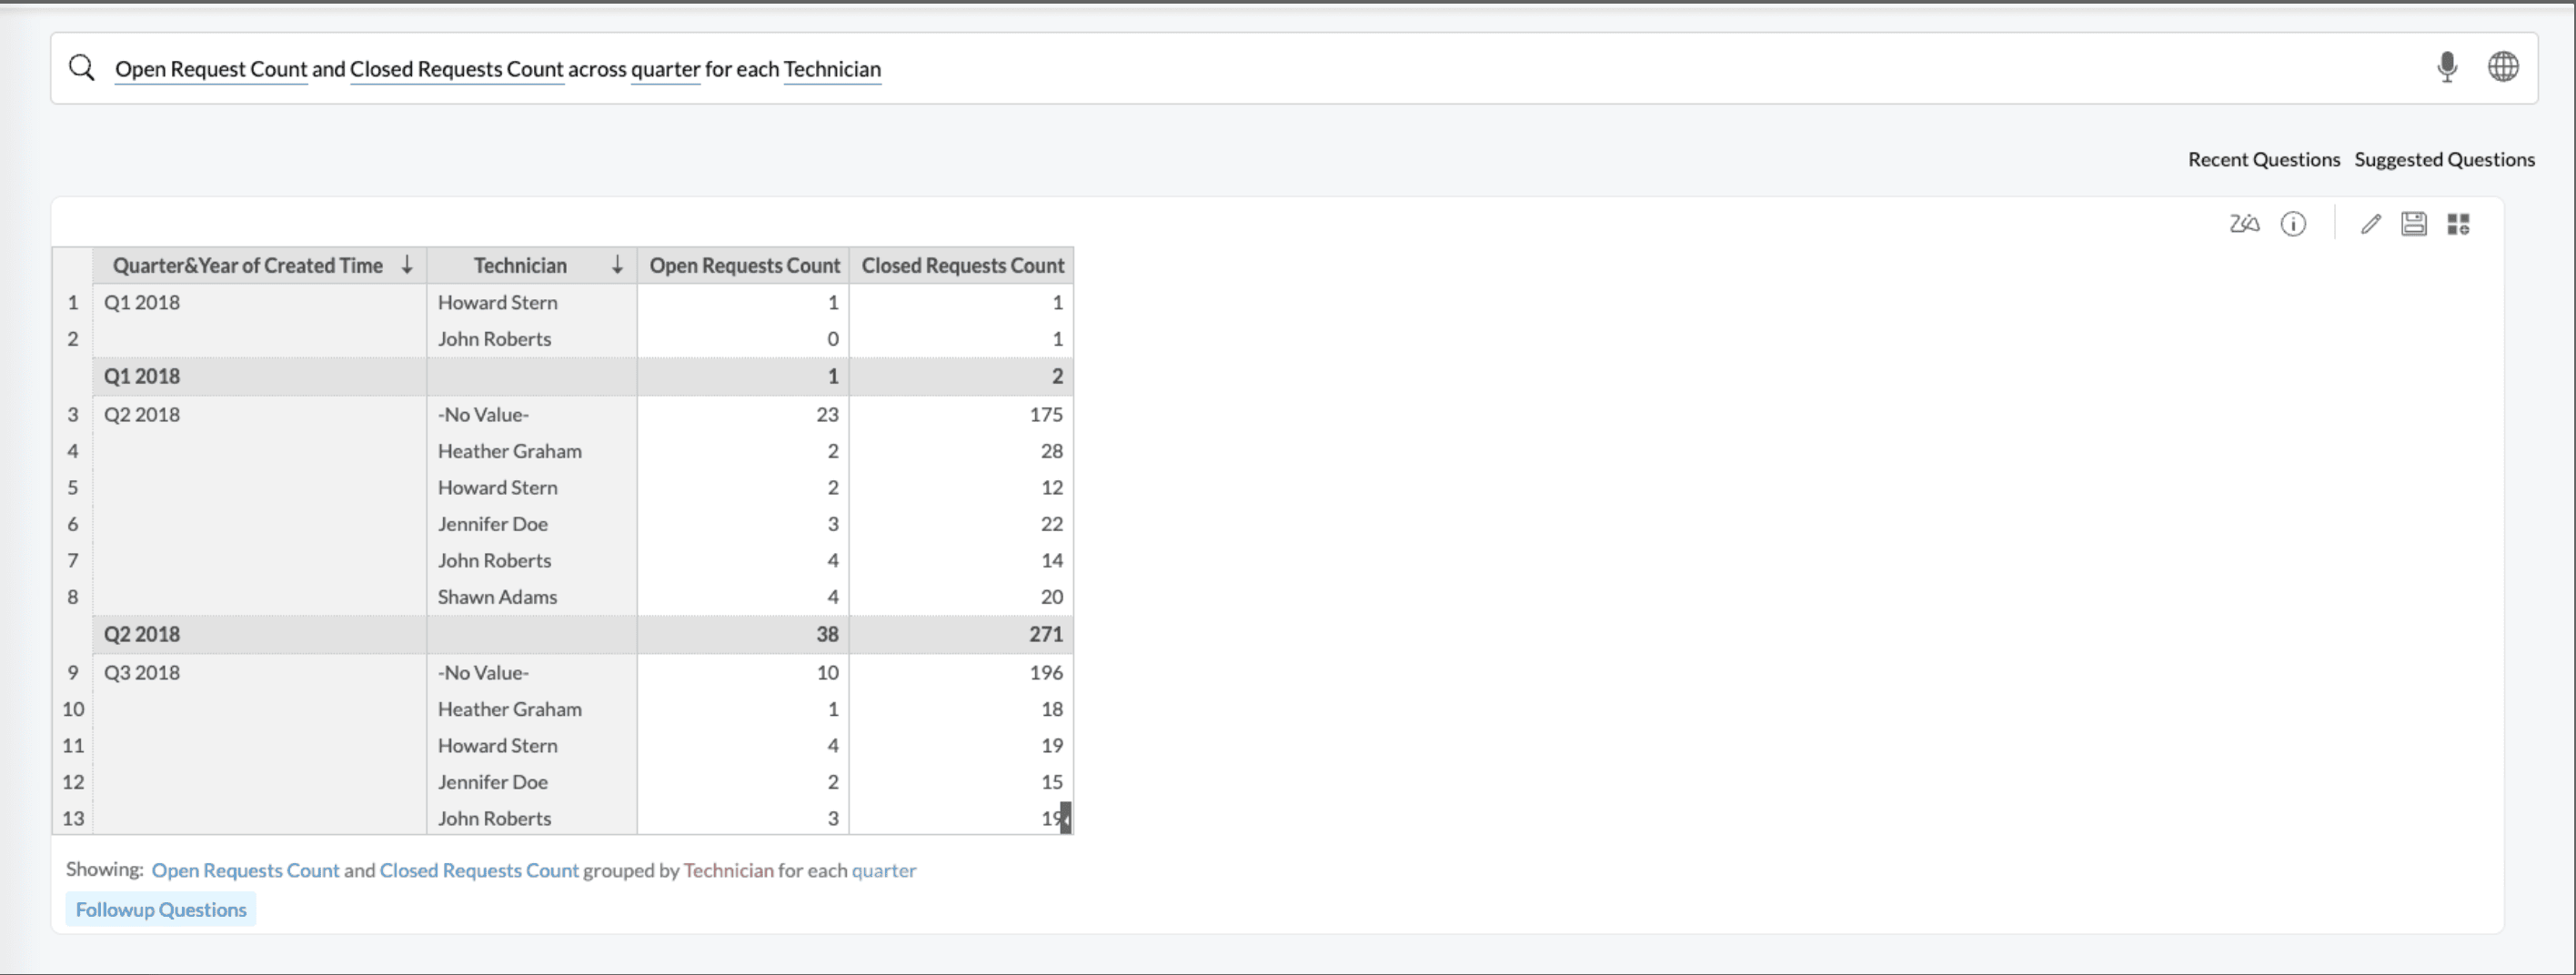
Multiple Metrics by Multiple Dimension
Open Request Count and Closed Request Count across quarter for each Technician
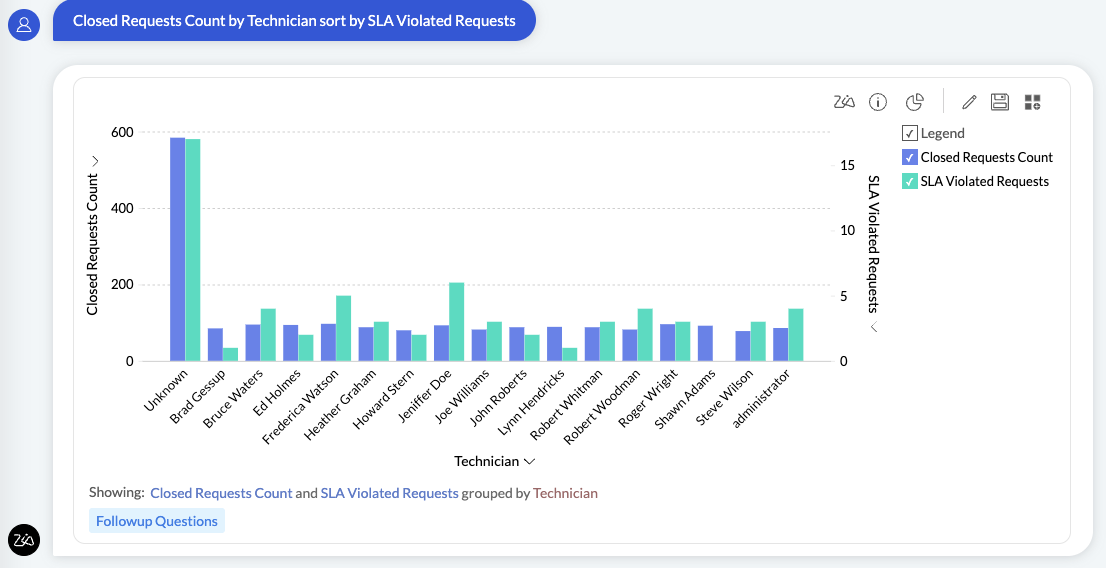
Sort Data
You can sort the report either by the metric column or by the columns used to group the metric. In the following example, the Closed Requests report is sorted by SLA Violated Requests, grouped by technician.
Keywords for Ask Zia
The following is the list of keywords that Ask Zia can interpret and create appropriate insights.
Summary Options | |
Functions | Keywords |
Summary | sum, total, tot |
Minimum | minimum, min |
Maximum | maximum, max, highest, high |
Count | count, number, no, total number, distinct count, unique, unique count |
Others | standard deviation, std dev, variance |
Advanced Summary Options | |
Functions | Keywords |
Running Total | running total, running tot., running sum |
Percentage of | percentage, total percentage, %, percent, percentage of total, total %, % of total, pct of total, % of sum, sum percentage, sum pct, contribution, contribution of total |
Difference From | difference, difference from, diff, growth |
% of Difference From | % of difference, pct of difference, difference %, % diff, difference percentage, difference in percentage, |
% of Previous Value | percentage of previous, % of previous, pct of previous, prev %, previous value % |
Group by Options | |
Functions | Keywords |
Numeric | actual, range, as range, dimension, as dimension |
Date-Actual | year, yearly, year over year, yoy, absyear |
Date-Seasonal | seasonal day, seasonal month, seasonal year, seasonal week, seasonal quarter |
Filtering Options | |
Functions | Keywords |
Numeric | >, >=, greater than, above, over, beyond, higher than, more than, exceeds |
Units and Currency | thousands, k, millions, m, mn, billions, b, bn, Lakhs, L, Crores, C, Rupees, RS, ₹, Dollars, $ |
By Range | top 10, top few, top, top most, highest, best |
Text | starts with, starts with, ends with, contains, is |
Date-Actual | 2018, 2019, Q1 2019, Q4 of 2018, quarter 1 of 2019 |
Date-Seasonal | June, may, Jul, Oct, Sunday, Saturday, Thurs, Tue |
Date-Relative | this year, previous year, last year, past year, recent year, previous 3 years, next 3 years, last 3 year, recent 3 years, last nine years, previous few years, recent few years, past few years, recent few decades, previous few decades, past few decades, next few decades, last few years, last decade, recent decade |
Filter Negation | not, except, excluding, without, neither, other than, ignoring, apart. apart from, ! =, exclude, exceeding |
Sorting Options | |
Functions | Keywords |
Ascending | ascending order, ascending, increasing order, alphabetical order, alphabetical order (a-z) |
Descending | descending, descending order, decreasing order, alphabetical order (z-a) |
By Column | sorted, sort, sort by column |