Threat Intelligence Report — DDI Central
The Threat Intelligence Report in DDI Central provides a detailed view of DNS-layer threats, flagged and scored in real time through integrated threat feeds. Admins can view, interpret, and export this report as a PDF for audit, response, and compliance purposes.
To access the reports, go to Threat Intel-> Reports. Admins can customize the time windows and export the whole overview stats as CSV file or a PDF file.
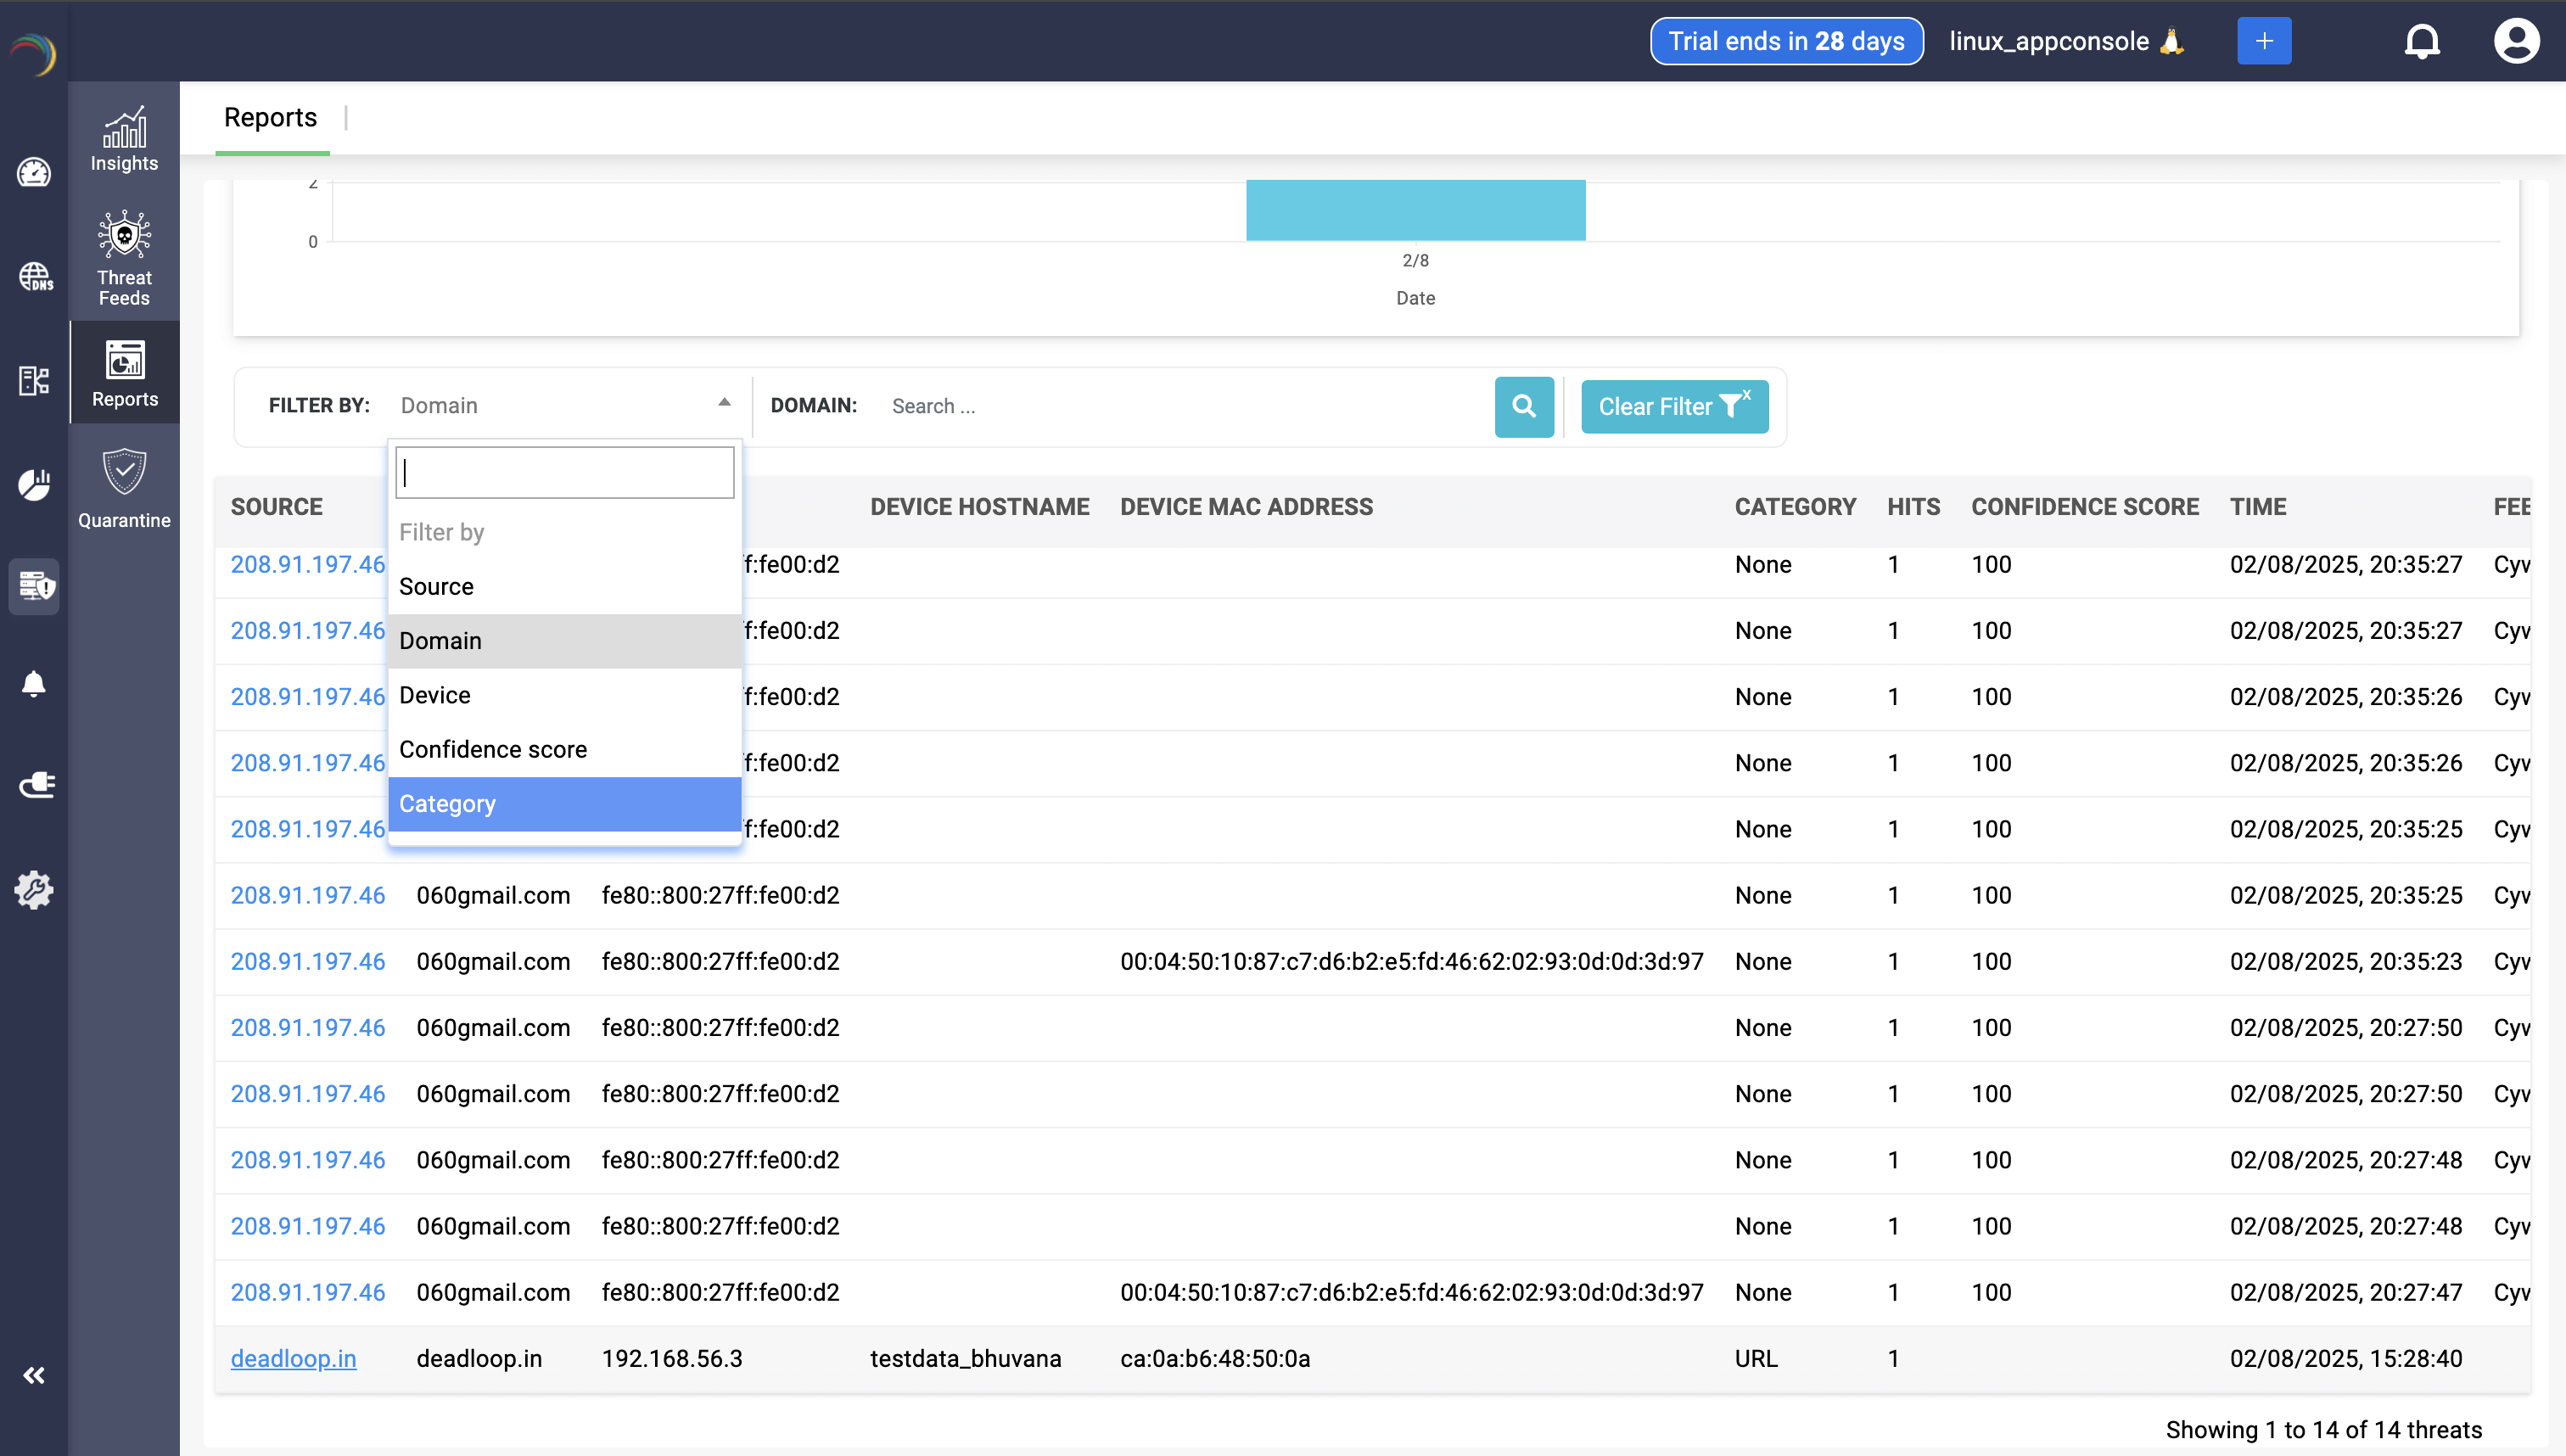
In the Threat Intelligence → Reports section of DDI Central, admins can further refine their view using multiple filter criteria, as shown in the image. Each filter helps narrow down the list of threats for focused investigation or reporting. Below are the available filter options and their purpose:
Report Filter Criteria
- Source
- Filters threats based on the IP address or domain from which the suspicious traffic originated.
- Useful for identifying top offending external sources.
- Domain
- Filters threats by the fully qualified domain name (FQDN) involved in the query.
- Helps zero in on specific malicious domains (e.g., 060gmail.com, galibdo.ru).
- Device
- Filters by the hostnames or IPs of internal devices affected by threats.
- Useful when tracking compromised endpoints or frequent targets.
- Confidence Score
- Filters results by the severity or confidence rating assigned to the threat (e.g., 75, 90, 100).
- Helps prioritize high-confidence threats.
- Category
- Filters based on the type of threat, such as phishing, detection pattern, malware domain, or "None" (if not categorized).
- Useful for analyzing threat trends by type.
These filters can be combined for layered searching—for instance, filtering all phishing-related threats with a score above 90 from a specific domain. This guided filtering supports faster forensic analysis and better response coordination.
Then, DDI Central Presents the refined reports for the chosen aspect of your infrastructure.

Header Summary
- Report Name: Displays the queried threat domain or entity (e.g., galibdo.ru).
- Date Range Picker: Allows admins to filter the report data by a custom time range.
- Export Option: Lets users download a PDF of the report for archiving or sharing.
Overview Metrics (Top Banner)
- Category: Classifies the type of threat (e.g., URL, IP, Domain).
- Hits: Total number of times this domain/entity was queried across the network.
- Confidence Score:Numerical reputation score assigned by the threat feed vendor.
- Last Updated: Timestamp of the most recent threat feed update received.
- Feed Server: The source of the threat intelligence (e.g., Kaspersky, Cyware, etc.).
Confidence Score History
- A time-series graph showing how the threat’s confidence score has changed over time.
- Allows admins to assess if a domain was previously benign but recently flagged as malicious.
- Useful for retrospective investigations and timeline-based analysis.

Top Threats
- Table View: Lists all related subdomains or sub-threats under the queried threat (e.g., sub1.galibdo.ru, sub6.galibdo.ru) with individual hit counts.
- Pie Chart: Visually segments threat distribution to identify dominant subdomains involved in the attack.
Top Affected Hosts
- Table: Lists IP addresses of internal hosts that attempted to access the malicious domain, ranked by hit volume.
- Pie Chart: Visualizes the share of threat queries originating from each host, helping isolate infected or misbehaving devices.
Threat Source Analysis
- Highlights the origin of threats by domain (e.g., vk.com, raveh.ru) based on threat feed metadata.
- Aids in understanding whether threats are linked to phishing campaigns, C2 servers, or malware distribution.
Threat Category Breakdown
- Table + Chart: Groups threats by their classification tags like “Detection Pattern,” “Phishing URL Watchlist,” or “Exploit Redirects.”
- Reveals what kind of tactics or threat behaviors are being blocked most often in the environment.
Threat Severity insights (Confidence Score)
- Critical (90—100): Most dangerous, typically auto-quarantined.
- High (75—90): Suspicious and worth investigating.
- Medium (50—75): Often low-priority or emerging threats.
- Pie charts and hit tables show how threat severity is distributed across the attack surface.
Top 5 Threats by Record Type

This section highlights which DNS record types were most frequently associated with threats during the observed period.
Table (Left Panel):- Column 1 — RECORD: Displays the DNS record type.
- Column 2 — HIT: Indicates the total number of threat hits observed against that record type.
- The donut plot on the right visually represents the distribution of threats by DNS record type.
- This visual summary helps admins instantly identify the dominant record type tied to threats, making it easier to correlate risk patterns and decide whether to tighten DNS-level policies for specific record types.
This report equips network administrators with the contextual data needed to:
- Detect early indicators of compromise.
- Pinpoint vulnerable hosts.
- Justify quarantine actions via confidence scores.
- Refine DNS-level protection strategies.