Trusted by over 5000+ businesses

Saint Gobain
NASA
Time Warner Cable
Loreal Paris
Siemens
DHL

Servers and their dependencies- monitored seamlessly, visualized clearly

Gain the full picture without complexity- just better outcomes, faster troubleshooting, and smarter IT decisions.


Understand the big picture

Instead of siloed alerts, get unified IT-layer visibility that untangles every server slowdown- enabling quicker, coordinated responses and smarter infrastructure decisions.


Deliver uninterrupted digital presence

Infrastructure-level server monitoring tracks all impact metrics- ensuring service continuity, minimizing downtime, and boosting user experience.


Reduce alert fatigue

Too many alerts hide real issues. Correlate with application, traffic, and storage insights to zero in on what matters.


Enable proactive, coordinated IT operations

Visibility and clarity from unified infrastructure insights empower IT teams to coordinate faster and drive efficient operations.


Achieve cost efficiency at scale

Unified monitoring reduces tool sprawl, slashes downtime, and minimizes manual intervention. The result - a healthier infrastructure that’s also easier on the budget.


Leaner, more effective IT teams

When alerts make sense and priorities are clear, teams can trigger workflows, automate responses, and focus on strategic work- boosting productivity and simplifying IT management.

Server Monitoring


Server monitoring safeguards application delivery, user experience, and backend stability. It’s the backbone of modern IT management, enabling fast issue detection and prevention before damage is done.


Infrastructure-wide server monitoring

OpManager Plus monitors virtual machines across platforms like VMware and Hyper-V, delivering real-time performance insights and proactive alerts for smarter resource management across your infrastructure.


Performance Monitoring

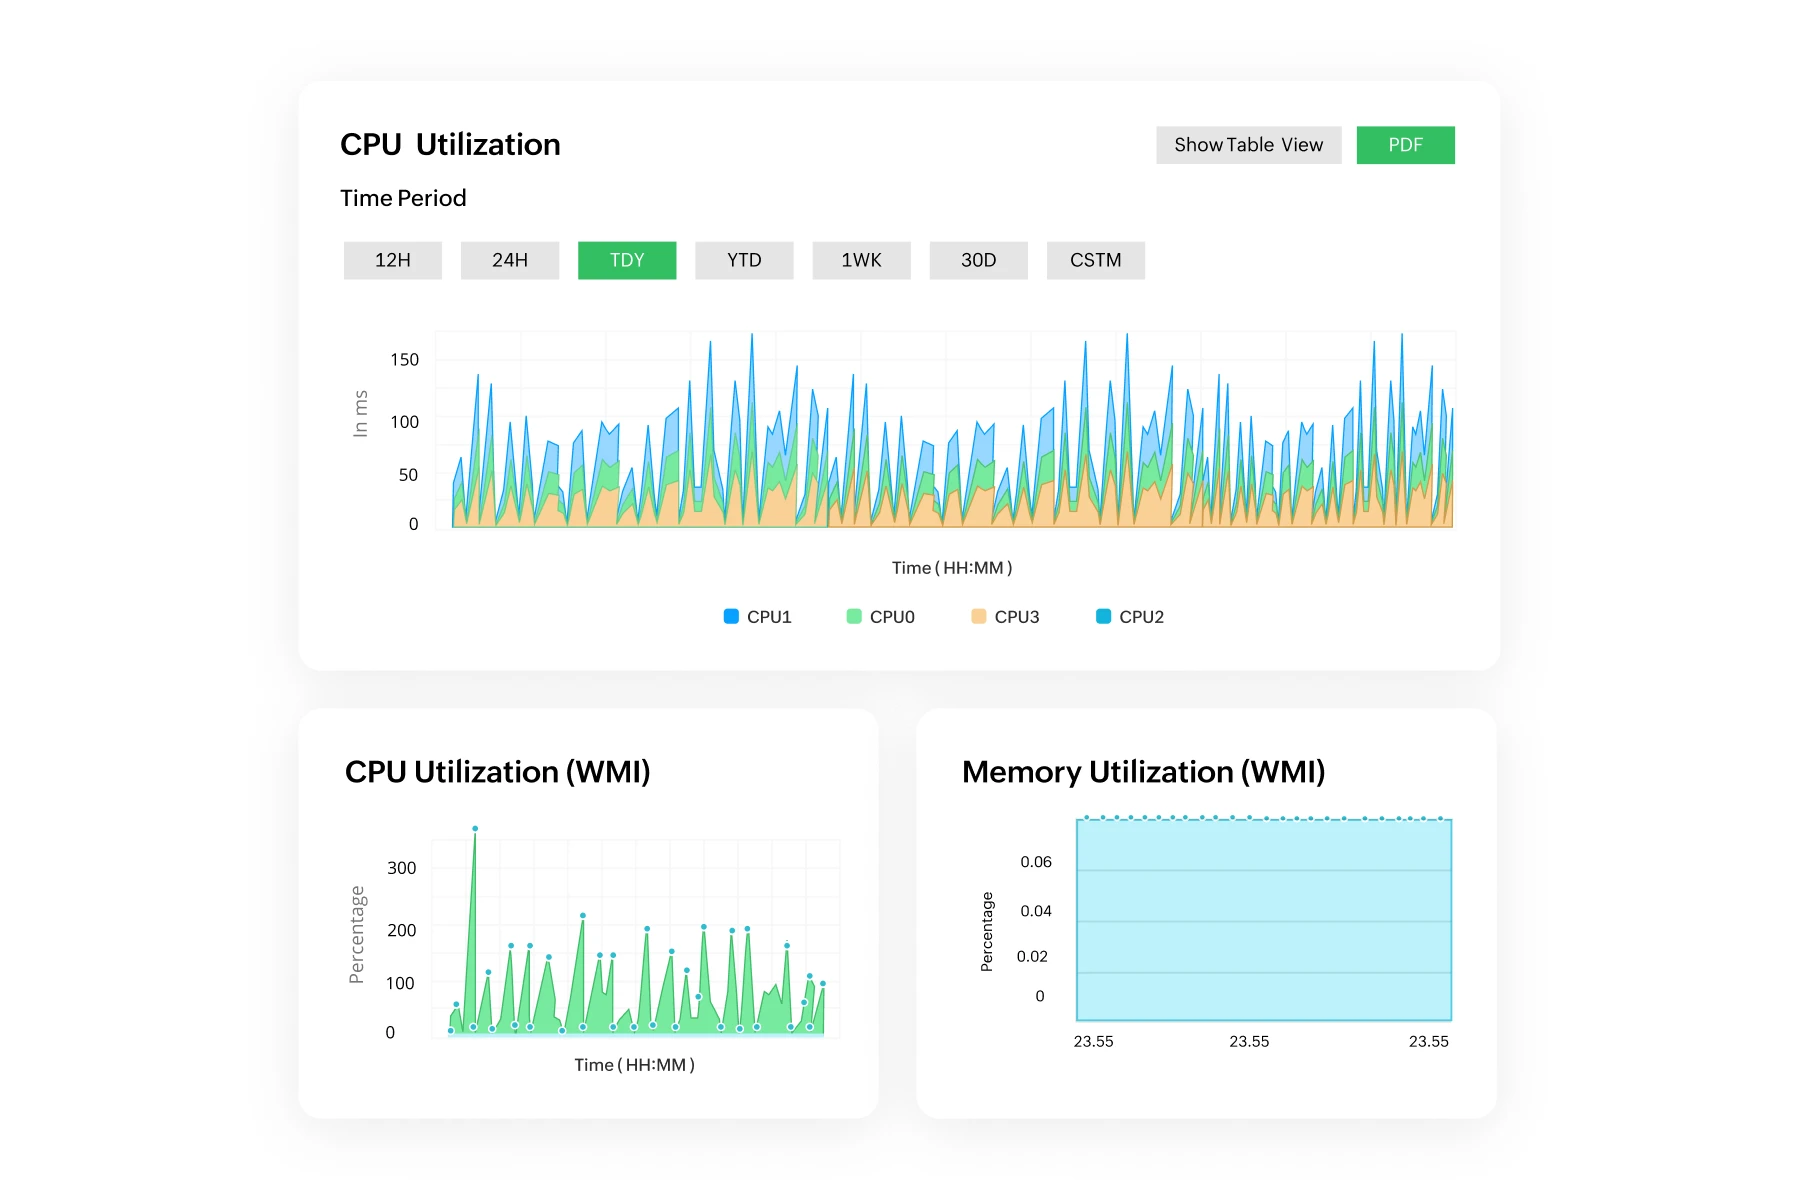
With vendor-aware metrics and three-tiered alarms, OpManager Plus translates server data into clarity across CPU, memory, disk, and more


Process & Services monitoring

Monitor all active services and processes with OpManager Plus. Receive outage alerts and automate restarts remotely to ensure seamless server performance and uptime.


Log monitoring

Track server health via event logs, syslogs, and application logs. OpManager Plus uses rule-based alerts and presets for Exchange, IIS, SQL, and ISA servers.

Ensure 24/7 server uptime

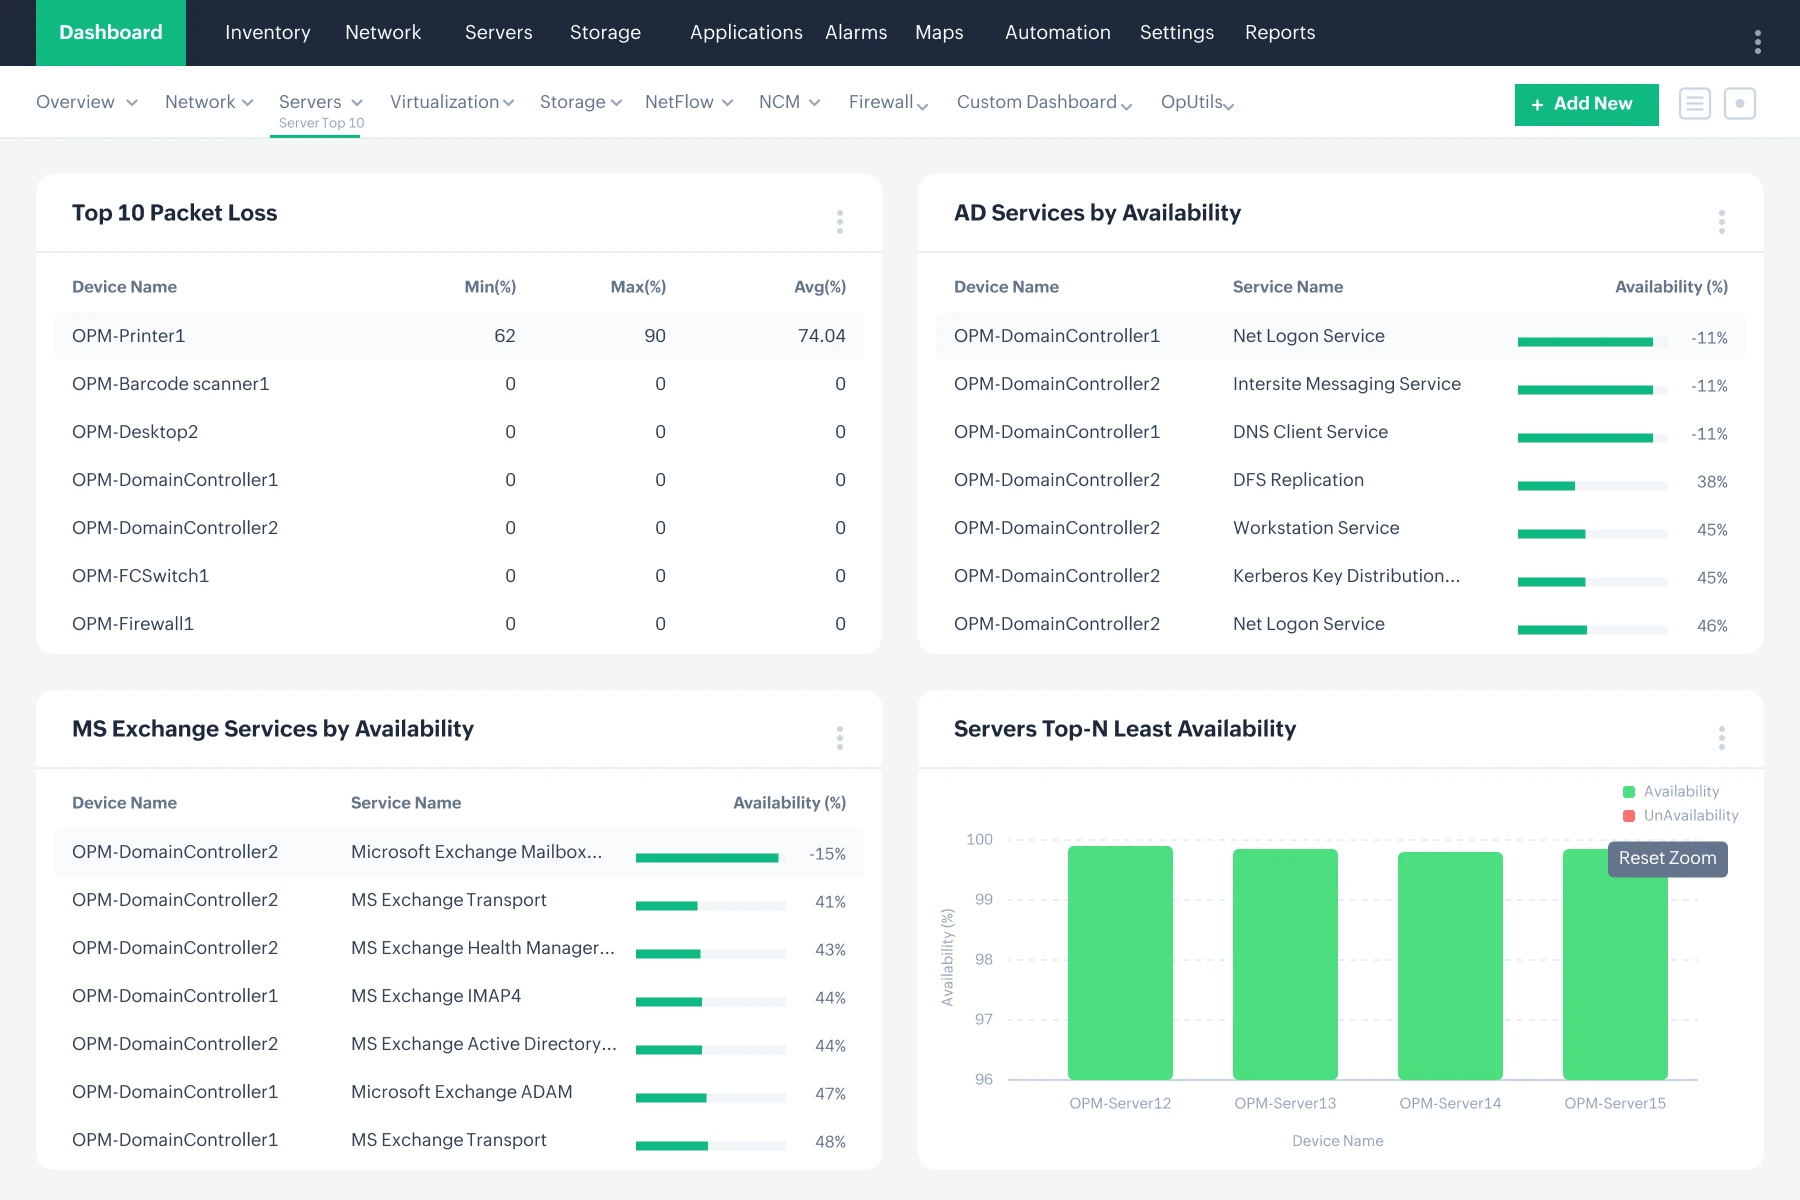
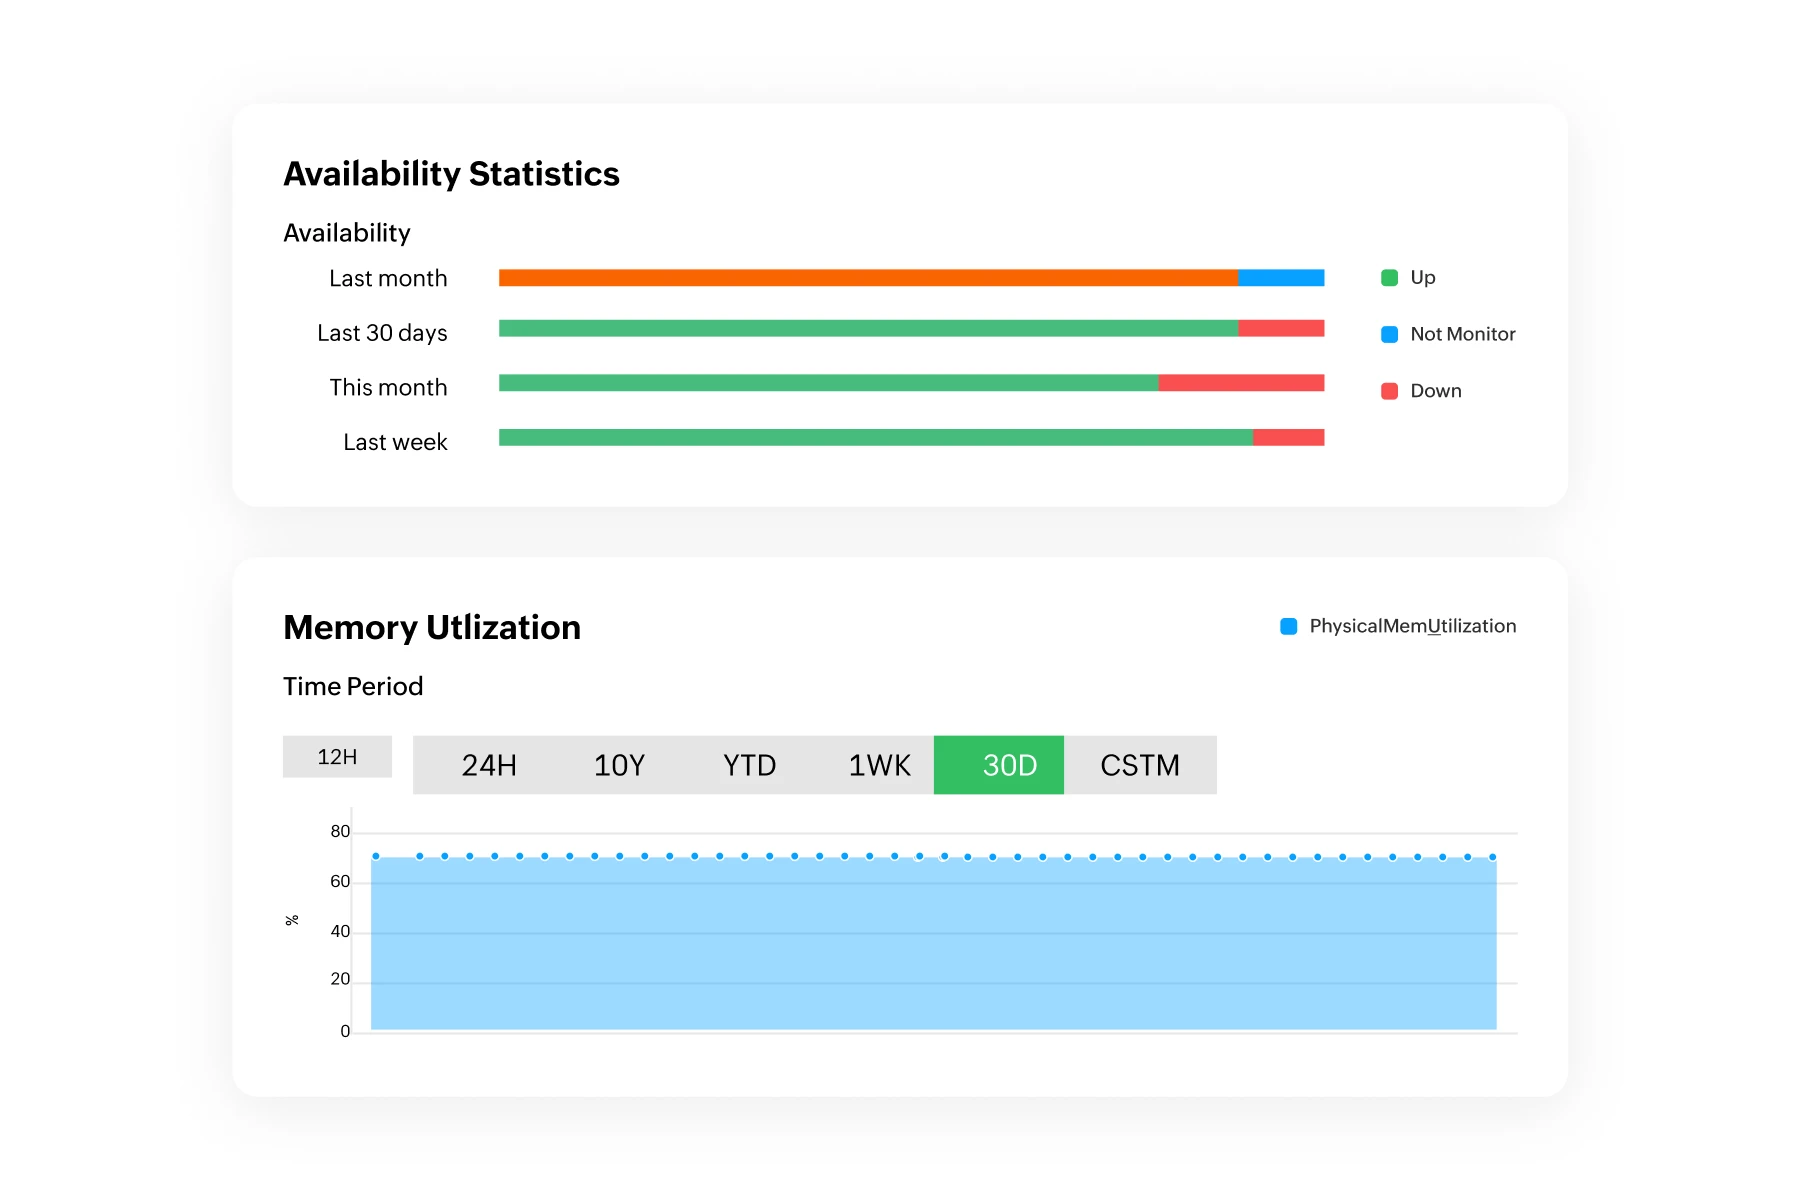
  • Monitor server uptime continuously with ICMP, SNMP, TCP, and WMI—configurable for your environment’s needs.
  • Alarms trigger on downtime or network slowness, so admins can act fast and keep services running.
  • Real-time tracking of packet loss and latency flags potential performance issues early.
  • Built-in dashboards expose repair times and hardware stability through clear MTTR and MTBF metrics.
  • Analyze historical uptime to detect recurring problems and plan strategic infrastructure upgrades.
Troubleshoot network downtime with OpManager's toolkit
Restore down services with advanced automation

Unified server monitoring across vendors/entities

  • Track physical servers from Dell, HP, and IBM, and virtual hosts on VMware, Hyper‑V, Nutanix, or Xen- all from a singleOpManager Plus dashboard.
  • Monitor domain controller services and resources in real time, triggering instant alerts when critical metrics degrade.
  • Manage remote IPMI devices over SNMP or Redfish and view hardware status as intuitive graphs within the same console.
  • Export granular IPMI health data for trend analysis and capacity planning across your hybrid environment.
  • Automate remediation- restart services, run scripts, or create tickets- so recurring server issues are resolved instantly, without manual intervention.

Monitor all server and OS types

  • Monitor all server roles- mail, database, application- plus Windows and Linux hosts from a single OpManager Plus console for unified visibility across your environment.
  • Poll Windows servers via WMI and Linux hosts via Telnet or SSH- covering Windows NT to 2019 and major distros like RHEL, Ubuntu, SUSE, and CentOS.
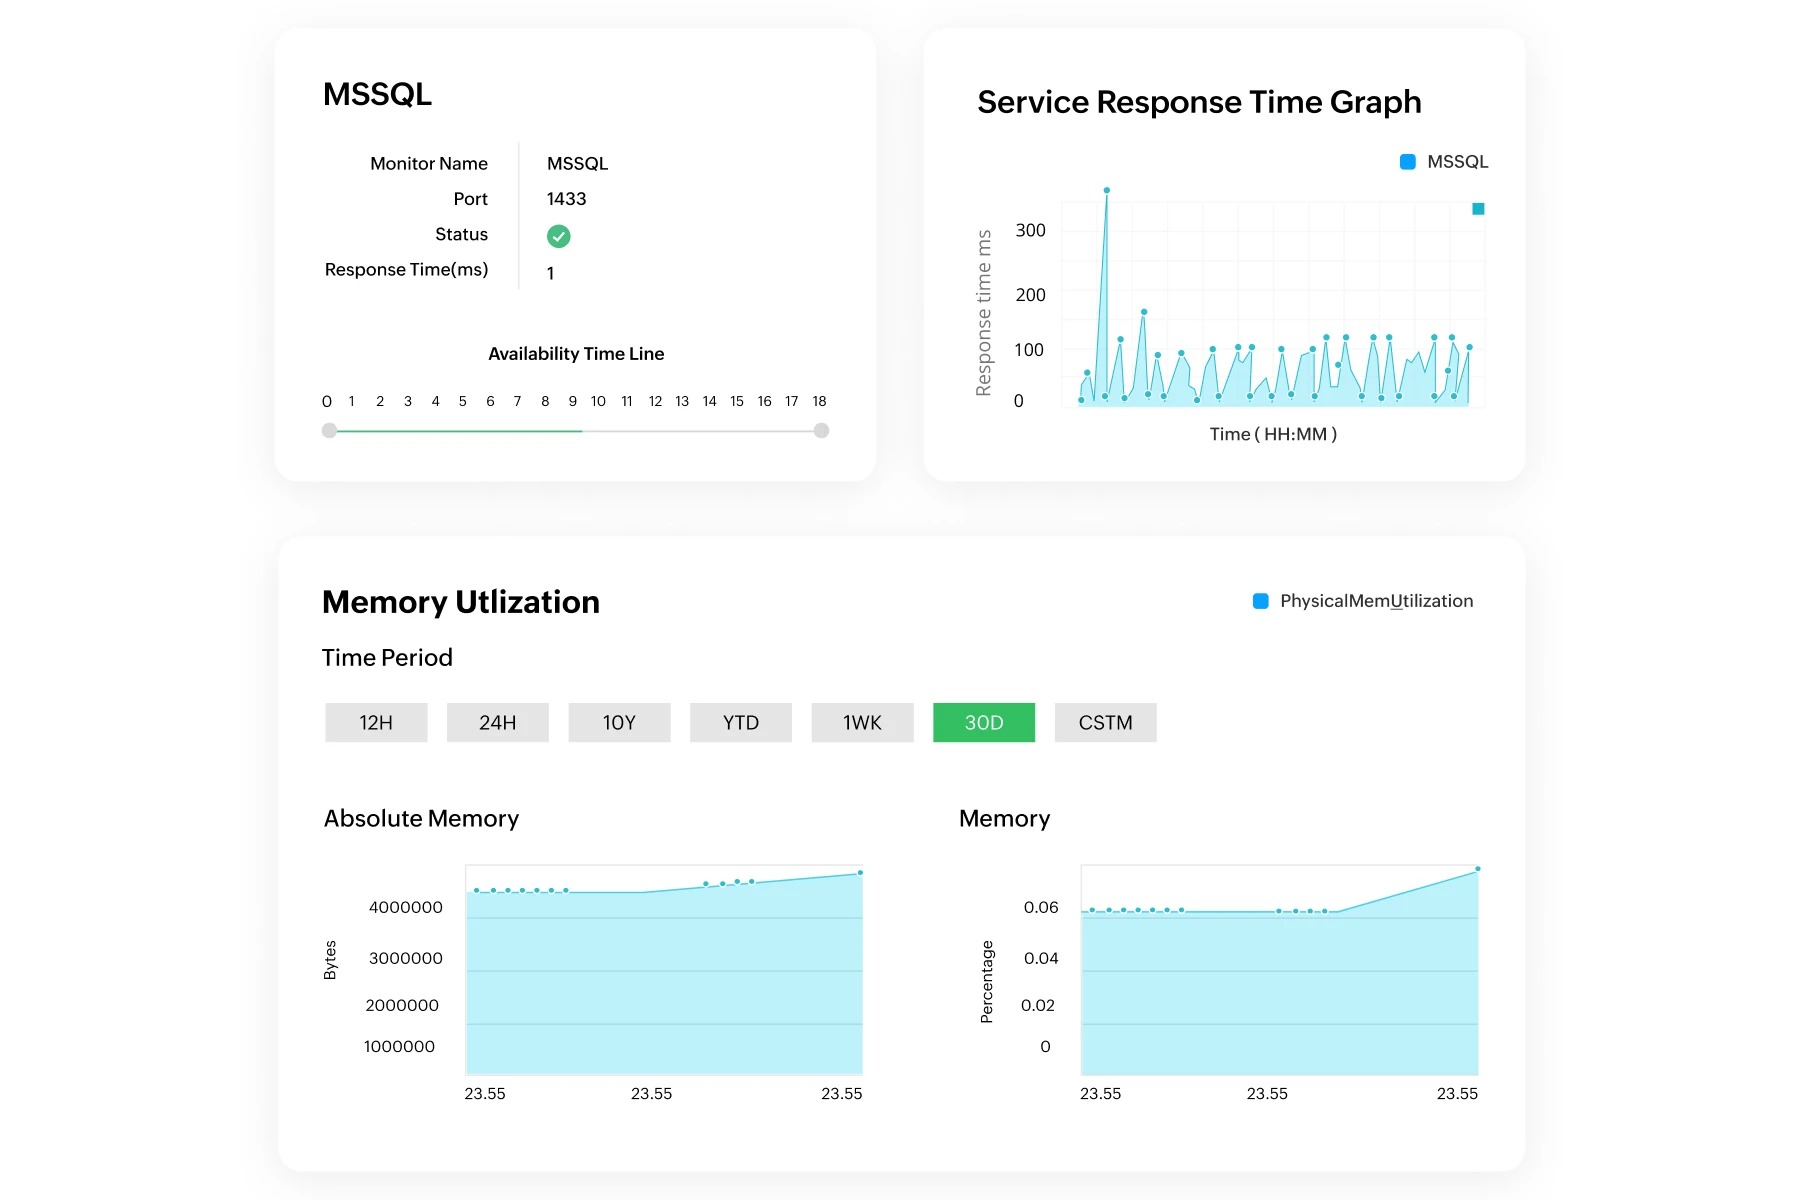
  • Track 50+ MSSQL metrics including locks, cache hits, memory, and services with preset thresholds to detect issues before they impact performance.
  • Protect Exchange environments (2000–2019) by spotting mail storms early and maintaining healthy mailbox, queue, and storage utilization.
  • Correlate OS-level and application insights- CPU, memory, services- to identify root causes quickly and ensure continuous service availability.
Never miss an uptime status update with network operations center views
Track network uptime and performance with real-time metrics

Contextual monitoring and visualization

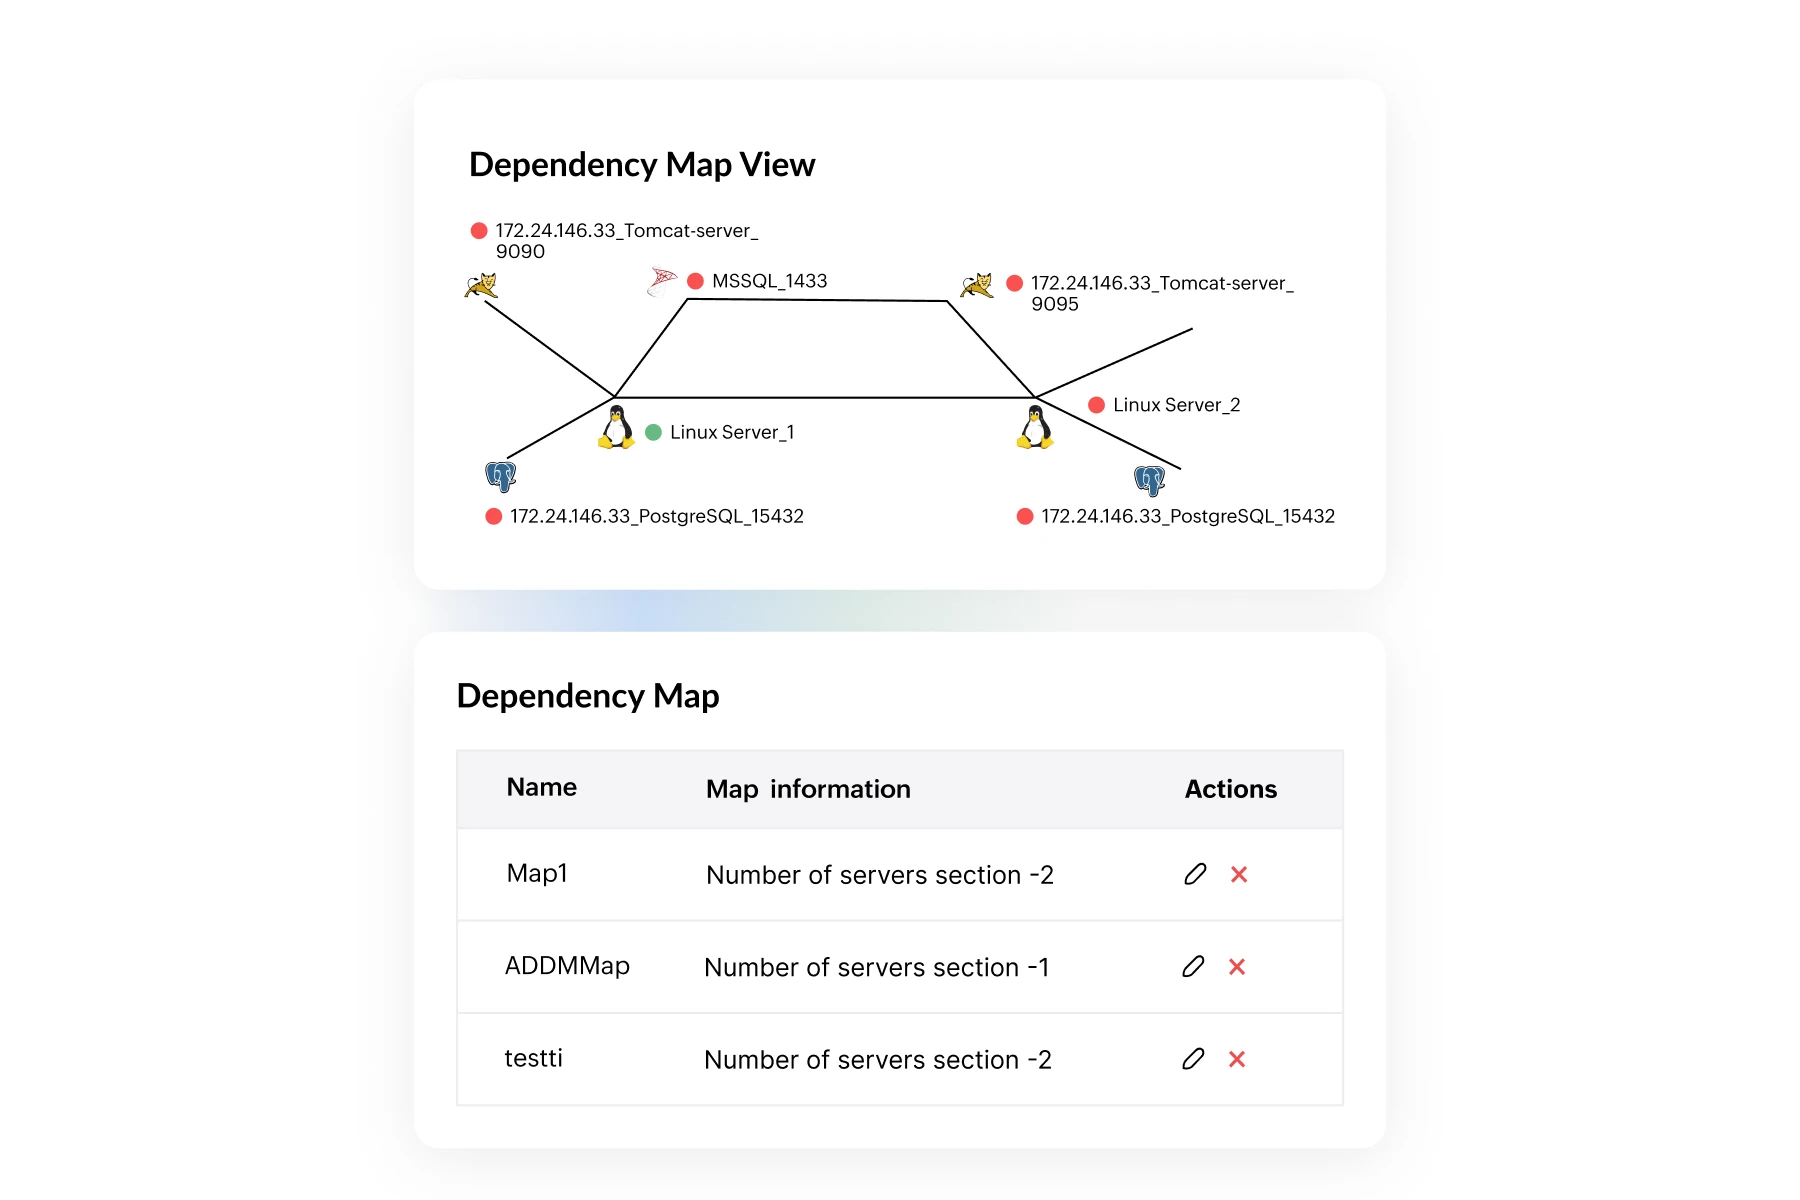
  • OpManager Plus monitors not just server metrics, but their connections to apps, users, storage, and network components.
  • By identifying faulty dependencies, IT teams resolve issues faster—with less guesswork.
  • Visual infrastructure maps show server relationships clearly, helping teams act on what's critical to uptime and business continuity.
  • Smarter correlations enable faster triage, SLA compliance, and reduced resolution times—even in complex environments.

From alert to action- smarter server monitoring

  • OpManager Plus ties server slowdowns to upstream or downstream issues- apps, traffic, or storage- so you fix what matters.
  • Visual maps of dependencies help teams identify service-impacting failures, not just isolated metrics.
  • Intelligent correlation suppresses redundant alerts and links symptoms to causes for faster triage.
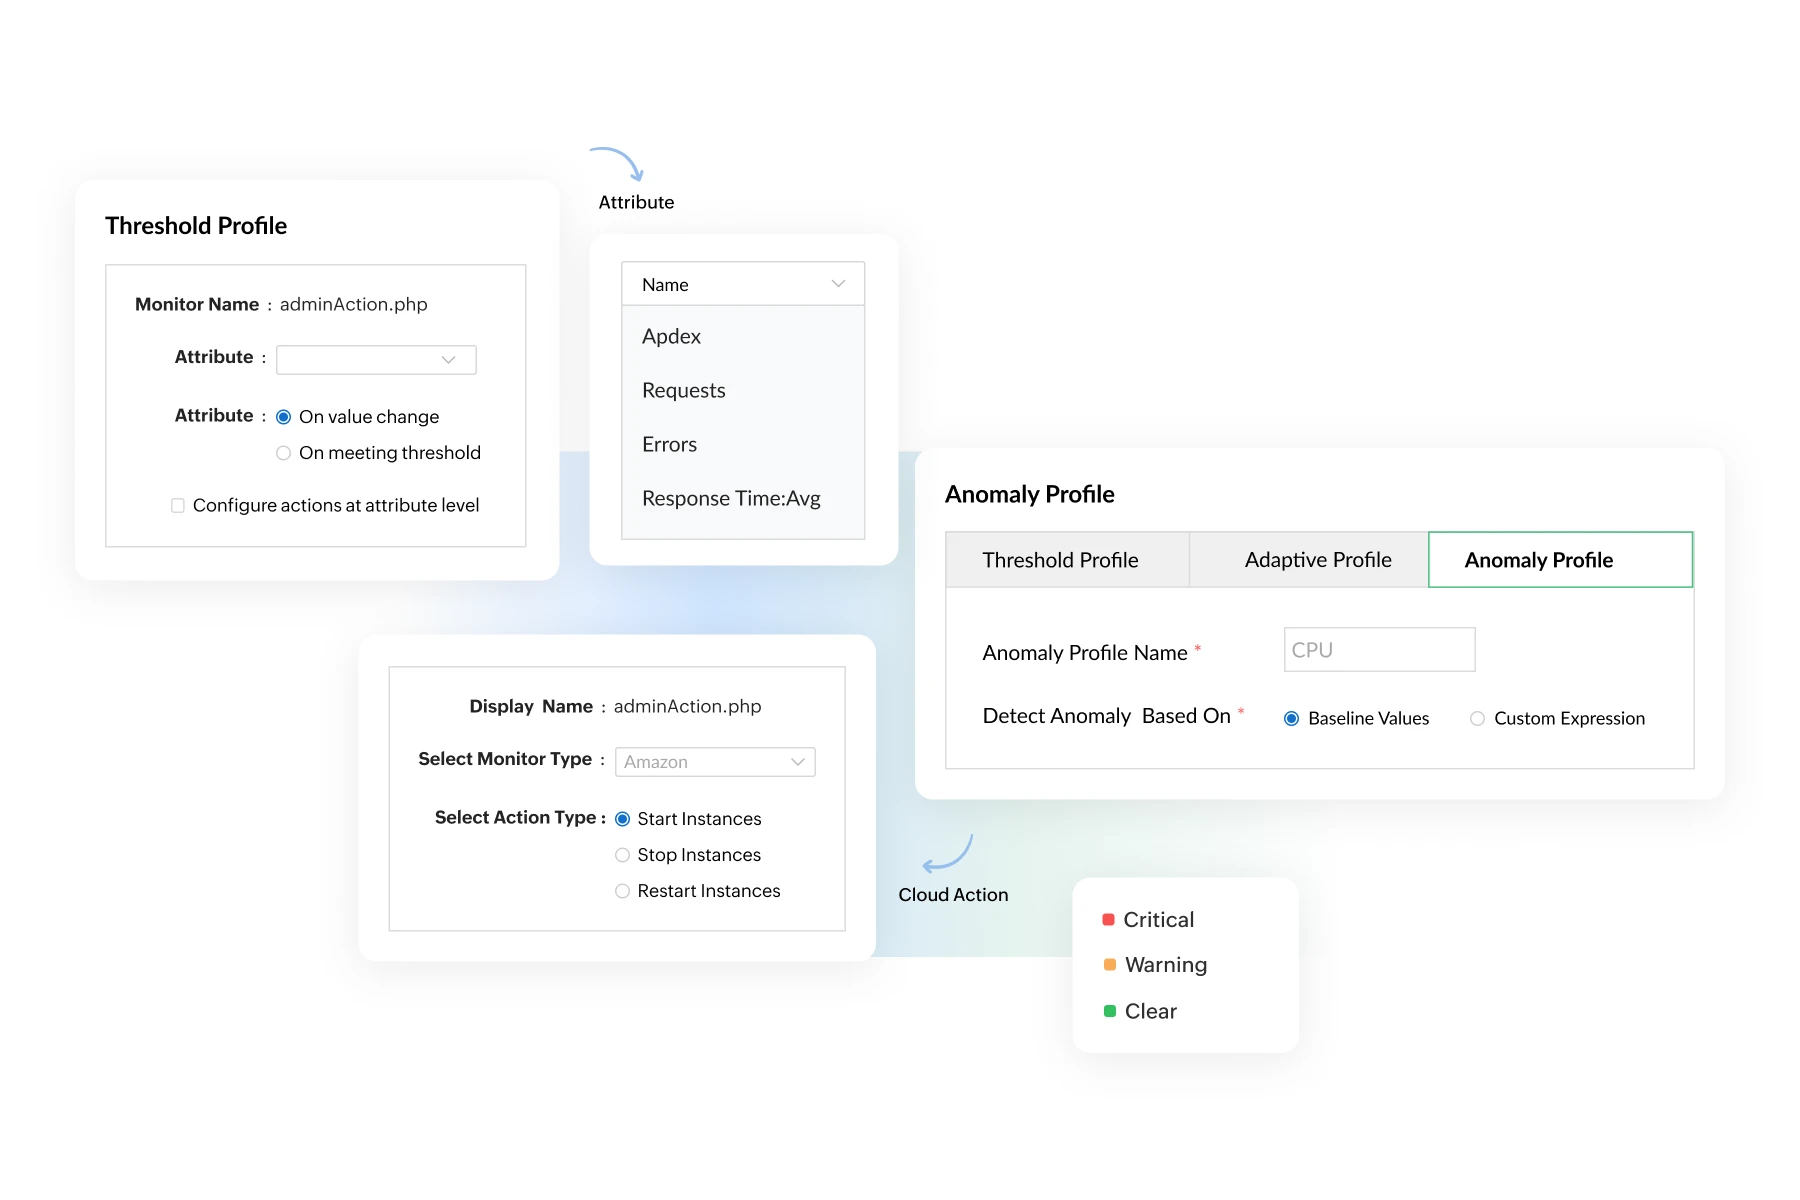
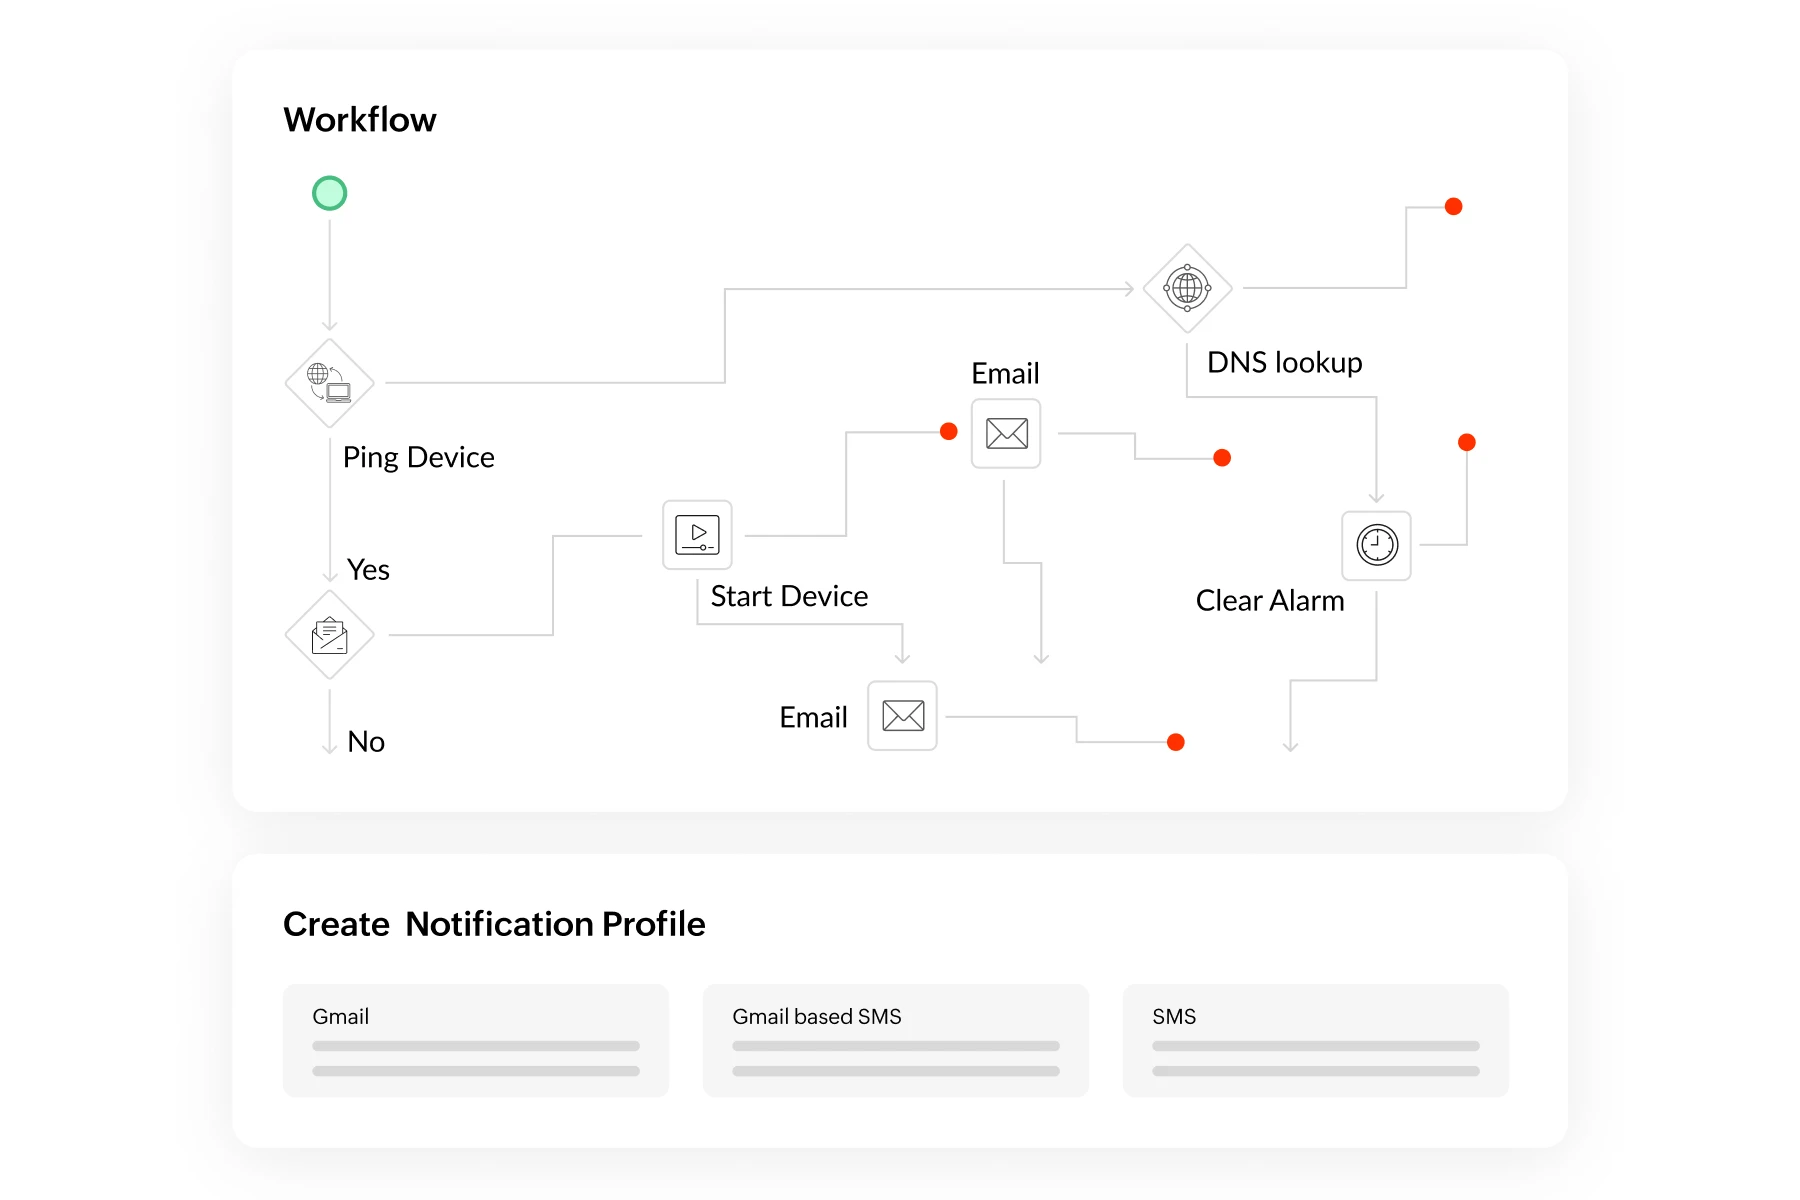
  • Automate responses to known issues using predefined workflows—restart services, execute scripts, or escalate instantly.
  • Dynamic thresholds adapt to real-time and historical trends, ensuring accurate alerts and proactive monitoring.
Track network uptime and performance with real-time metrics

Full-stack observability with OpManager Plus

OpManager Plus helps you monitor and manage the entire IT stack from a single console. With extensive logs, in-depth metrics, and end-to-end traces, you can detect and resolve any issue in any part of the IT stack in no time. IT teams can replace multiple siloed IT tools with a unified IT management interface to improve correlation, minimize complexity, and reduce licensing spend.

Loved by customers all over the world


“Easy Implementation, Excellent support & Lower Cost Tool - Team Lead, IT Services Industry”

Reviewer Role: Infrastructure and Operations

Company size: 500M - 1B USD

We have been using OpManager since 2011 and our overall experience has been excellent. The tool plays a vital role in providing the value to our organization and to the customers we are supporting. The support is excellent and staff takes full responsibilities in resolving the issues. Innovation is never stopping and clearly visible with newer versions.

“OpManager - 10 steps ahead of the competition, one step away from being unequaled - Network Services Manager, Government Organization”

Reviewer Role: Infrastructure and Operations

Company size: 5,000 - 50,000 Employees

I have a long standing relationship with ManageEngine. OpManager has always missed one or two features that would make it truly the best tool on the market, but over it is the most comprehensive and easy to use the product on the market.

“Easy Implementation with a feature rich catalogue, support has some room for improvement - NOC Manager, IT Services Industry”

Reviewer Role: Program and Portfolio Management

Company size: 500M - 1B USD

The vendor has been supportive during the implementation & POC phases providing trial licenses. Feature requests and feedbacks is usually acted upon swiftly. There was sufficient vendor support during the implementation phase. After deployment, the support is more than adequate, where the vendor could make some improvements.

“Great Monitoring tool - CIO in Finance Industry”

Reviewer Role: CIO

Company size: 1B - 3B USD

ManageEngine provides a suite of tools that have made improvements to the availability of our internal applications. From monitoring, management and alerting, we have been able to peak performance within our data center.

“Simple Implementation, Easy To Use. Very Intuitive. - Principle Engineer in IT Services”

Reviewer Role: Enterprise Architecture and Technology Innovation

Company size: 250M - 500M USD


ManageEngine support was responsive to all our queries.

Capterra
Getapp
Software Advice
G2
Altaleb Alshenqiti

“OpManager helps me monitor all aspects of the data-center and equipment like servers, switches and routers. It is fast, intuitive and centralized and you do not need to be an expert to deal with OpManager.”

Altaleb Alshenqiti

NGHA

Donald Stewart

“Donald Stewart, IT Manager of Crest Industries is happy with ManageEngine OpManager for its end-to-end network monitoring software. It is easy-to-use and offers fault and performance management for router.”

Donald Stewart

IT Manager, Crest Industries

John Rosser

“John Rosser, MIS Manager of Yale Chase talks about the proactive nature of ManageEngine OpManager & how his organisation gained value from it.”

John Rosser

MIS Manager

Monitor multi-stack distributed IT infrastructure with a single console

 
Video Zone
OpManager Customer Videos
Michael Senatore, Operations Manager, Rojan Australia Pty Ltd.
  
  •  Venkatesan Veerappan, IT Consultant
     Mohd Jaffer Tawfiq Murtaja, Information Security officer from Al Ain sports club
  •  Jonathan ManageEngine Customer
     IT Admin from "Royal flying doctor service", Australia
  •  Michael Senatore, Operations Manager, Rojan Australia Pty Ltd.
     Michael - Network & Tech, ManageEngine Customer
  •  Altaleb Alshenqiti - Ministry of National Guard - Health Affairs
     Donald Stewart, IT Manager from Crest Industries
  •  John Rosser, MIS Manager - Yale Chase Equipment & Services
     David Tremont, Associate Directory of Infrastructure,USA