Adaptive thresholds for AI-driven monitoring
- Automate performance monitoring
- Reduce false positives and alarm floods
- Get high quality alarms
- Identify performance anomalies with ease
Intelligent alerting for your network performance
Manually configuring alarms for network monitoring involves a constant guessing game of what normal performance looks like. Static alarm limits cannot adapt to seasonal variations: Set them too low and face alert floods during peak hours, or set them too high and miss genuine issues during off-peak times. OpManager’s adaptive thresholds solve this across thousands of devices by automating threshold configuration.
How do adaptive thresholds work?
Machine-learning driven monitoring
OpManager's Zia AI trains on your network data for 14 days to understand your environment. Zia's ML algorithms calculate a baseline for each performance metric. This baseline is recalculated every hour to ensure accuracy.
- Prevent false positives: Avoid misinterpreting normal performance spikes as issues by automatically adjusting thresholds based on historical behavior.
- Detect subtle anomalies: Finding spikes during non-peak hours is difficult when thresholds are set for peak loads. Adaptive thresholds catch such subtle deviations.
Scalability and automation
Automate performance monitoring for your entire infrastructure with a single click. As you scale, the ML engine grows with you: Automatically configuring thresholds for newly commissioned devices.
- Eliminate alert fatigue: Reduce alarms during peak hours, ensuring your team only receives alerts for genuine issues.
- Hands-off administration: Relieve IT staff from manually managing thousands of monitors as your organization expands.
- Self-adapting baselines: As workloads naturally increase over time, the AIOps engine evolves alongside your data without requiring manual recalibration.
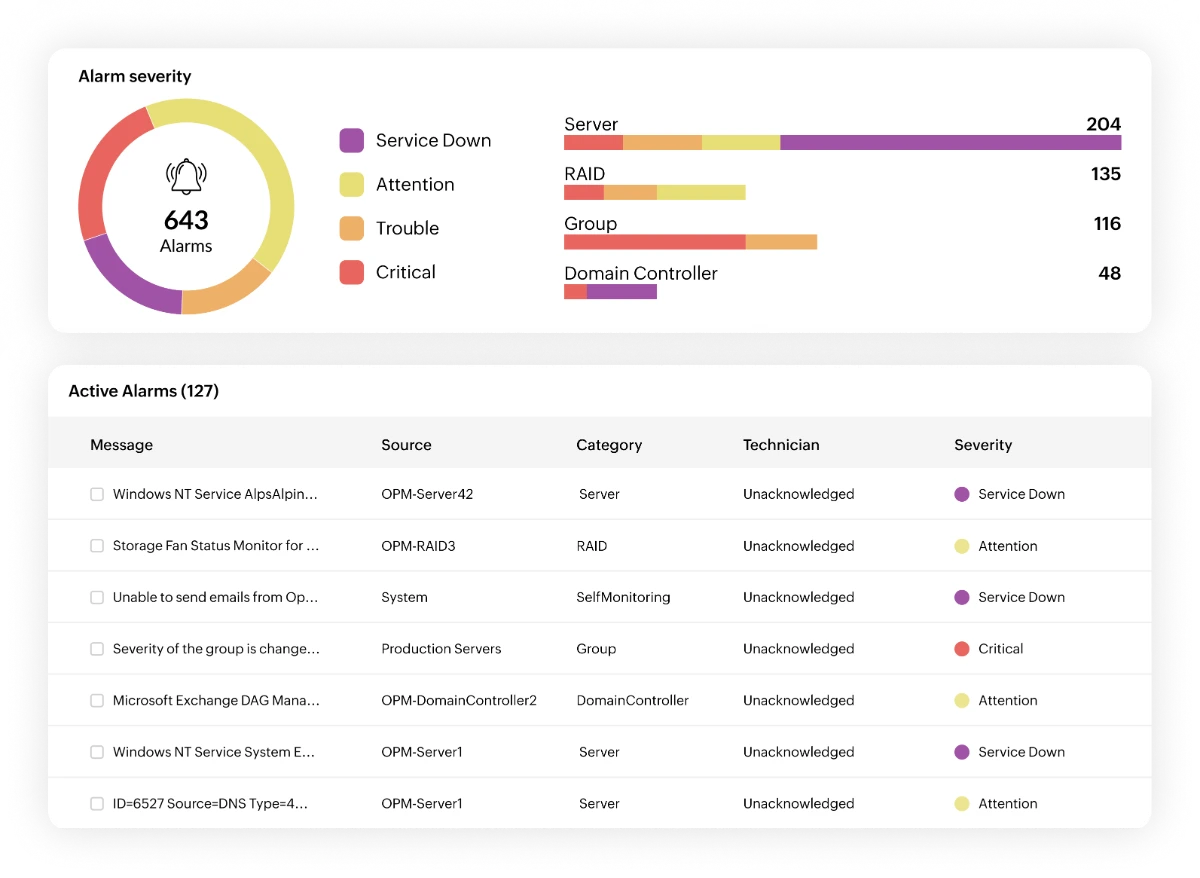
Alarm severity customization
While Zia AI automates the baseline, you retain complete control over alarm urgency and trigger conditions.
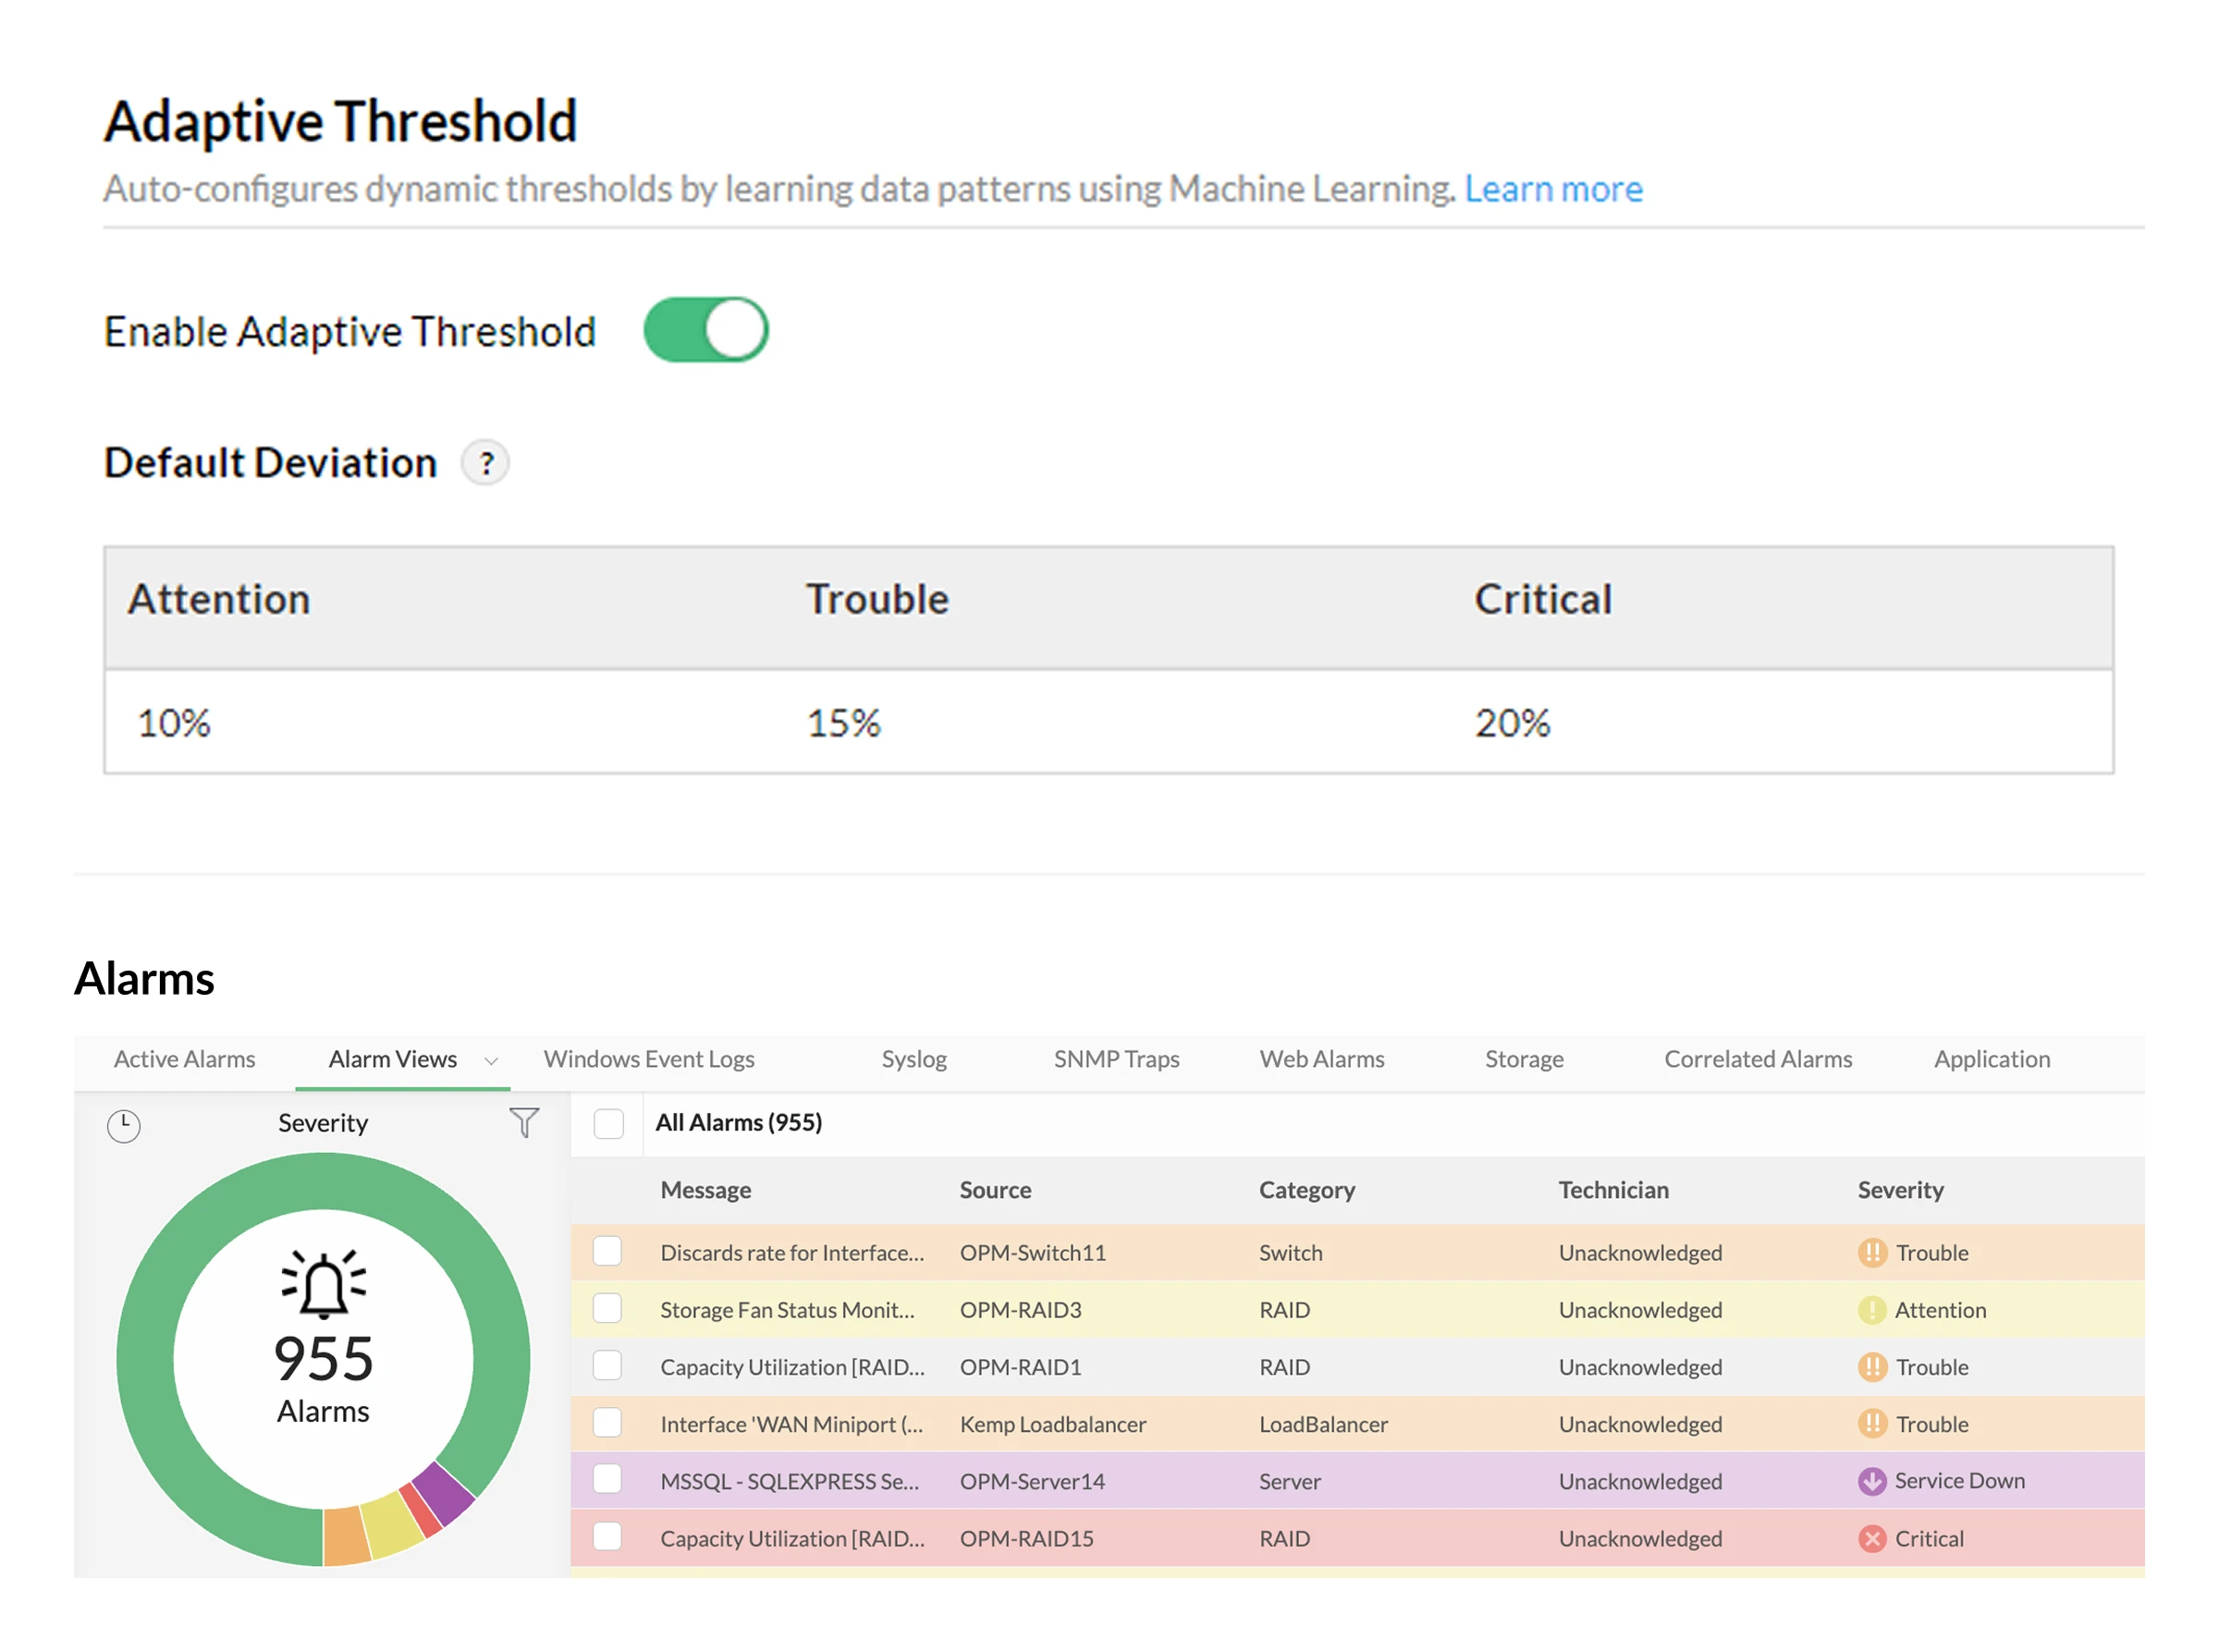
- Alarm severity: Set three levels of deviation values (Attention, Trouble, and Critical) to highlight the severity of an issue. These deviations are added to the baseline to calculate the threshold.
- Suppress limits: Set a value below which alerts are automatically ignored. This is essential for filtering out unnecessary alarms caused by minor, inconsequential fluctuations.
- Static limits: These act as a hard cap. If you set a static limit of 95%, OpManager will always trigger an alert for that value, regardless of the baseline.
You can enable adaptive thresholds for monitored metrics, particular device types, or deploy them in bulk across multiple devices. If you prefer strict manual limits for highly sensitive devices, you can still configure static thresholds.
OpManager supports adaptive thresholds for over 3,000 performance metrics from a diverse set of multi-vendor devices. It's recommended to let OpManager collect data for 14 days before enabling adaptive thresholds to ensure accuracy.
Watch this video to see the configuration steps.
What are the benefits of using adaptive thresholds?
Silence alert fatigue
Reduce false positives during peak hours. Receive fewer, higher-fidelity alerts so your team only responds to genuine threats.
Instant anomaly detection
Detect subtle deviations the second they happen, leveraging a continuously updated baseline of what "normal" actually looks like.
Dynamic seasonal sensitivity
The AI automatically adapts to the rhythm of your network - by the hour or day.
Zero-touch scalability
Eliminate manually tuning thresholds. With one click, apply dynamic, self-updating baselines across thousands of devices and metrics simultaneously.
Adaptive thresholds in practical usage-scenarios

Anomaly detection
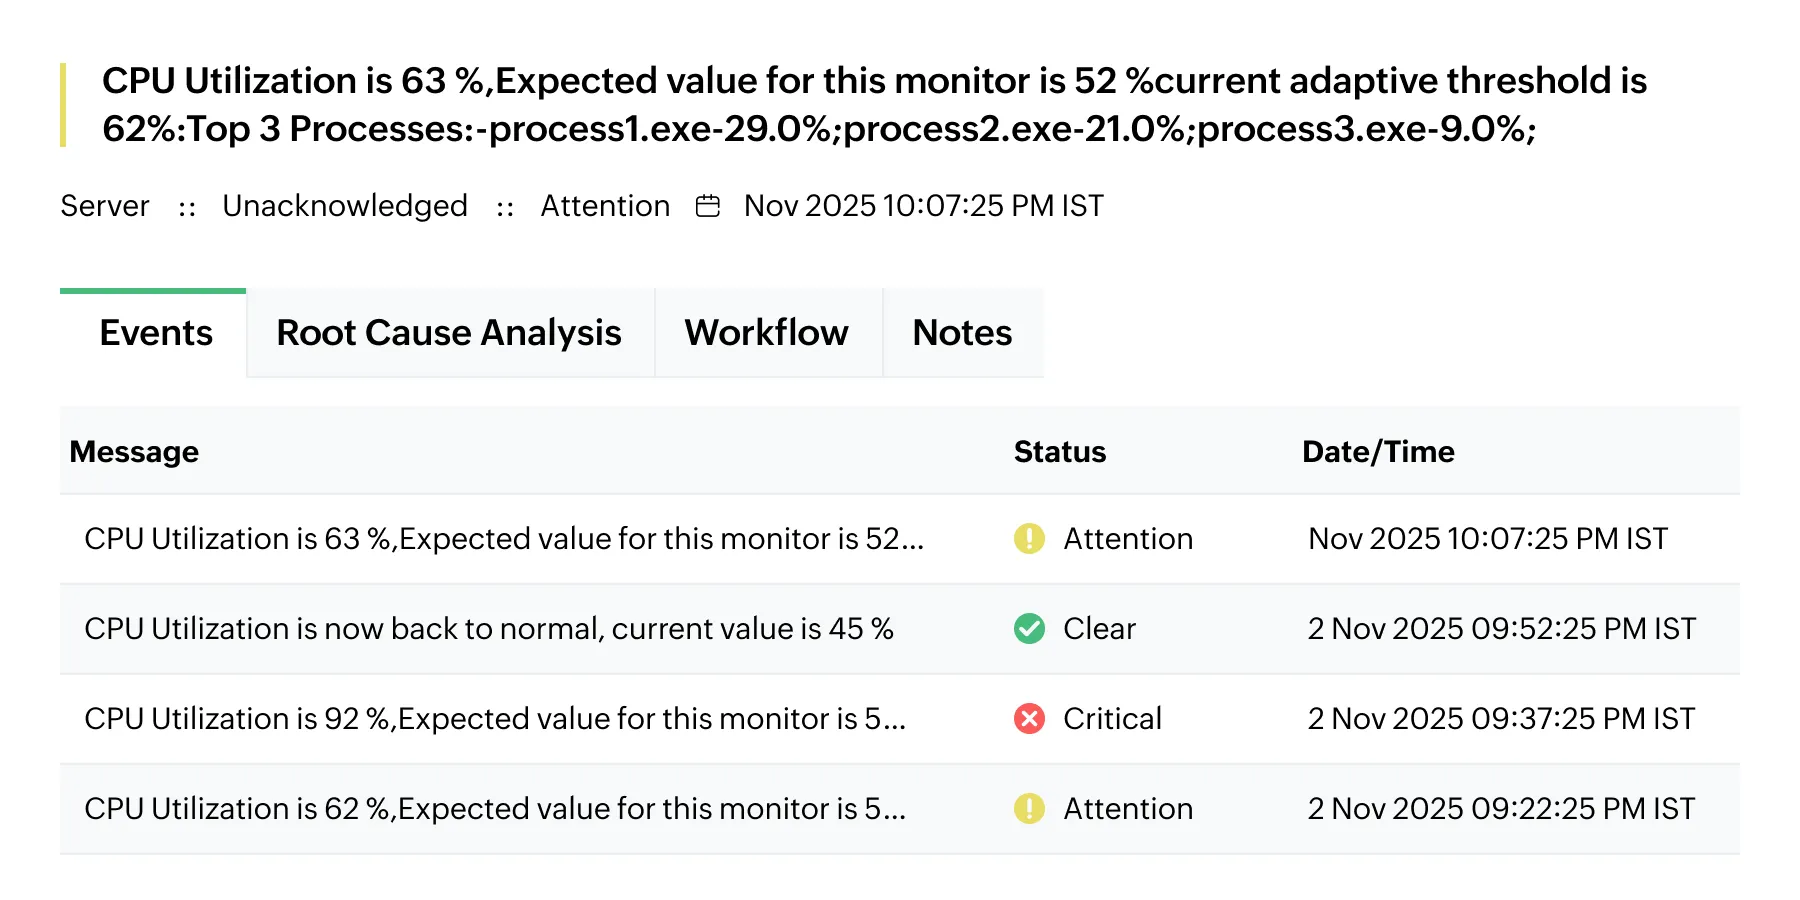
Adaptive thresholds identify subtle deviations that fixed thresholds often miss by comparing current performance against historical patterns for that specific time period.
- Spotting unusual activity: OpManager flags unexpected off-hour spikes by comparing current activity against historical baselines for that specific hour, triggering alarms even if the usage appears low by daytime standards.
- Detecting sudden drops: Anomalies include sudden drops, not just spikes. If traffic plunges significantly below the established historical baseline for that period, OpManager flags it as a critical severity anomaly.
Alarm noise suppression
By adjusting thresholds to match expected high-usage periods, OpManager ensures that legitimate traffic spikes don't result in "false positive" alarms.
- Handling scheduled backup windows: OpManager learns normal spikes during routine events, like nightly backups. It won't trigger false alarms unless performance exceeds the expected deviation, preventing unnecessary midnight alerts.
- Managing seasonal traffic bursts: OpManager adjusts thresholds for predictable, seasonal traffic increases, such as weekend retail surges. This ensures IT teams aren't bombarded with false alerts during expected load increases.
IT automation
Adaptive thresholds eliminate the need for administrators to manually "fine-tune" thousands of monitors across a dynamic infrastructure.
- Scaling new infrastructure: Instead of administrators manually guessing limits for newly deployed VMs, OpManager analyzes initial cycles to automatically establish accurate baseline and deviation levels without intervention.
- Adjusting to evolving workloads: As company workloads naturally grow over time, adaptive thresholds automatically evolve alongside the data, shifting baselines upward to eliminate the need for constant manual updates.
FAQs
- OpManager will require a minimum of 14 days of performance data to successfully analyze data patterns. If you are adding a new device and want to start monitoring it right away, you can use manual thresholds during this period.
- Adaptive thresholds can be enabled in four ways in OpManager. At the global level, the thresholds will be applicable for all devices and performance metrics. At the perf group/performance monitor level, you can apply them for specific performance metrics across all devices. At the device template level, you can apply them for all devices of the same vendor and model. Finally, you can apply them for any specific metric in a particular device at the device level.
- Adaptive Thresholds have to be first enabled globally for it to be enabled as an option in the other levels. If it is disabled globally, only manual thresholds can be configured throughout OpManager.
- Smart event correlation for faster root cause analysis
- Forecasting performance trends with machine learning
- Forecast alarms and reports for resource utilization
- MCP server for Gen-AI integration
- Zia chatbot, dashboard, and insights
- Automated workflows for faster incident response
Resources to dig deeper
The technical playbook for deploying agentic AI in production ITOps
From alerts to action: How agentic AI will change your ITOps
Download Whitepaper→