# Nagios XI alternative: Why OpManager is the best choice?
## Searching for Nagios XI Alternative?
OpManager delivers unified infrastructure monitoring: without the plugin sprawl, cost unpredictability, or operational complexity associated with Nagios XI.
- Native, zero-plugin monitoring
- Automated L2/L3 maps
- Device-based pricing
- Fixed 20% AMS
## What makes OpManager a stronger alternative to Nagios XI?
### Integrated monitoring platform without Plugin overhead

OpManager eliminates the complexity of managing plugins and auxiliary tools by offering a fully integrated monitoring suite from day one. Automatic discovery, topology maps, flow analytics, configuration management, and rich visual dashboards all work natively in a single console, unlike Nagios XI's plugin-centric approach that requires ongoing maintenance and additional components to achieve similar depth.
### Flexible licensing for OpEx or CapEx alignment

While Nagios XI locks customers into a perpetual-only structure, OpManager provides the freedom to choose between subscription or perpetual models. This flexibility makes it easier for organizations to align monitoring investments with OpEx or CapEx preferences, scale more fluidly, and adapt procurement as their infrastructure grows or modernizes.
### Transparent, device-based pricing with fixed AMS

OpManager's device-based pricing avoids the cost creep commonly seen in node-based licensing, where every new host, VM, or monitored IP drives up the bill. With OpManager's clearly defined 20% AMS rate, customers benefit from consistent, transparent long-term costs, whereas Nagios XI renewals fluctuate based on node count and can escalate significantly as environments expand.

## All-in-one monitoring that scales without licensing shocks
While Nagios XI may appear competitive initially, its long-term costs add up quickly. The Standard Edition for 100 nodes is priced at $2,495, with an annual AMS renewal of $2,062, nearly the cost of the license itself. OpManager offers a more cost-effective alternative with an AMS renewal of just $399. This significantly lower ongoing support cost, combined with built-in monitoring capabilities and reduced dependency on plugins, results in a substantially lower total cost of ownership. Over time, OpManager delivers better value, predictable costs, and a higher ROI compared to Nagios XI.
| Features | 
(Standard Edition) | 
(Standard Edition) |
|---|---|---|
| **Price** | $1,995
(100 devices) | $2,495
(100 nodes) |
| **AMS (Annual maintenance and support)** | $399 | $2,062 |
| **Server monitoring (Windows/Linux)** | ✓ | Requires plugins/agents |
| Network infrastructure monitoring | ✓ | Requires plugins/wizards |
| Advanced Interface monitoring | ✓ | Requires plugins/wizards |
| Virtualization monitoring | ✓ | Requires plugins/wizards |
| Automated network topology mapping | ✓ | ✗ |
| Email support | Unlimited | Only 10 cases/year |
| Licensing | Subscription & Perpetual | Perpetual only |
## Feature-rich Nagios XI Alternative
### Infrastructure
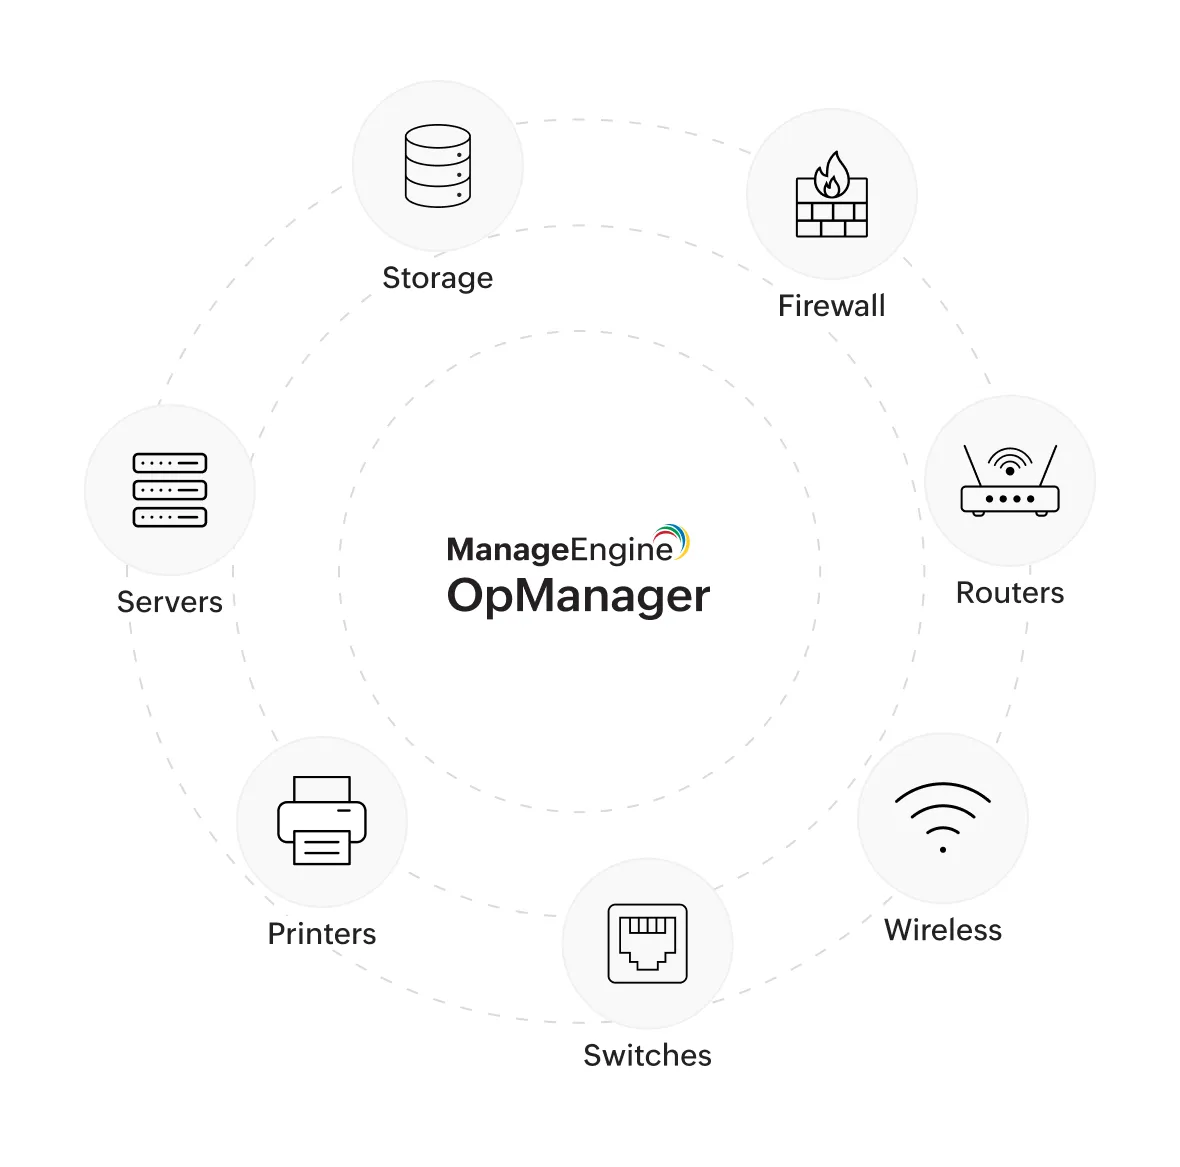
#### Broad device coverage without dependency on add-ons
OpManager monitors servers, routers, switches, wireless controllers, and virtual environments with built-in profiles. Nagios XI covers core devices, but deeper insights for many device families require plugins or custom checks.
#### Automated discovery with accurate topology mapping
OpManager automatically discovers devices and builds L2 connectivity maps and topology diagrams. Nagios XI supports topology views, but richer visual layers often involve plugins or manual configuration.
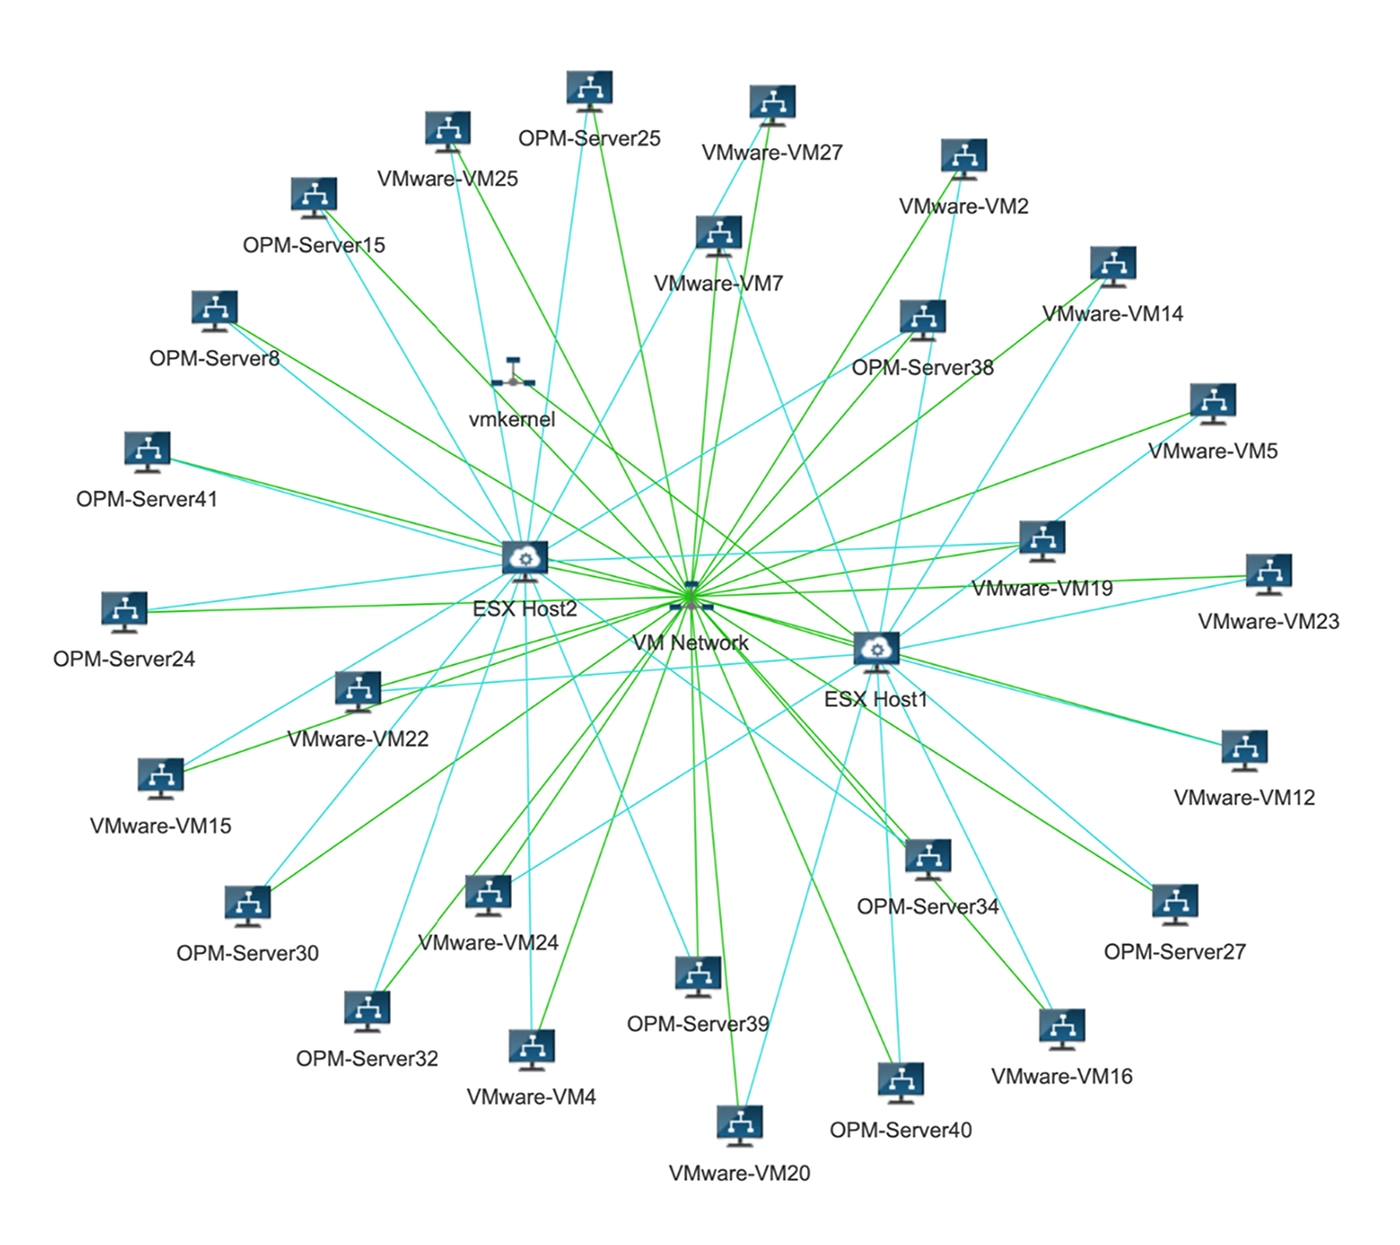
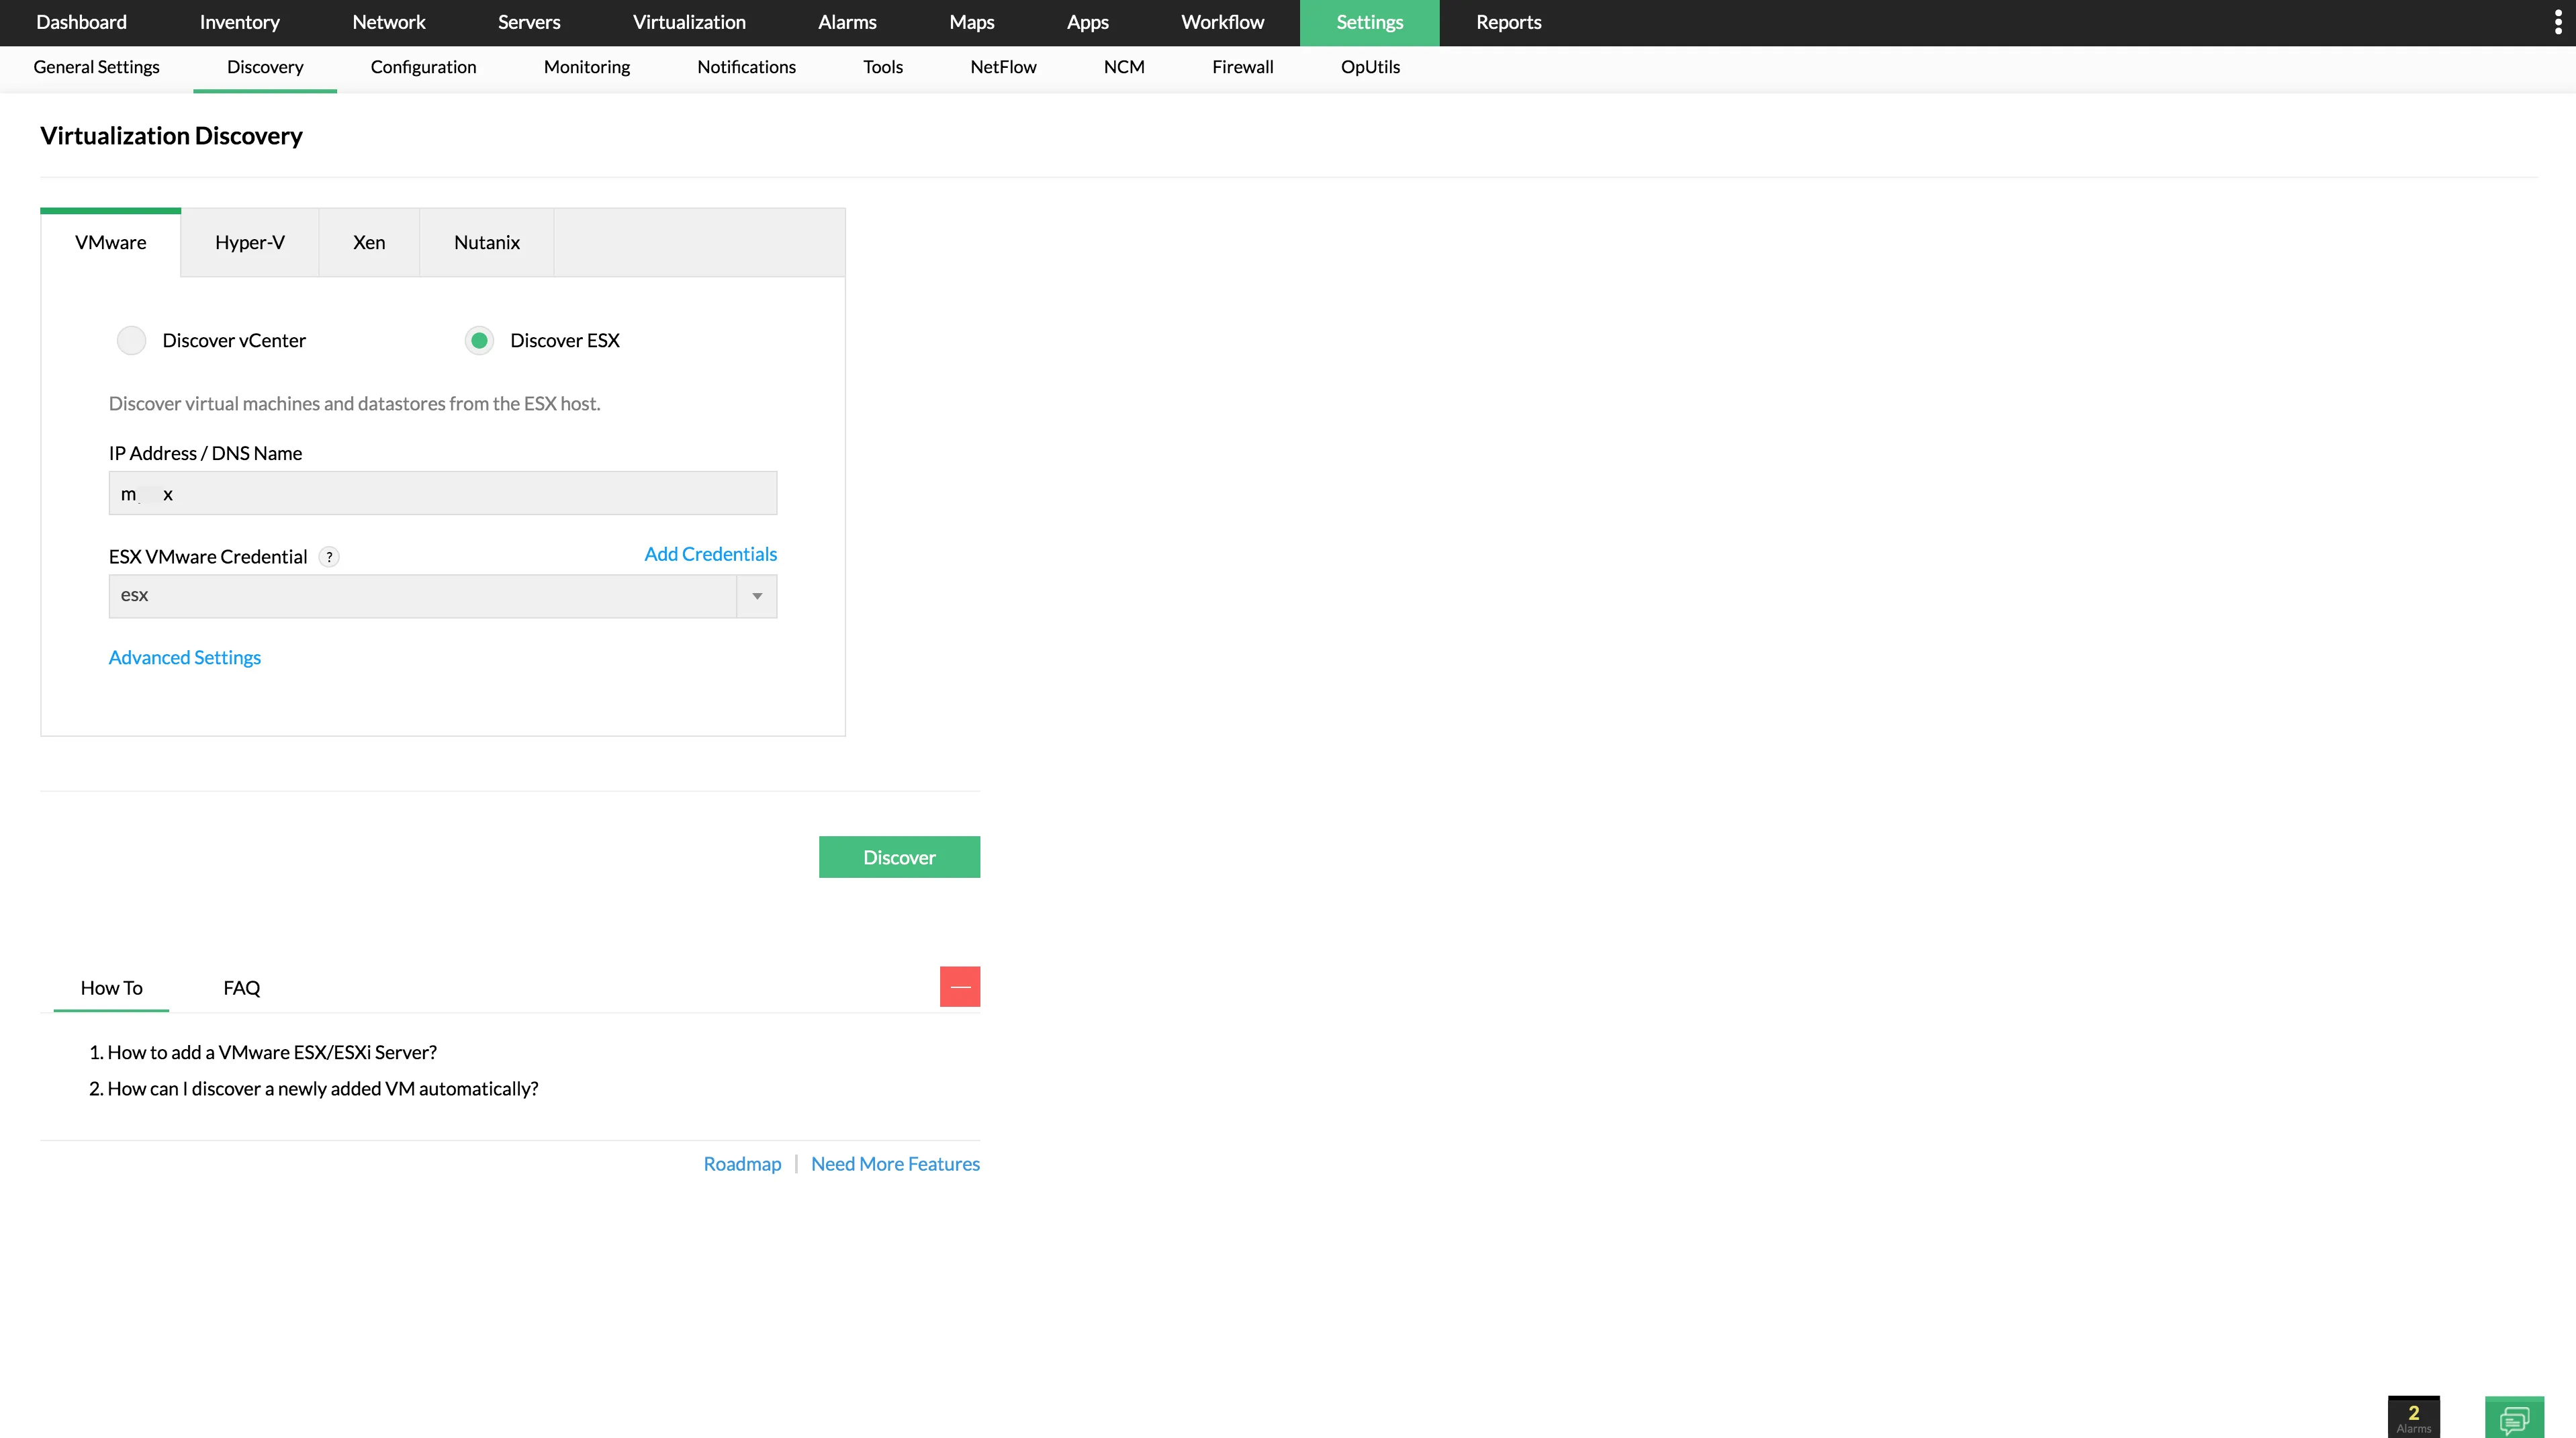
#### End-to-end virtualization insights with minimal setup
OpManager provides ready-to-use templates for VMware, Hyper-V, and Citrix monitoring, enabling complete visibility with little manual work. Nagios XI supports these platforms, but full insight typically requires configuration wizards or additional setup.
### Automation
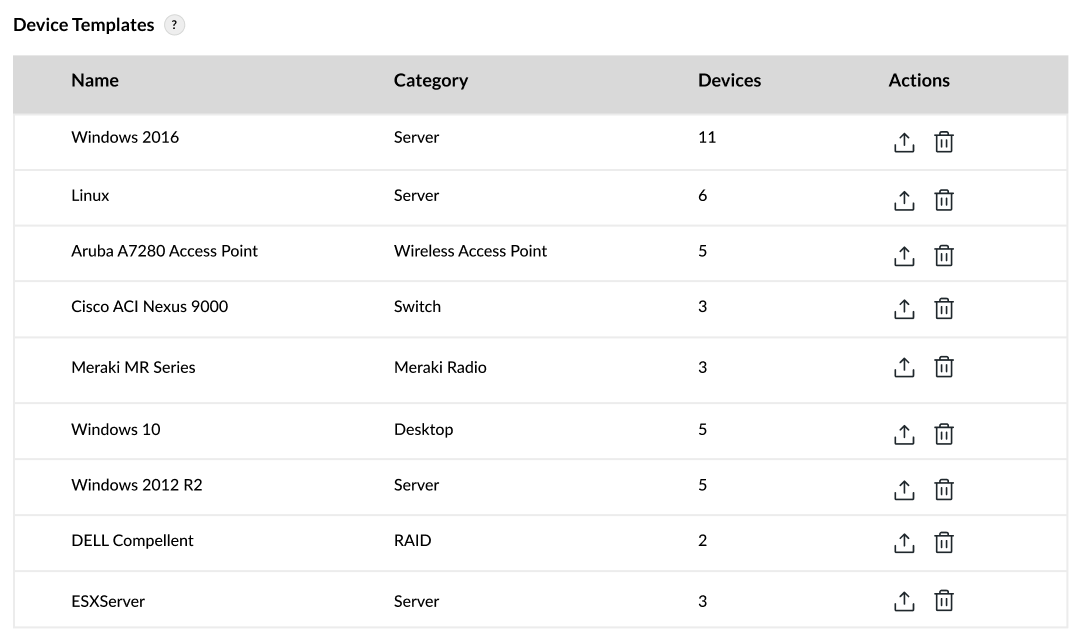
#### Faster onboarding with intelligent monitoring templates
OpManager automatically applies device templates and thresholds for rapid deployment. Nagios XI offers setup wizards, but deeper profiling frequently depends on plugins or custom checks.
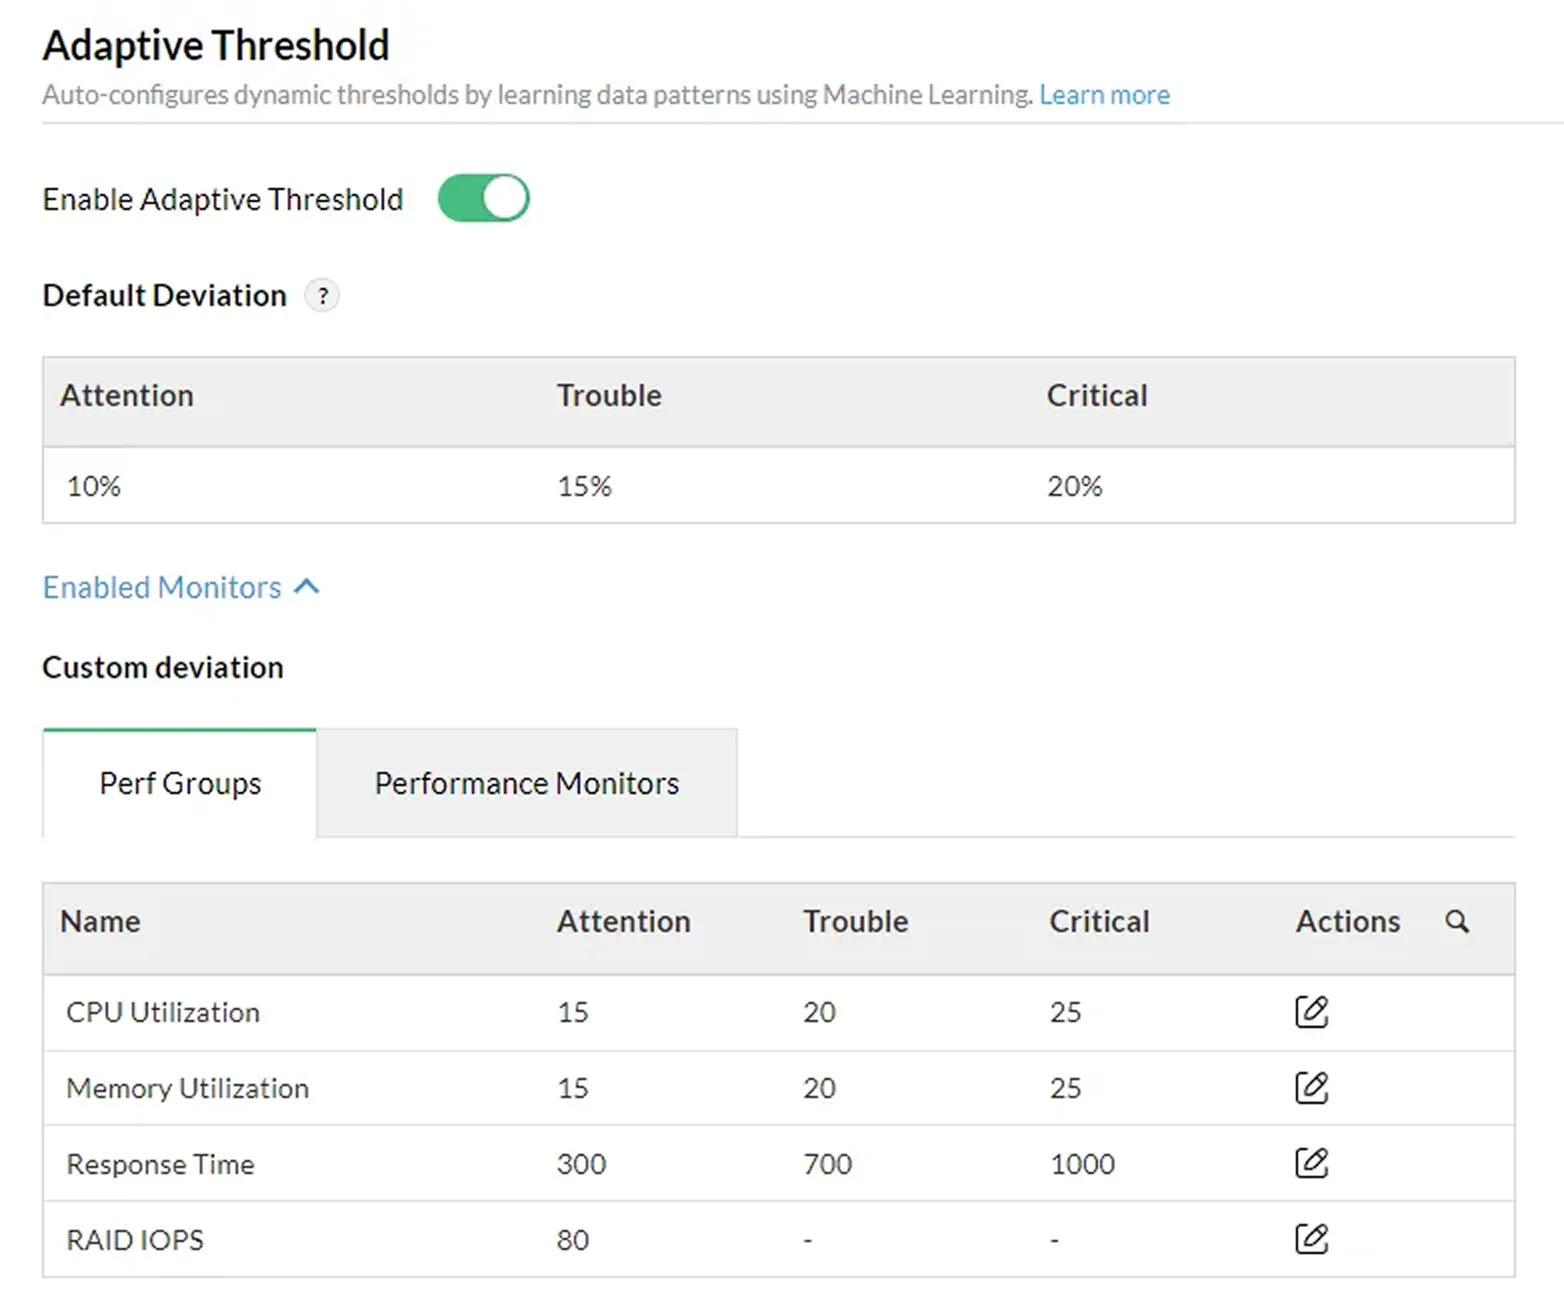
#### Smart thresholding that cuts down false alerts
OpManager leverages dynamic baselining and anomaly cues to deliver cleaner, more meaningful alerts. Nagios XI supports alerting, but advanced behavioral analytics often require scripts or add-ons.
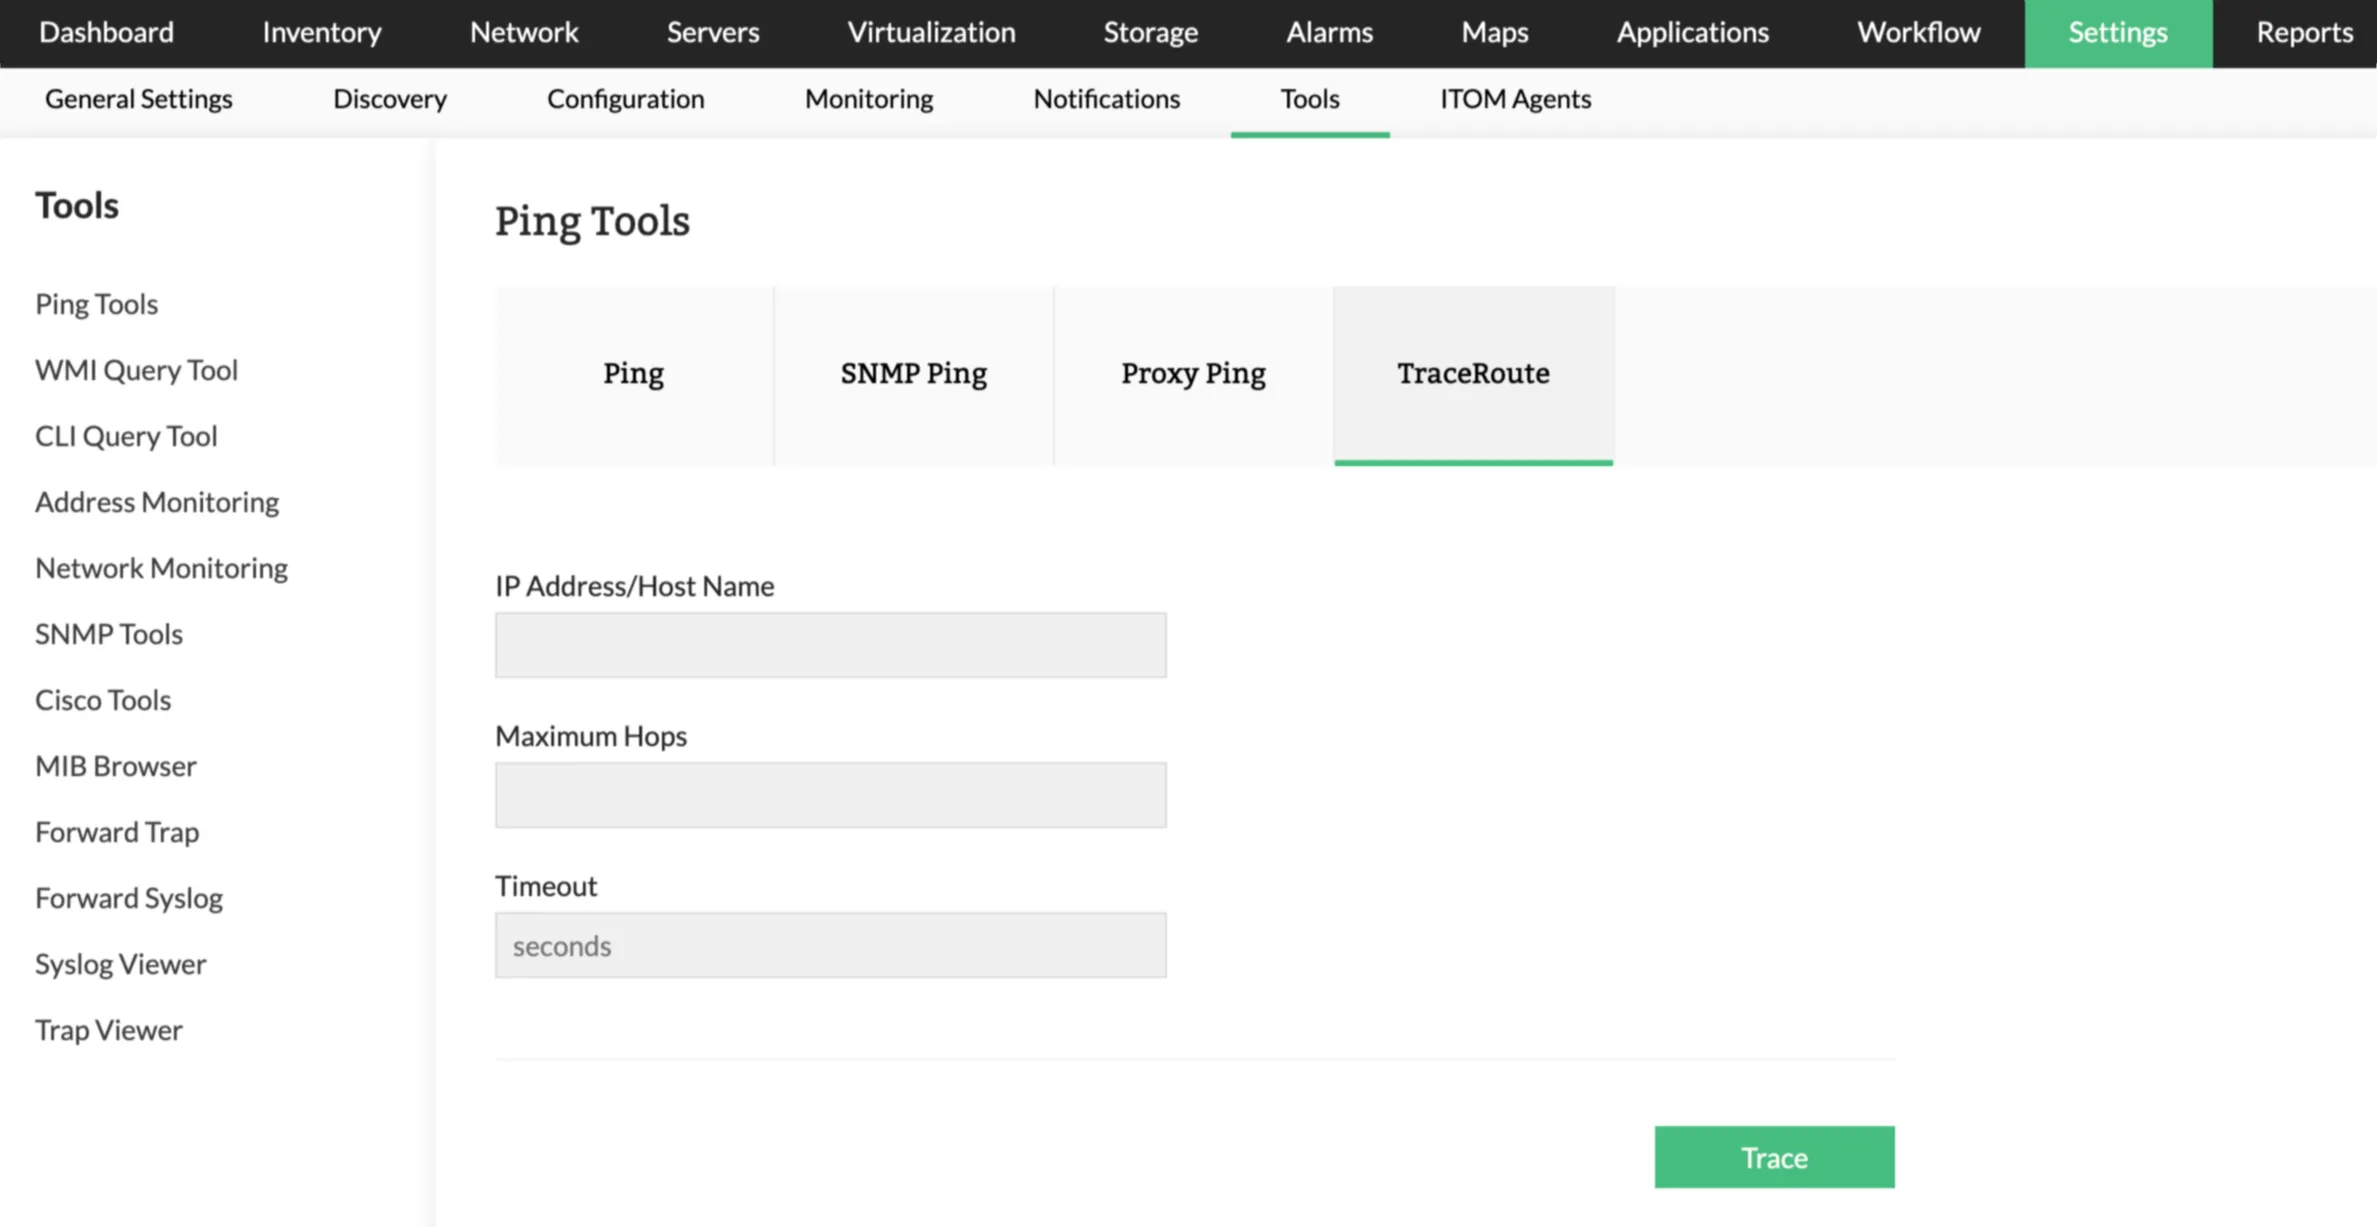
#### Integrated diagnostic tools that accelerate troubleshooting
OpManager consolidates ping, traceroute, SNMP tools, syslog, traps, and more into a unified console. Nagios XI provides basic diagnostics, but extended capabilities often rely on external utilities or plugins.
### Visibility
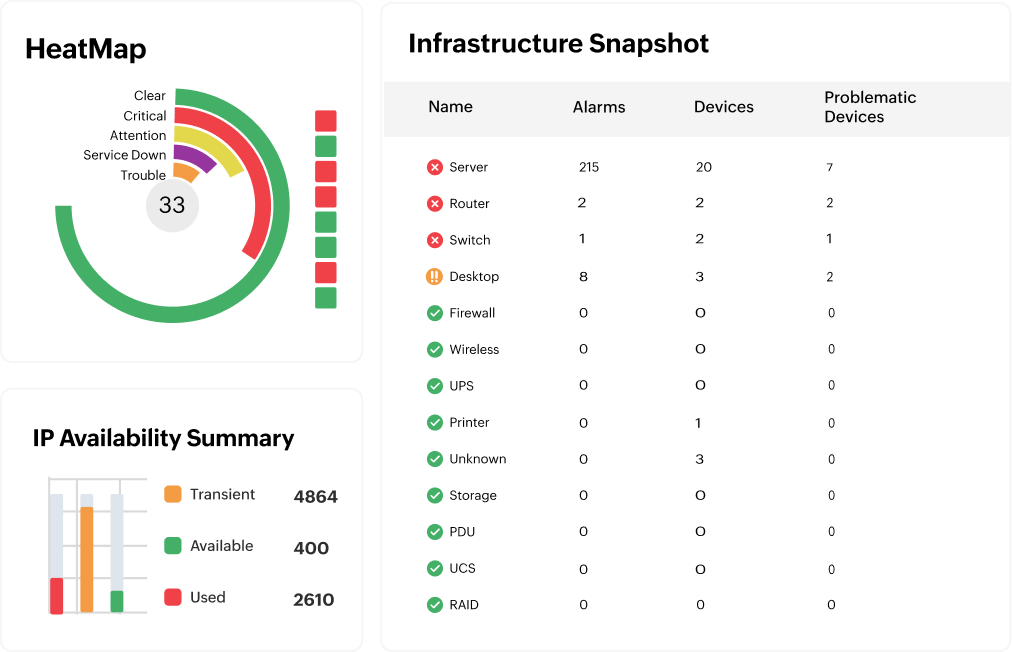
#### Visual layers that make issues easier to pinpoint
OpManager offers NOC views, heatmaps, L2 maps, and 3D rack visualizations for rapid fault identification. Nagios XI includes dashboards, but advanced visual layers are typically plugin-driven.
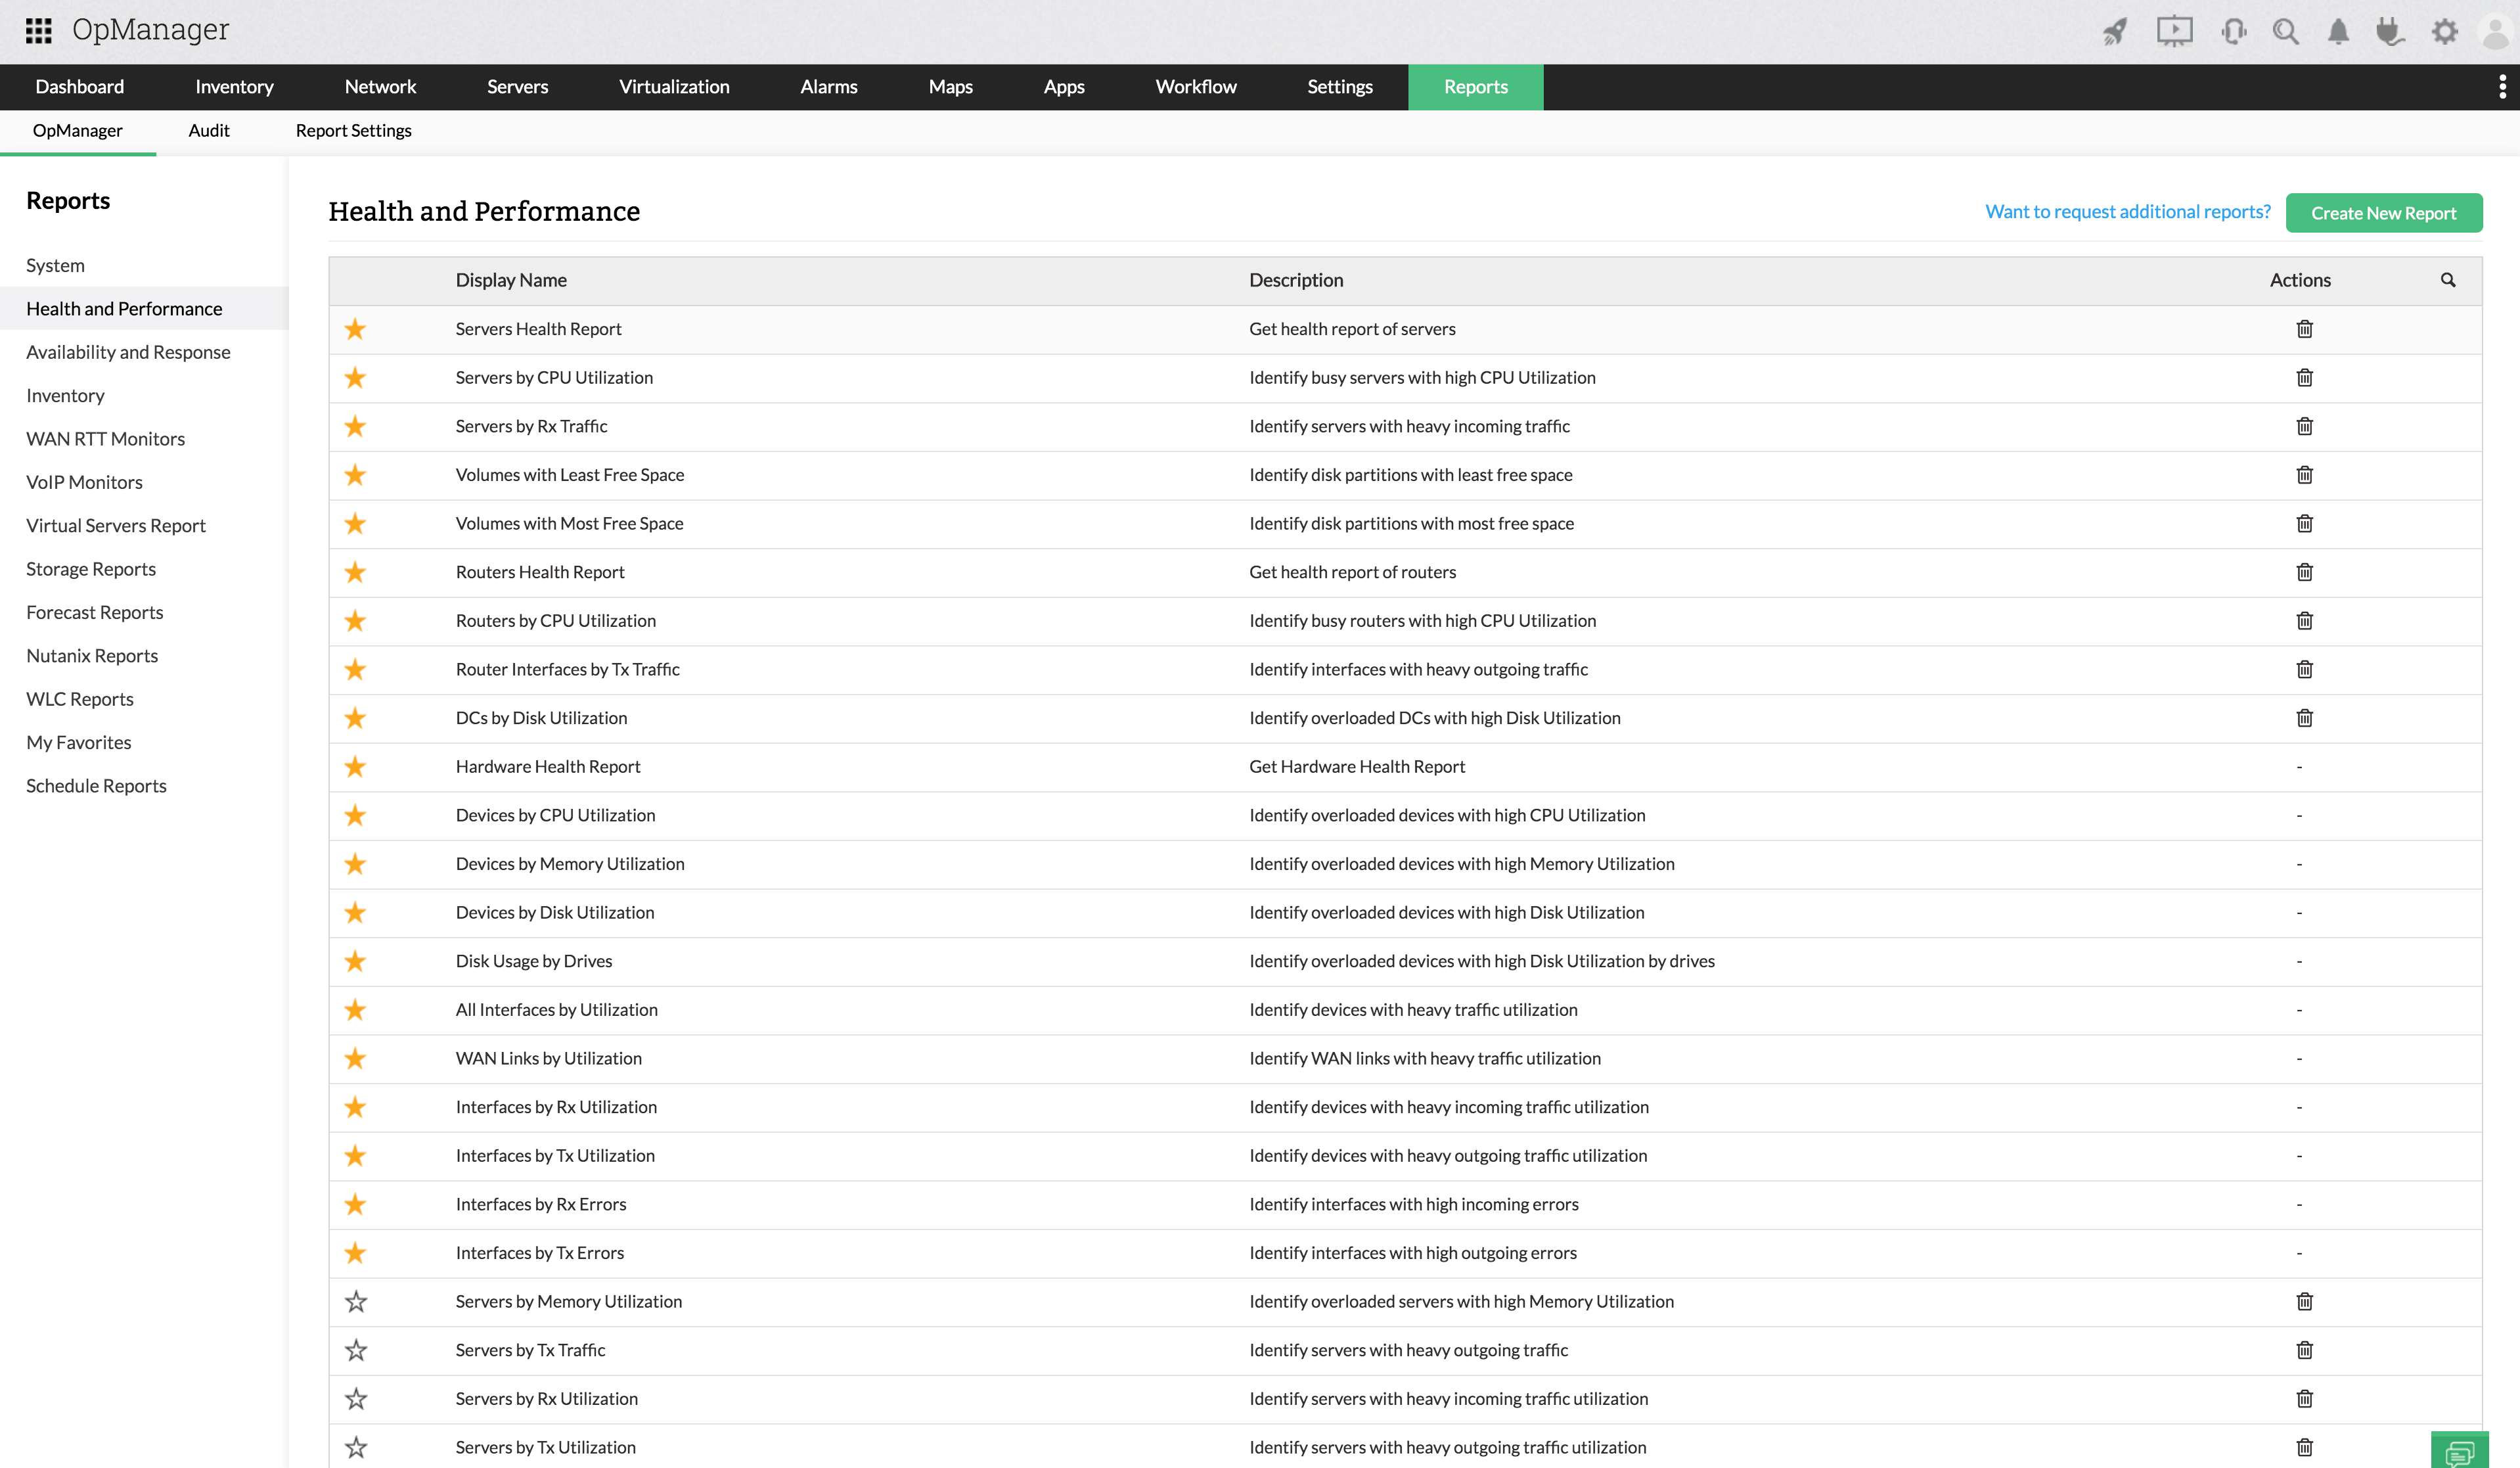
#### Comprehensive reports that support audits and planning
With 100+ built-in reports covering SLA, capacity, forecasts, bandwidth, and anomalies, OpManager simplifies audit readiness. Nagios XI provides performance graphs and basic capacity reports, with broader reporting relying on plugins or customization.
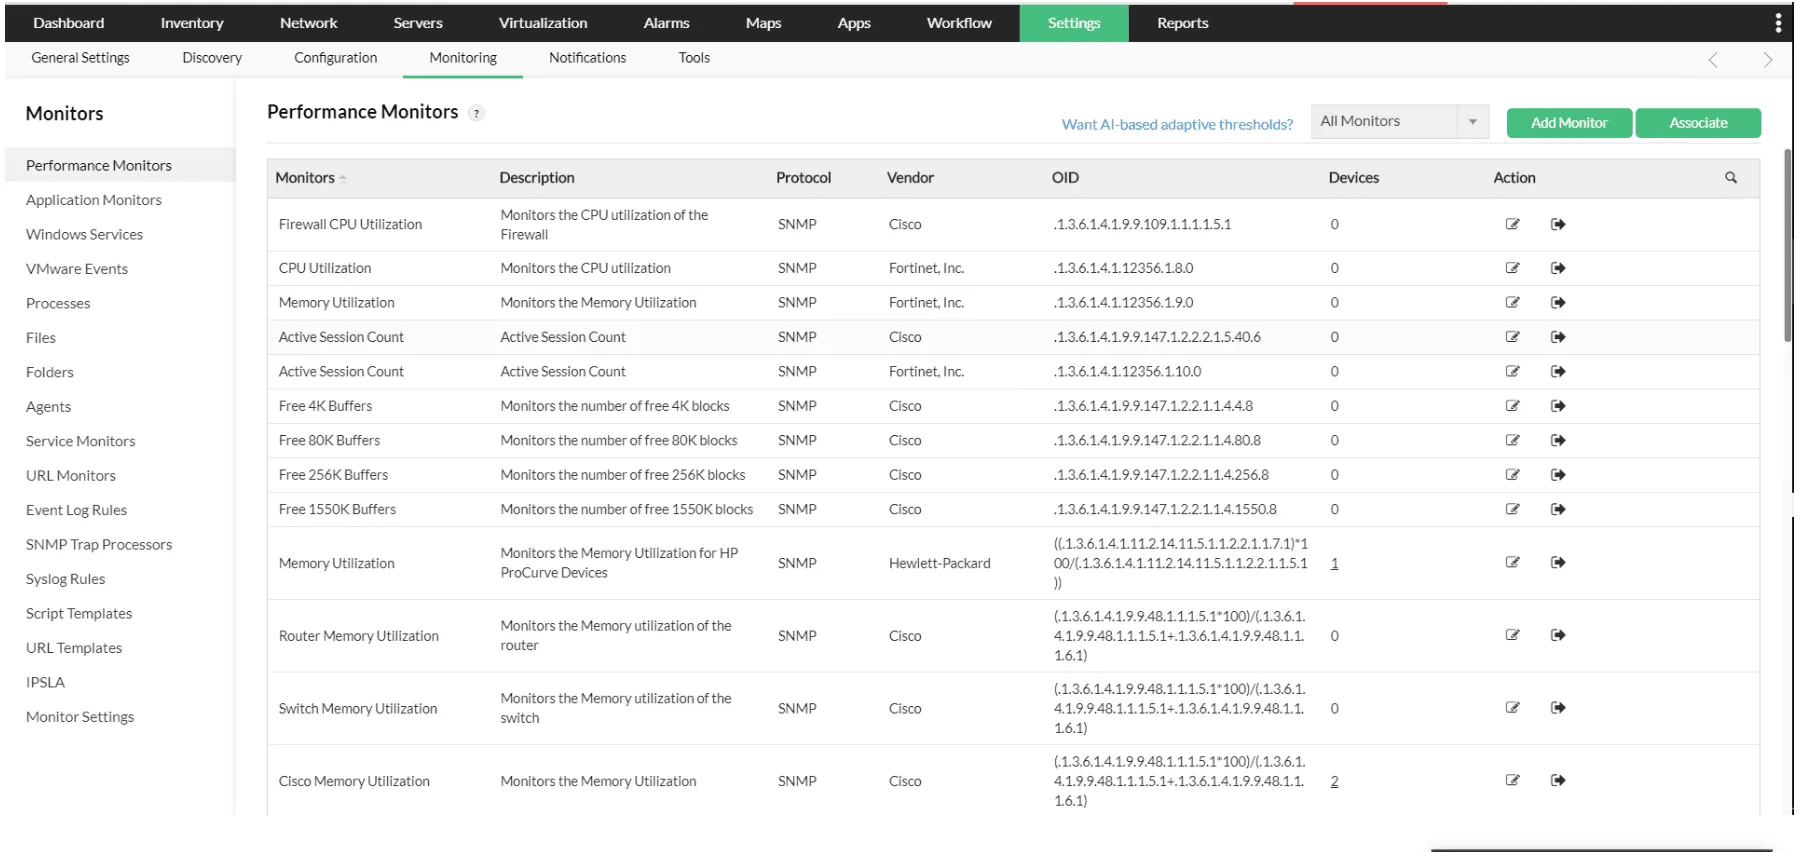
#### High-granularity metrics for deeper performance analysis
[OpManager tracks more than 1,000 performance metrics across network, server, VM, WAN, and storage layers.](https://www.manageengine.com/network-monitoring/network-performance-monitoring.html?alt2nagiosxi) Nagios XI's metric depth varies widely based on plugin availability.
### Integrations
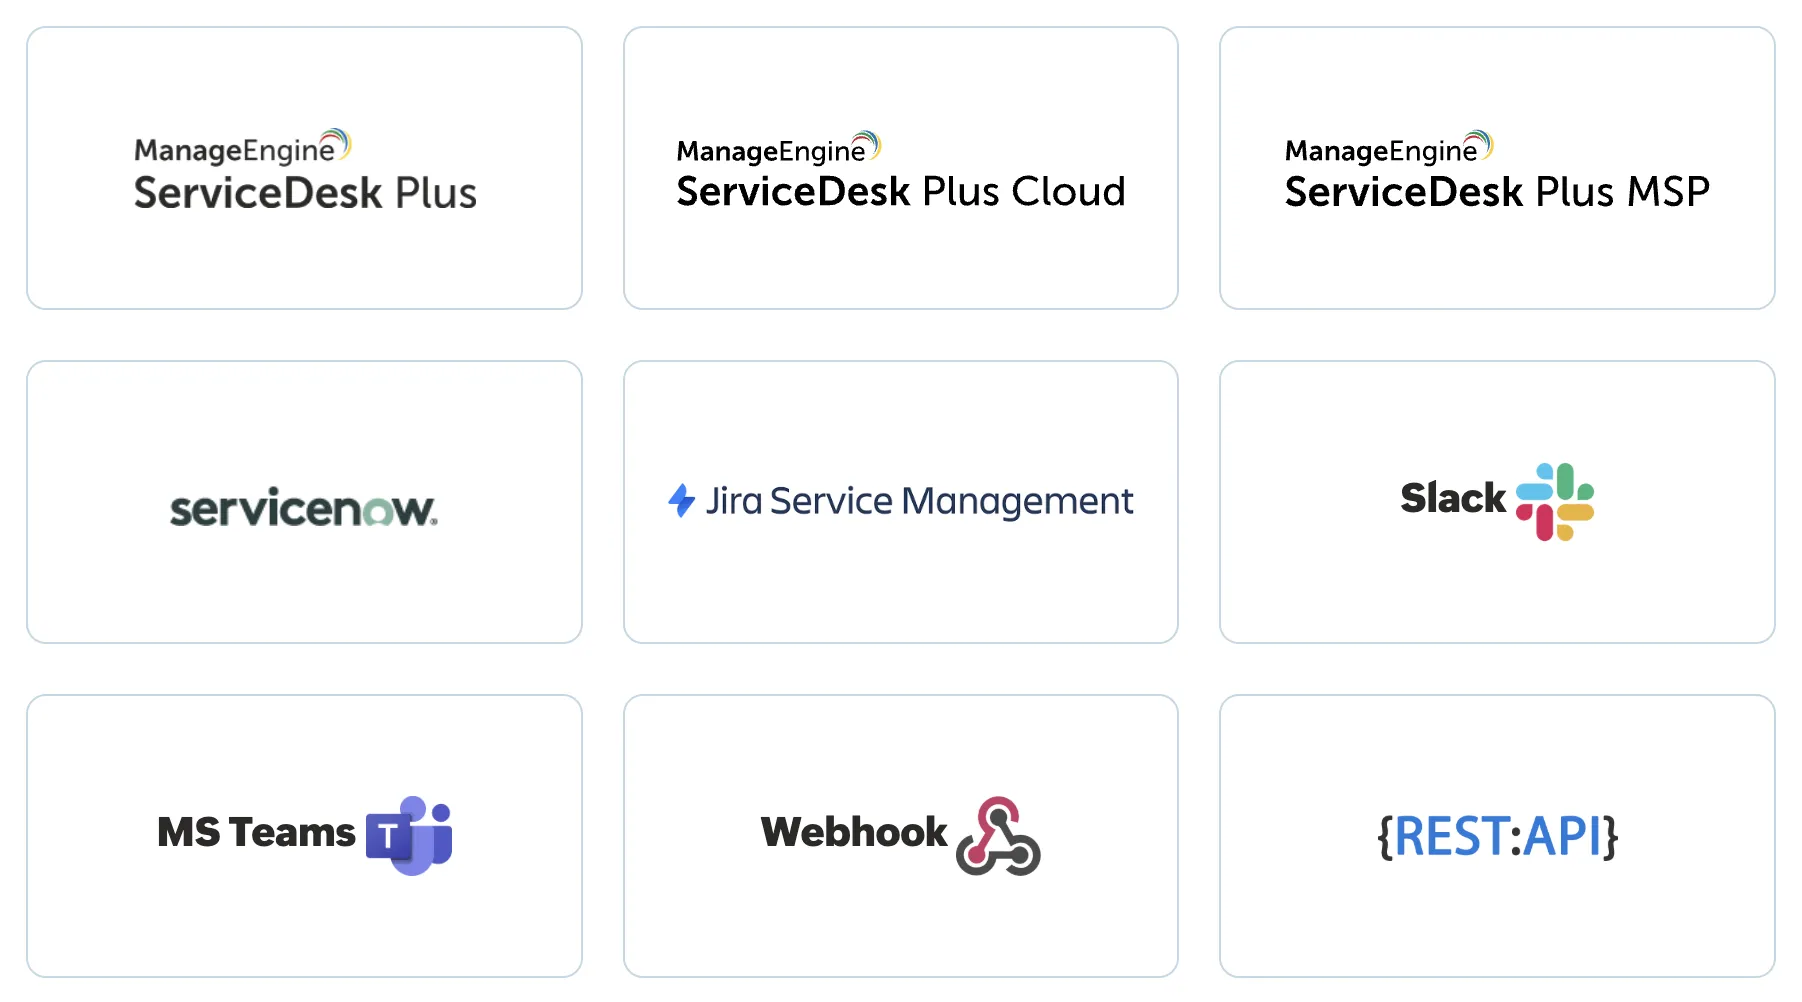
#### Seamless ITSM integrations that speed up resolution
OpManager integrates directly with ServiceDesk Plus, Jira, ServiceNow, Slack, and Teams. Nagios XI supports integrations, but many require plugins or scripting.
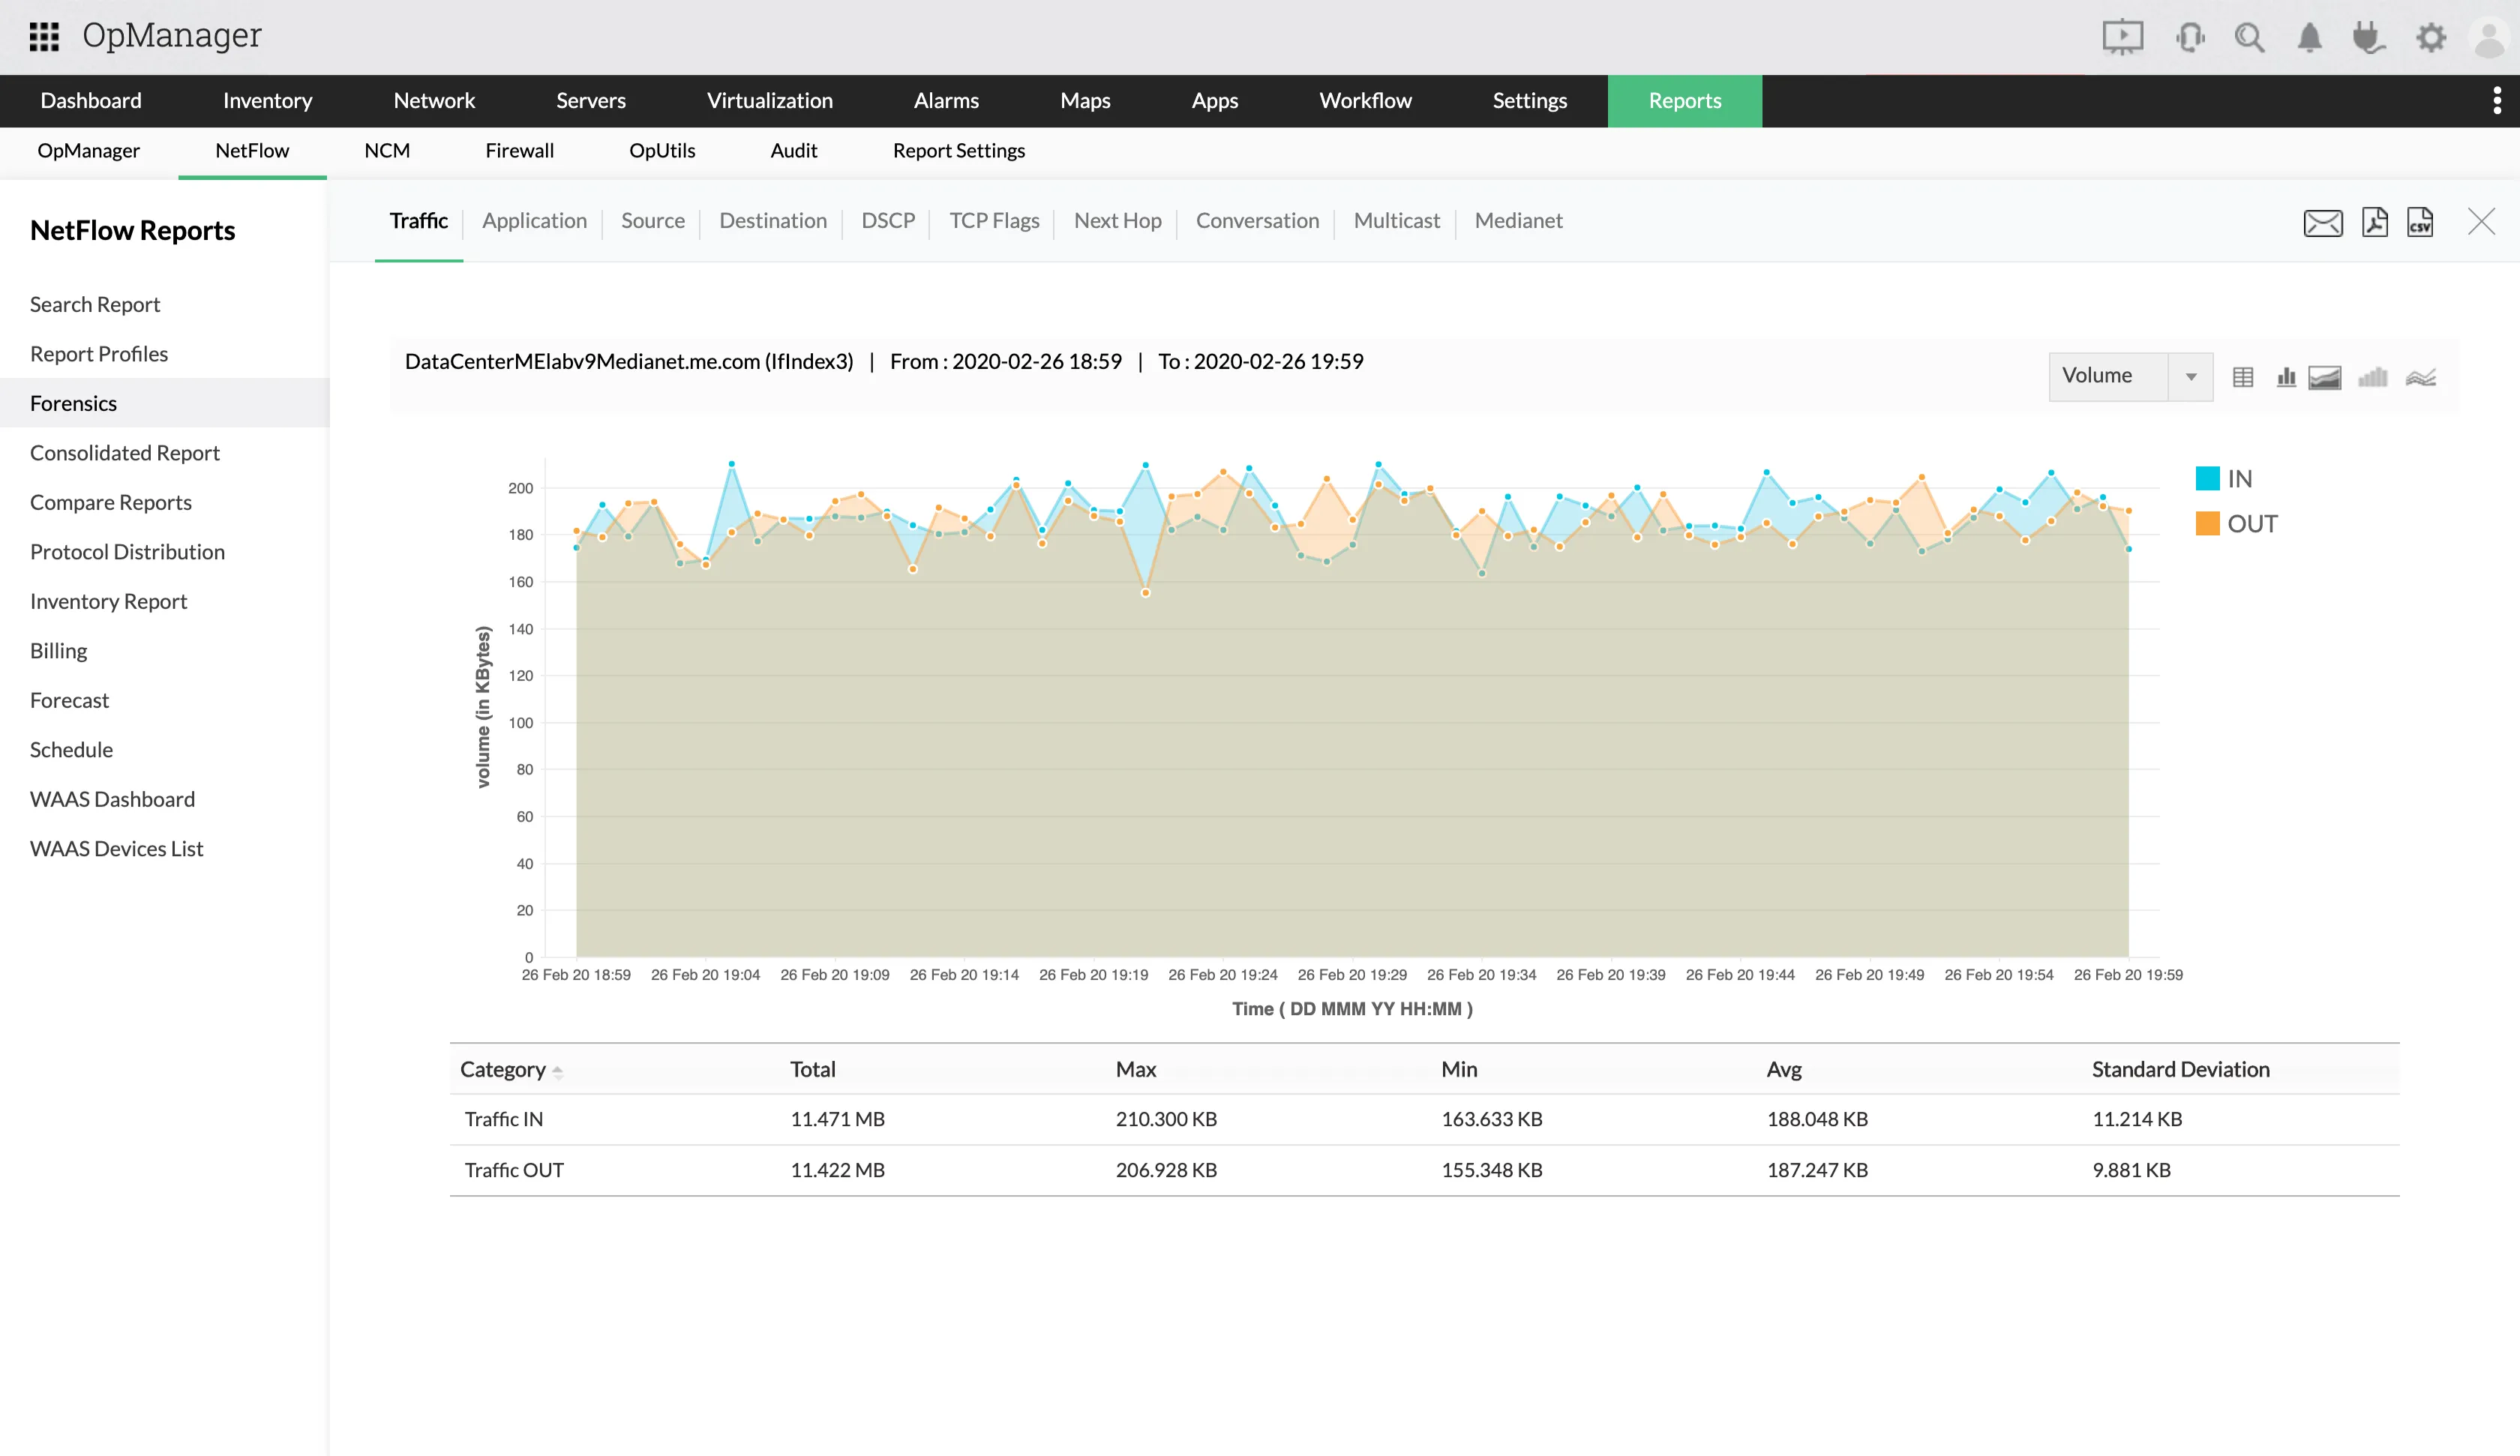
#### Built-in traffic analytics for real-time bandwidth insights
OpManager includes NetFlow-based traffic analysis within the same console. Nagios XI requires a separate product, Nagios Network Analyzer, for comparable visibility.
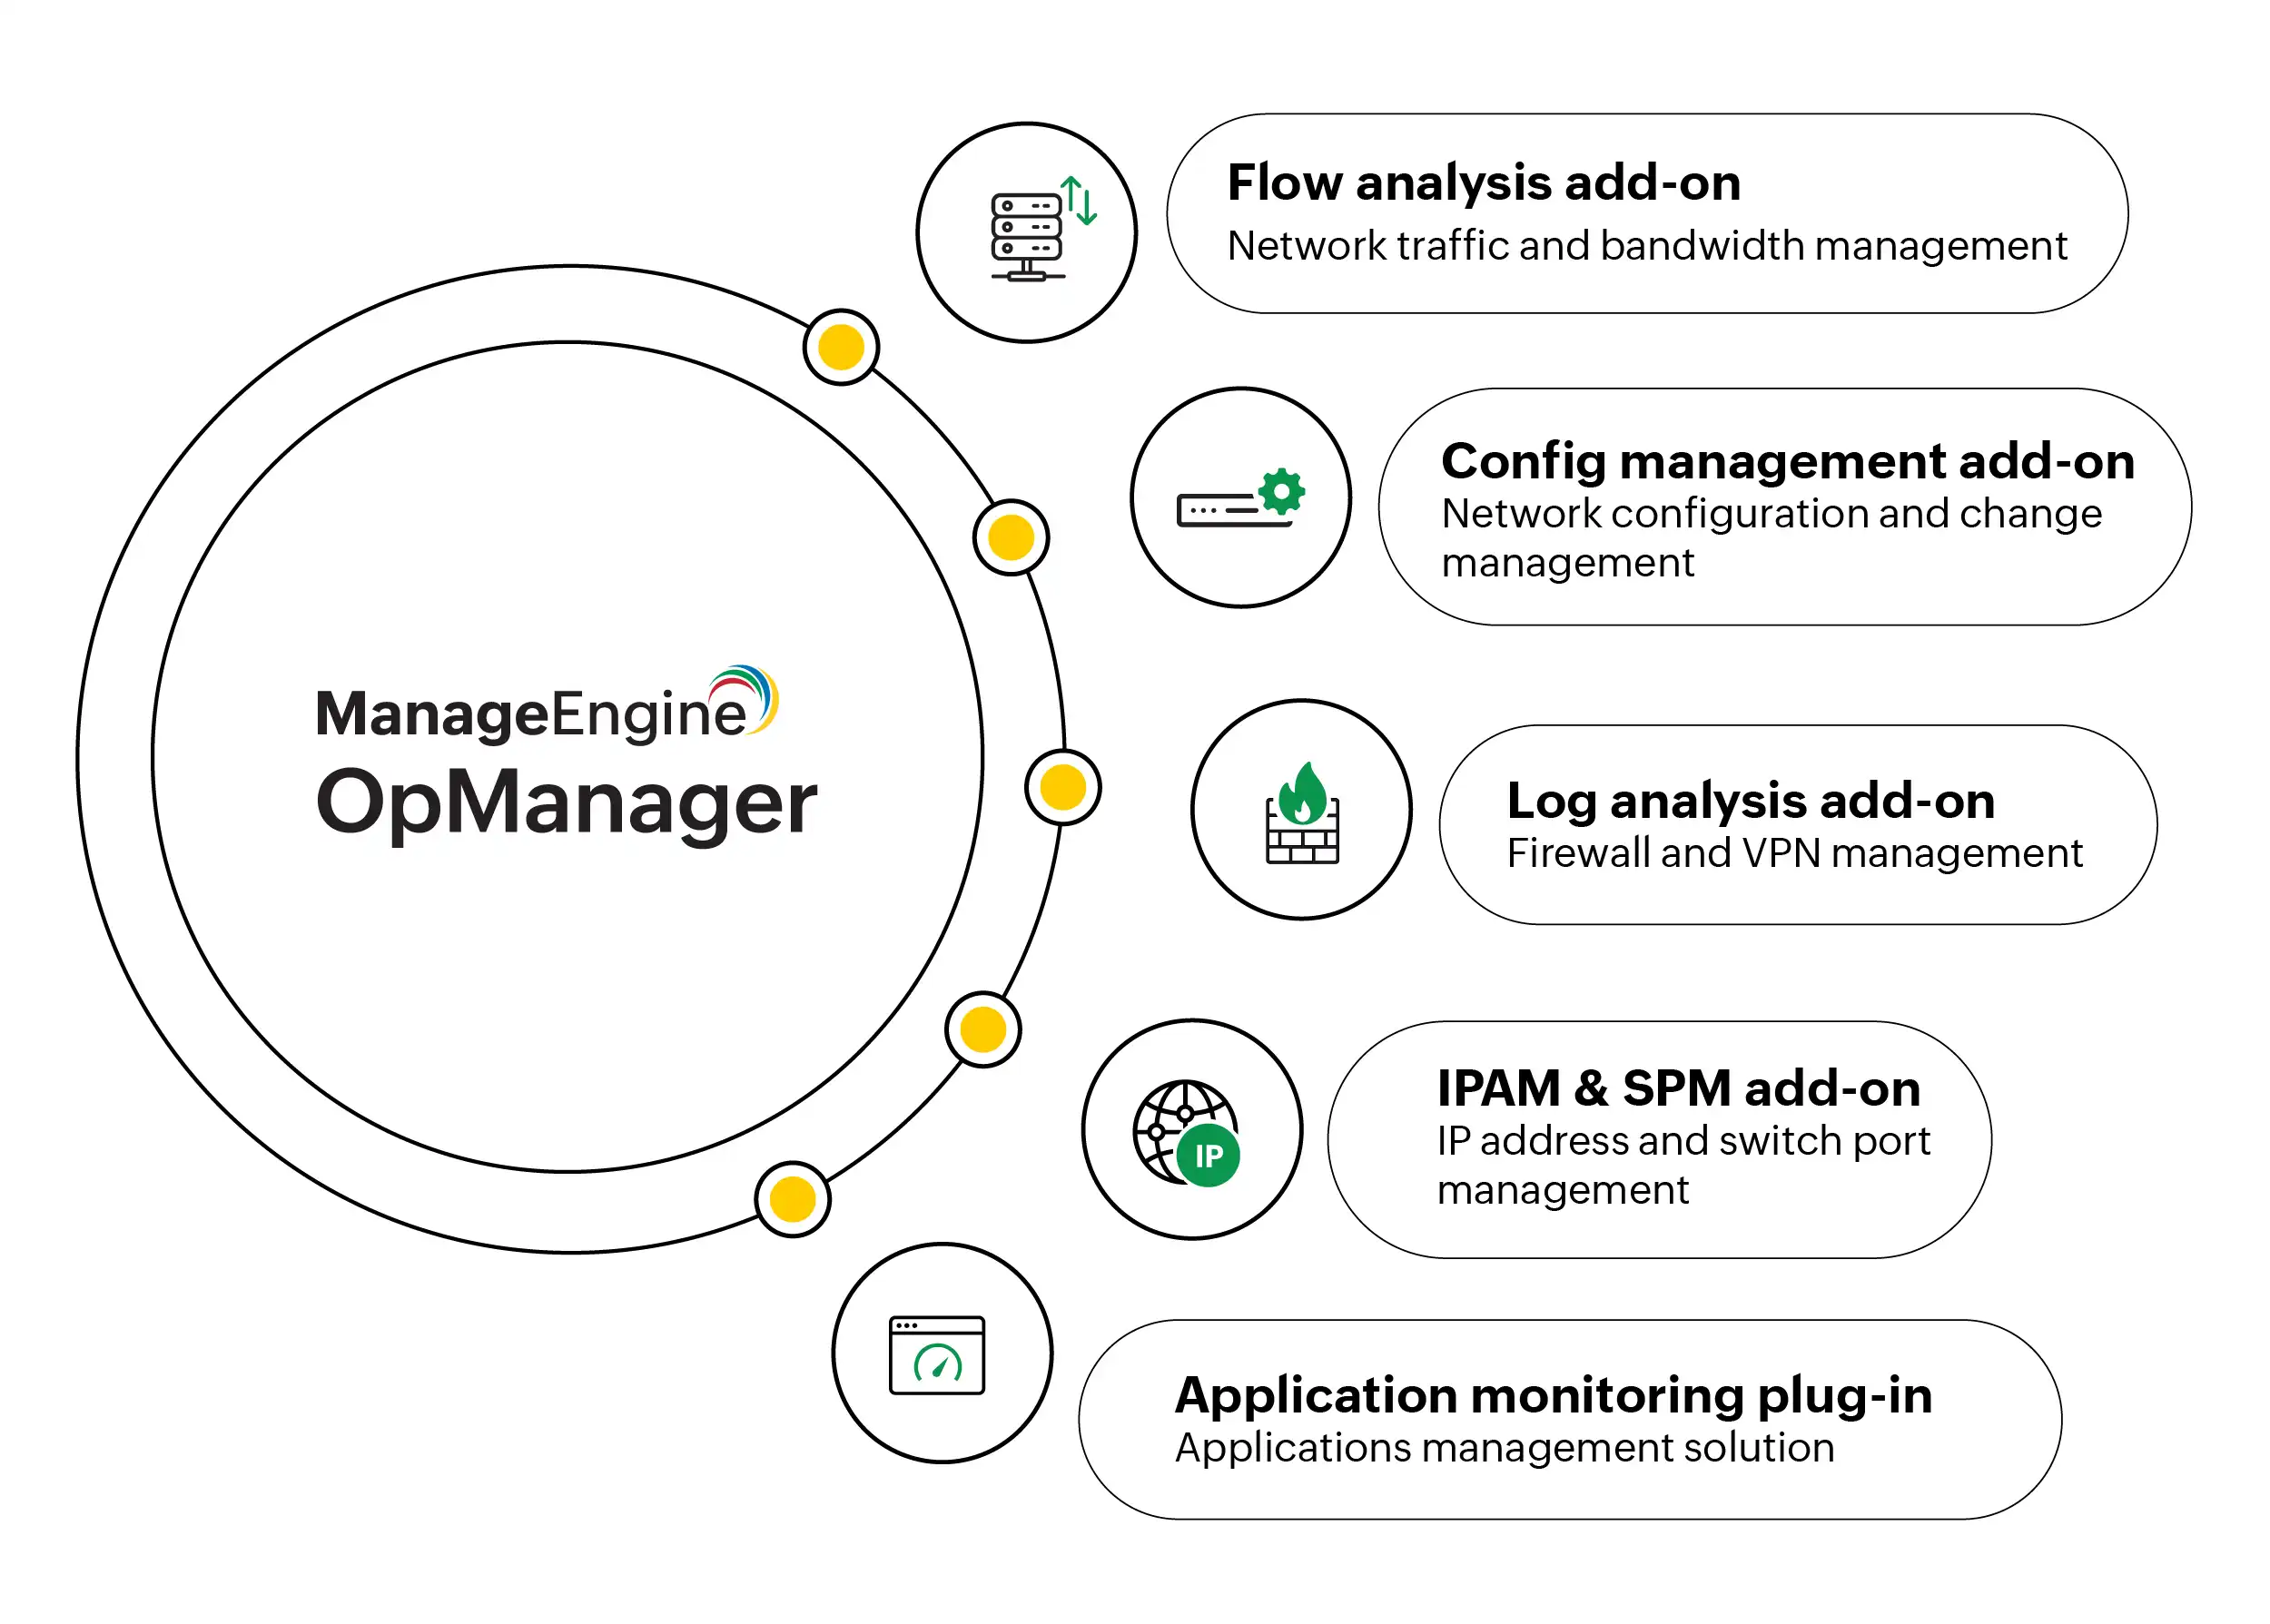
#### Unified management suite that reduces operational complexity
OpManager connects with NCM, NetFlow Analyzer, APM, and Firewall Analyzer as part of one ecosystem. Nagios XI requires multiple separate products and community plugins to match similar capabilities.
### Analytics
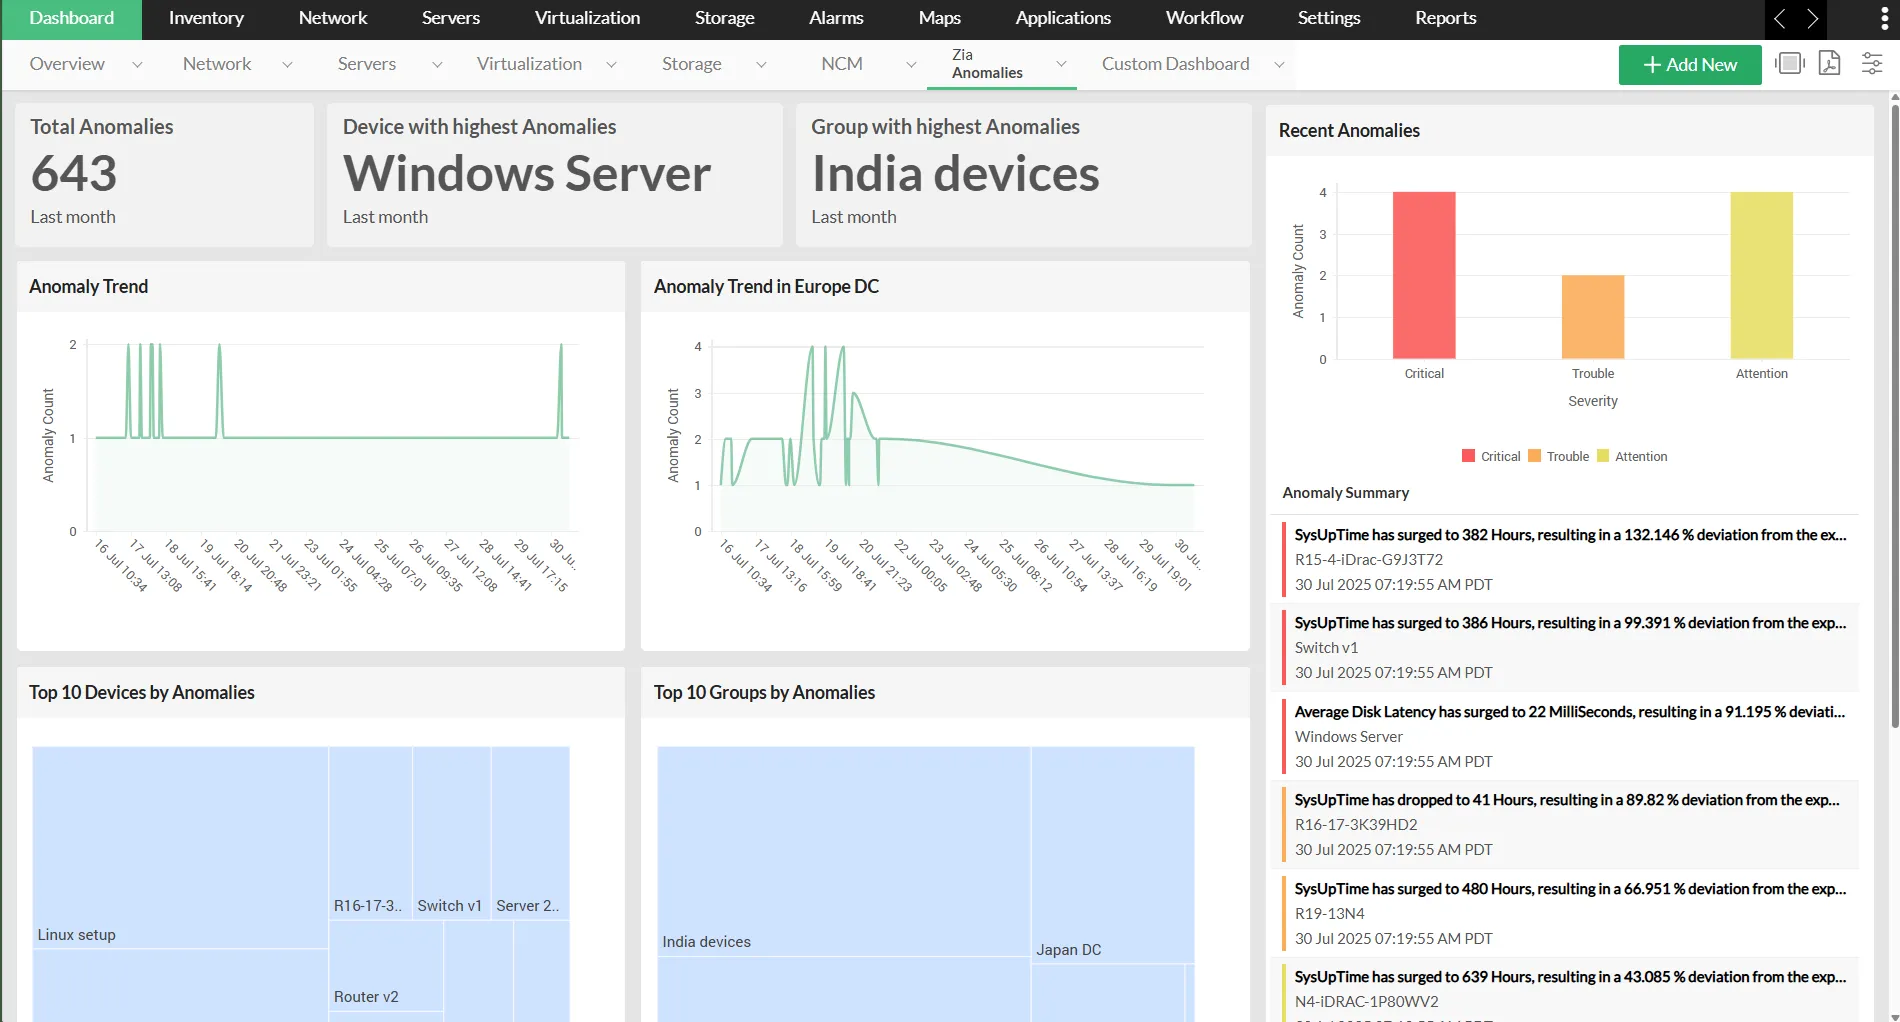
#### AI-driven anomaly detection for proactive fault prevention
OpManager baselines performance behavior and flags deviations using ML. Nagios XI does not seem to have native AIOps or machine-learning analytics.
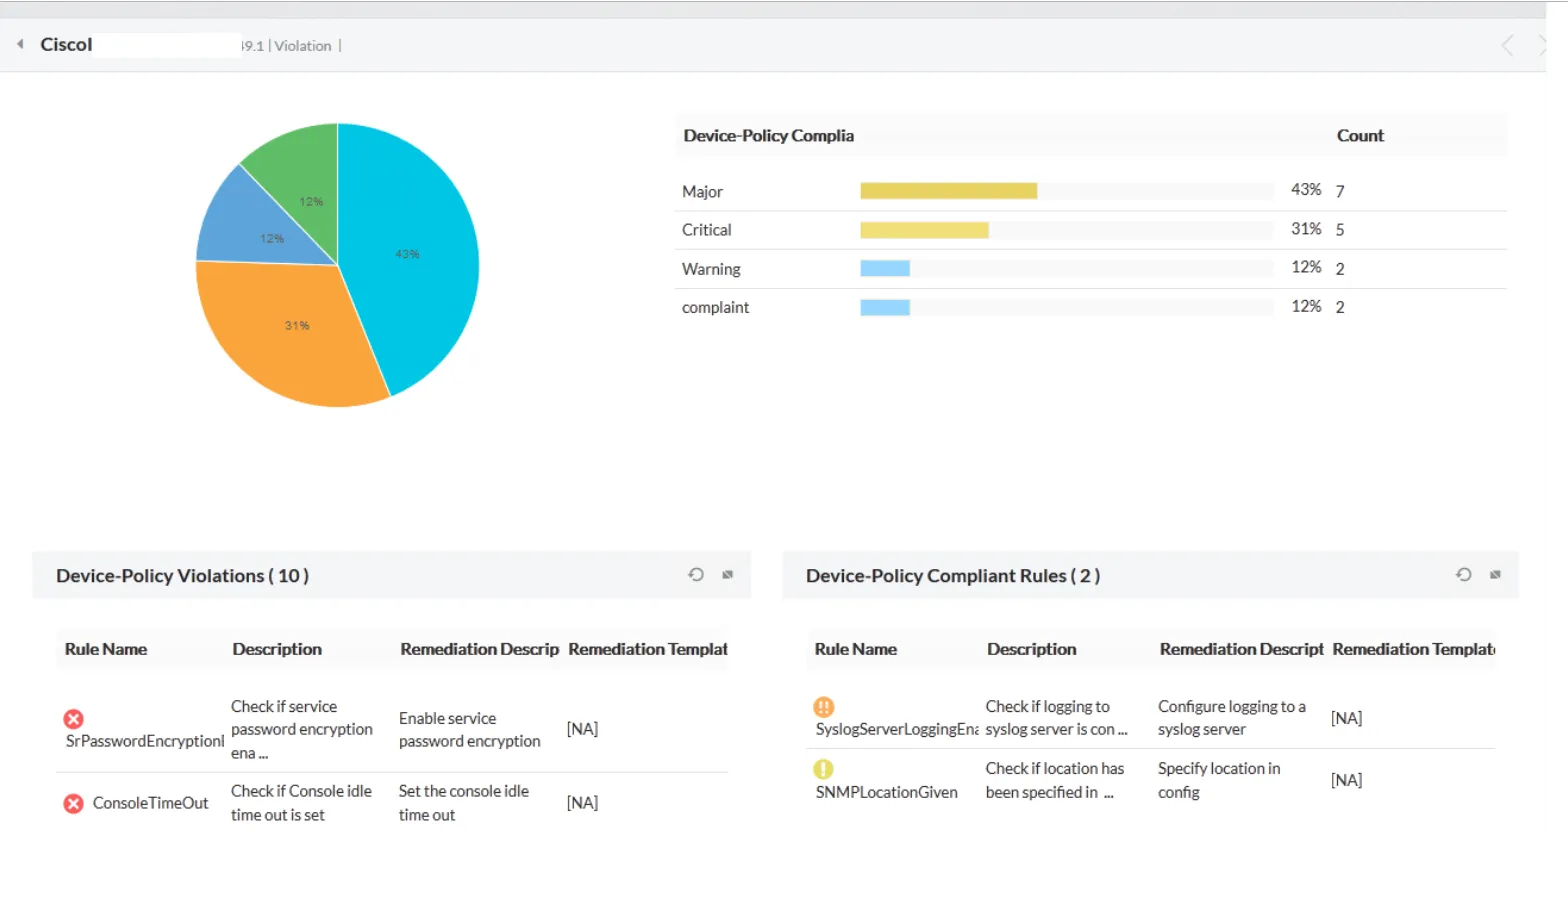
#### Built-in configuration management that enhances compliance
OpManager's integrated NCM handles backups, versioning, compliance checks, and rollbacks. Nagios XI lacks native NCM capabilities.
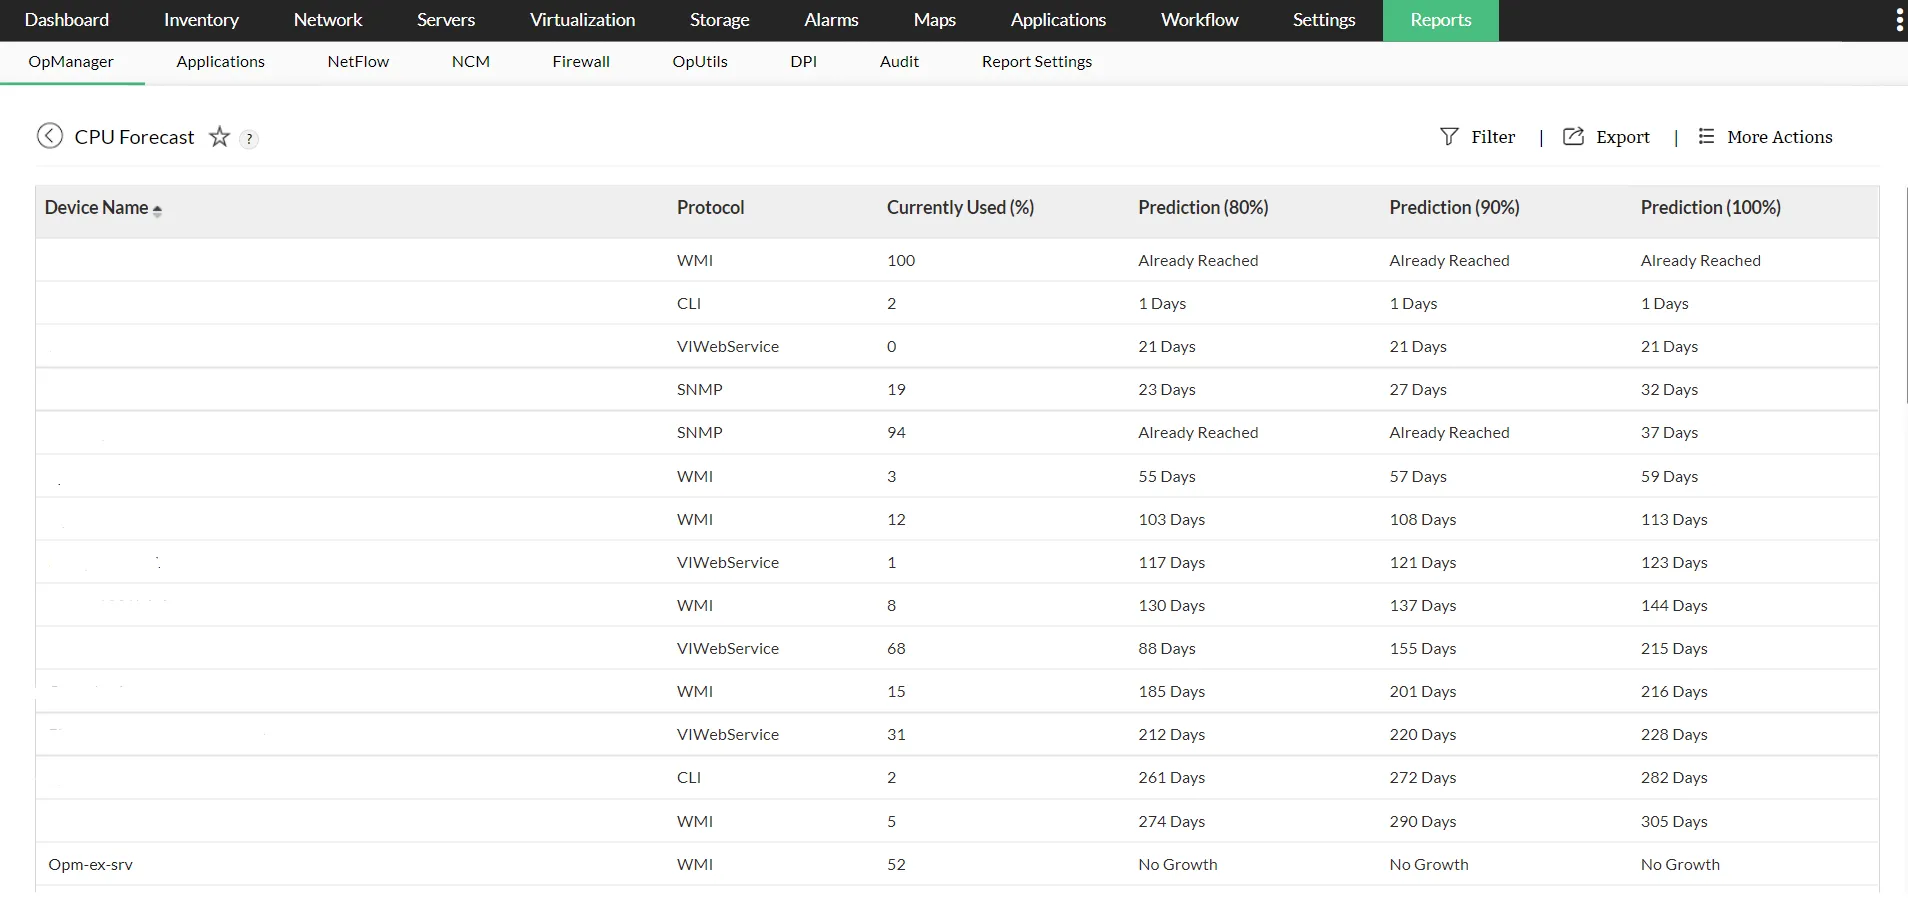
#### Predictive forecasting to plan capacity with confidence
OpManager provides forecasting for CPU, memory, disk, bandwidth, and device growth. Nagios XI includes basic capacity graphs but lacks multi-metric or ML-driven forecasting.
## OpManager, in a minute-and-a-half
Eliminate network bottlenecks and minimize unplanned downtime with an all-in-one monitoring console. OpManager's historic, real-time, and predictive insights can help you improve performance across your network, server, and storage systems.
## Disclaimer
**Disclaimer:**
This page highlights ManageEngine OpManager as an alternative to Nagios XI. This page is compiled from the information available on Nagios XI's website. We have made every attempt to ensure the accuracy and reliability of the information provided. However, the information is provided "as is" without warranty of any kind. ManageEngine is not liable for any inaccuracies in the page due to changes made on Nagios XI's website or any development made to Nagios XI's product subsequent to the date of publication of this page. Please refer Nagios XI's website for more information.
## Related Products
- [Network Monitoring](https://www.manageengine.com/network-monitoring/?relPrd)
- [Bandwidth Monitoring & Traffic Analysis](https://www.manageengine.com/products/netflow/?relPrd)
- [Network Configuration Management](https://www.manageengine.com/network-configuration-manager/?relPrd)
- [Switch Port & IP Address Management](https://www.manageengine.com/products/oputils/?relPrd)
- [Firewall Management](https://www.manageengine.com/products/firewall/?relPrd)
- [Network Monitoring Software for MSPs](https://www.manageengine.com/network-monitoring-msp/?relPrd)
- [IT Operations Management](https://www.manageengine.com/it-operations-management/)
- [Application Performance Monitoring](https://www.manageengine.com/products/applications_manager/?relPrd)