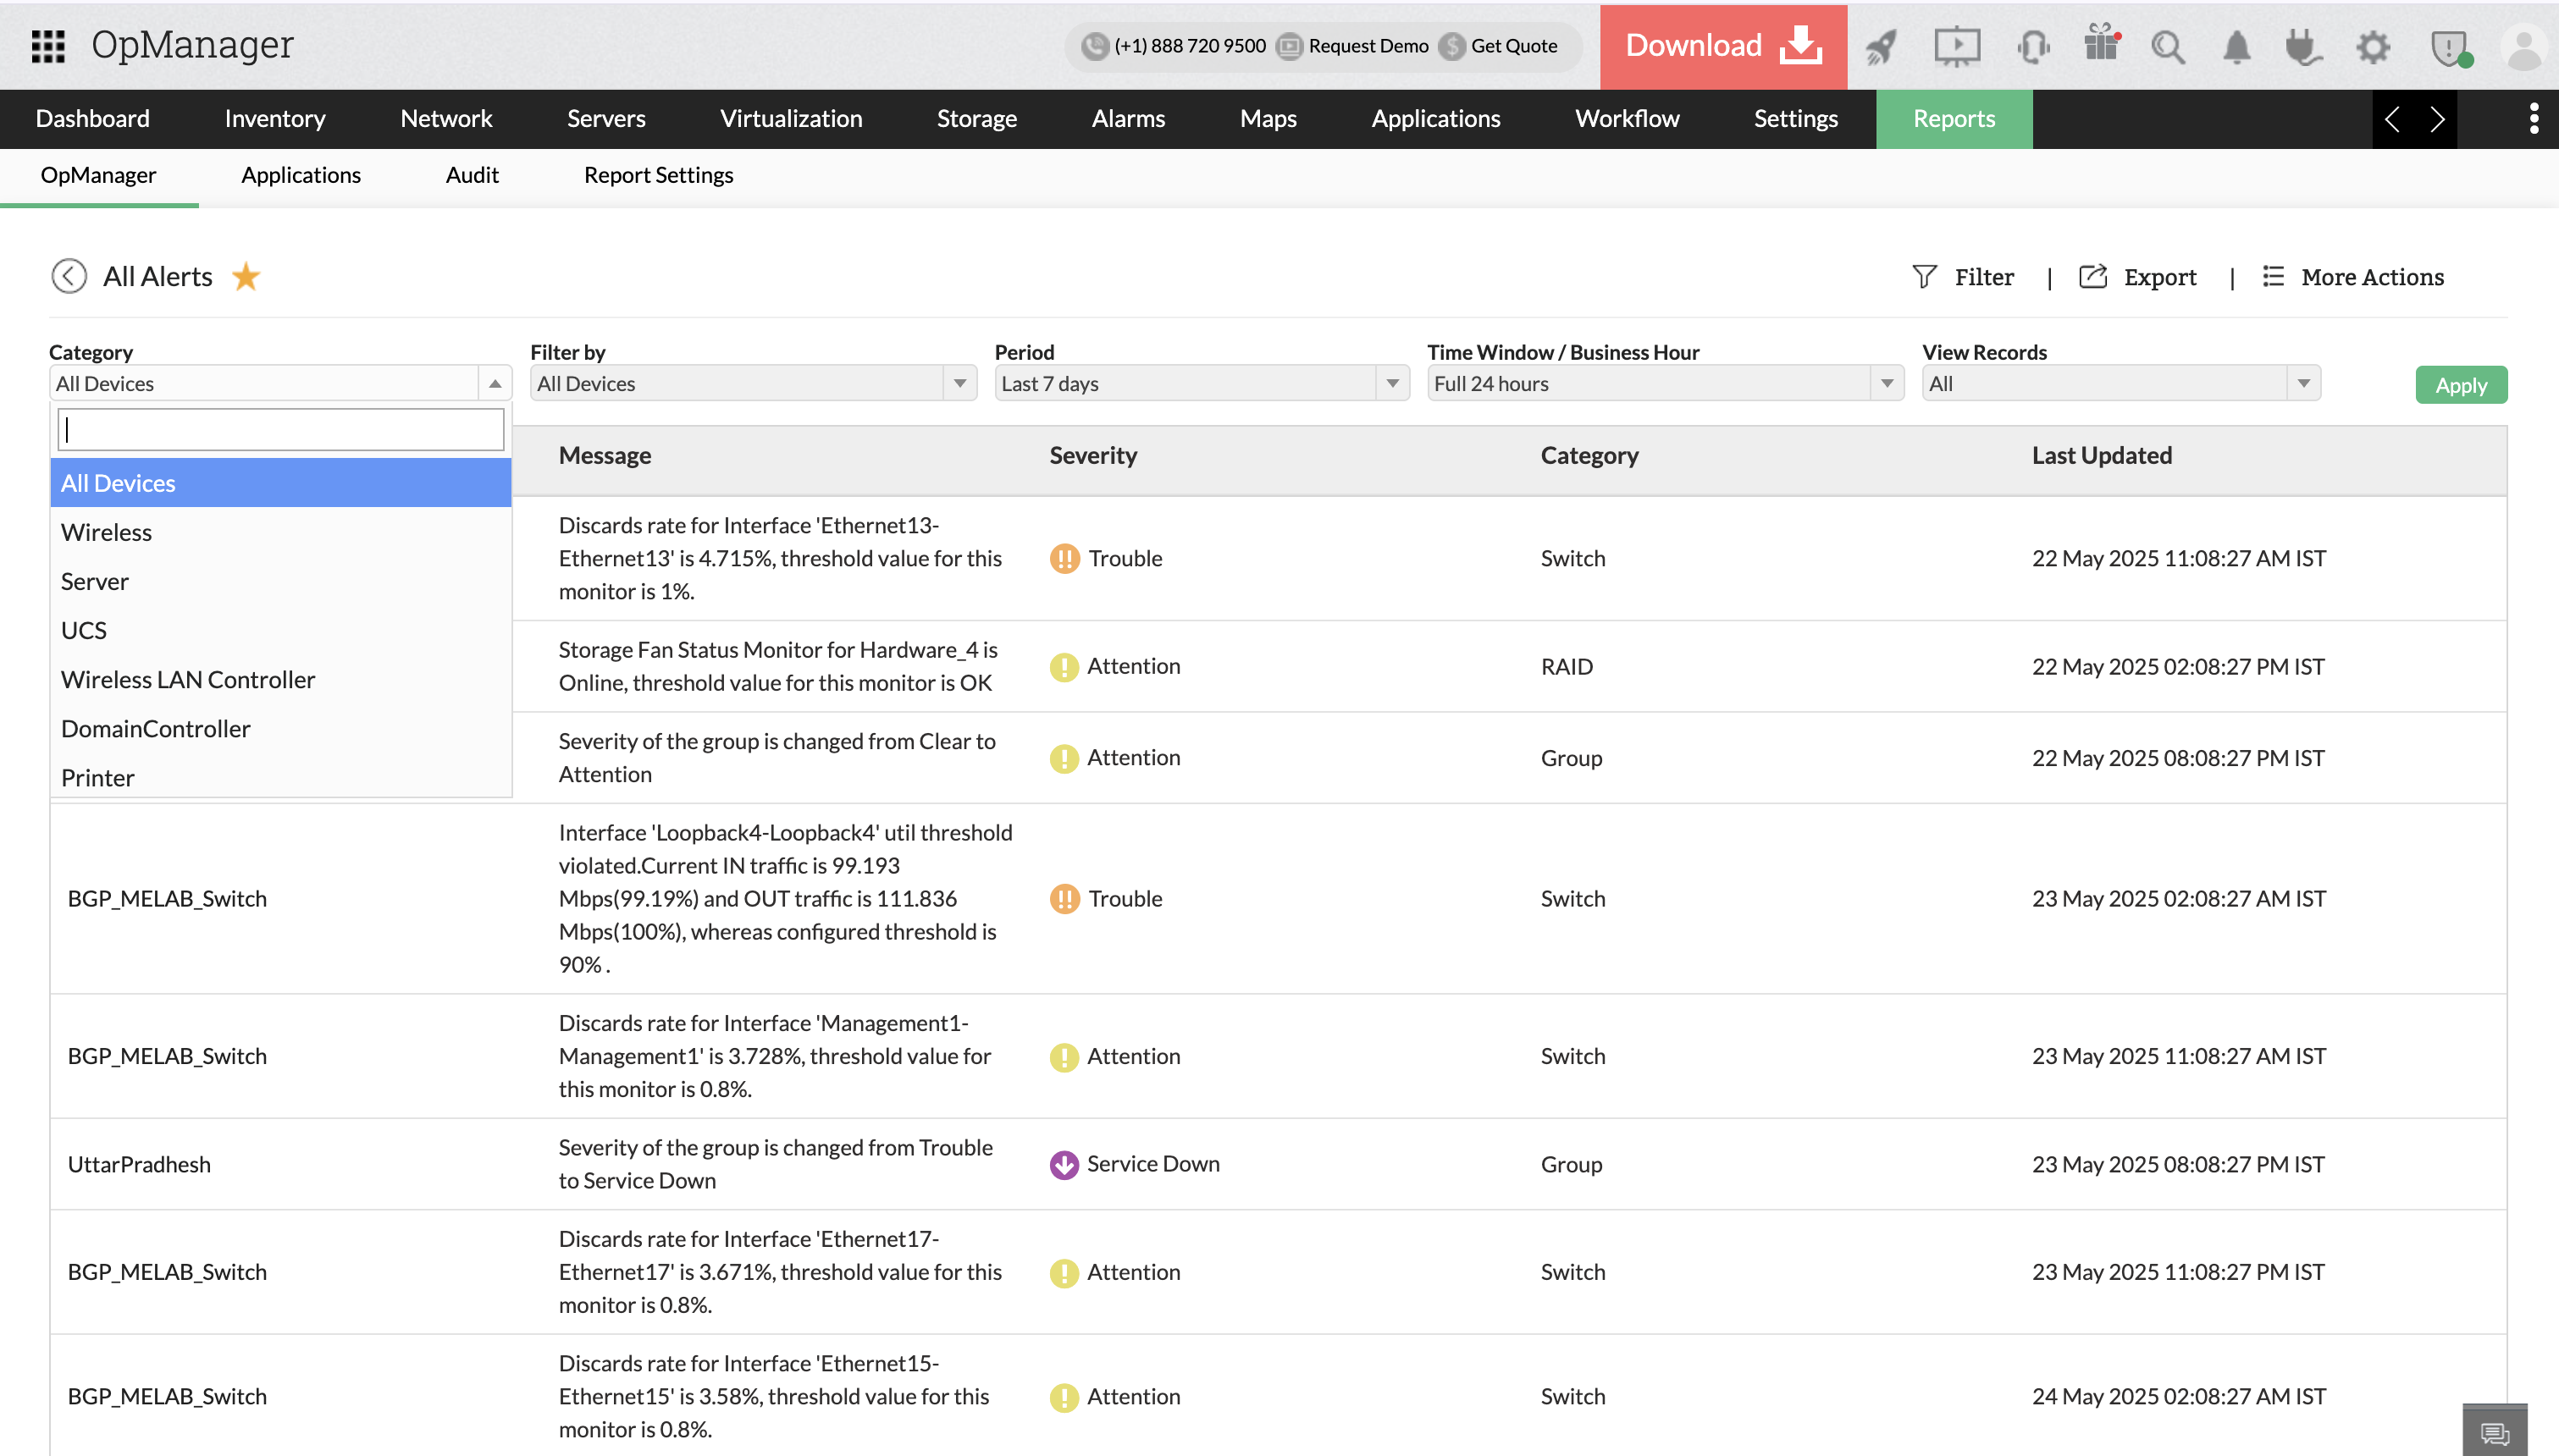
Available Filters in OpManager Reports
OpManager generates a wide variety of reports covering performance, availability, forecasting, and utilization metrics across network devices. With large volumes of data being collected from numerous sources over time, it becomes essential to extract only the most relevant information for effective analysis and decision-making.This is where filters come into play.
Filters in Reports
Filters in OpManager reports allow users to narrow down and customize the dataset they wish to analyze. Instead of wading through all available data, users can focus only on what matters most—based on devices, time, site, or specific performance parameters.
List of Available Filters and Their Uses
| Filter | Description |
|---|---|
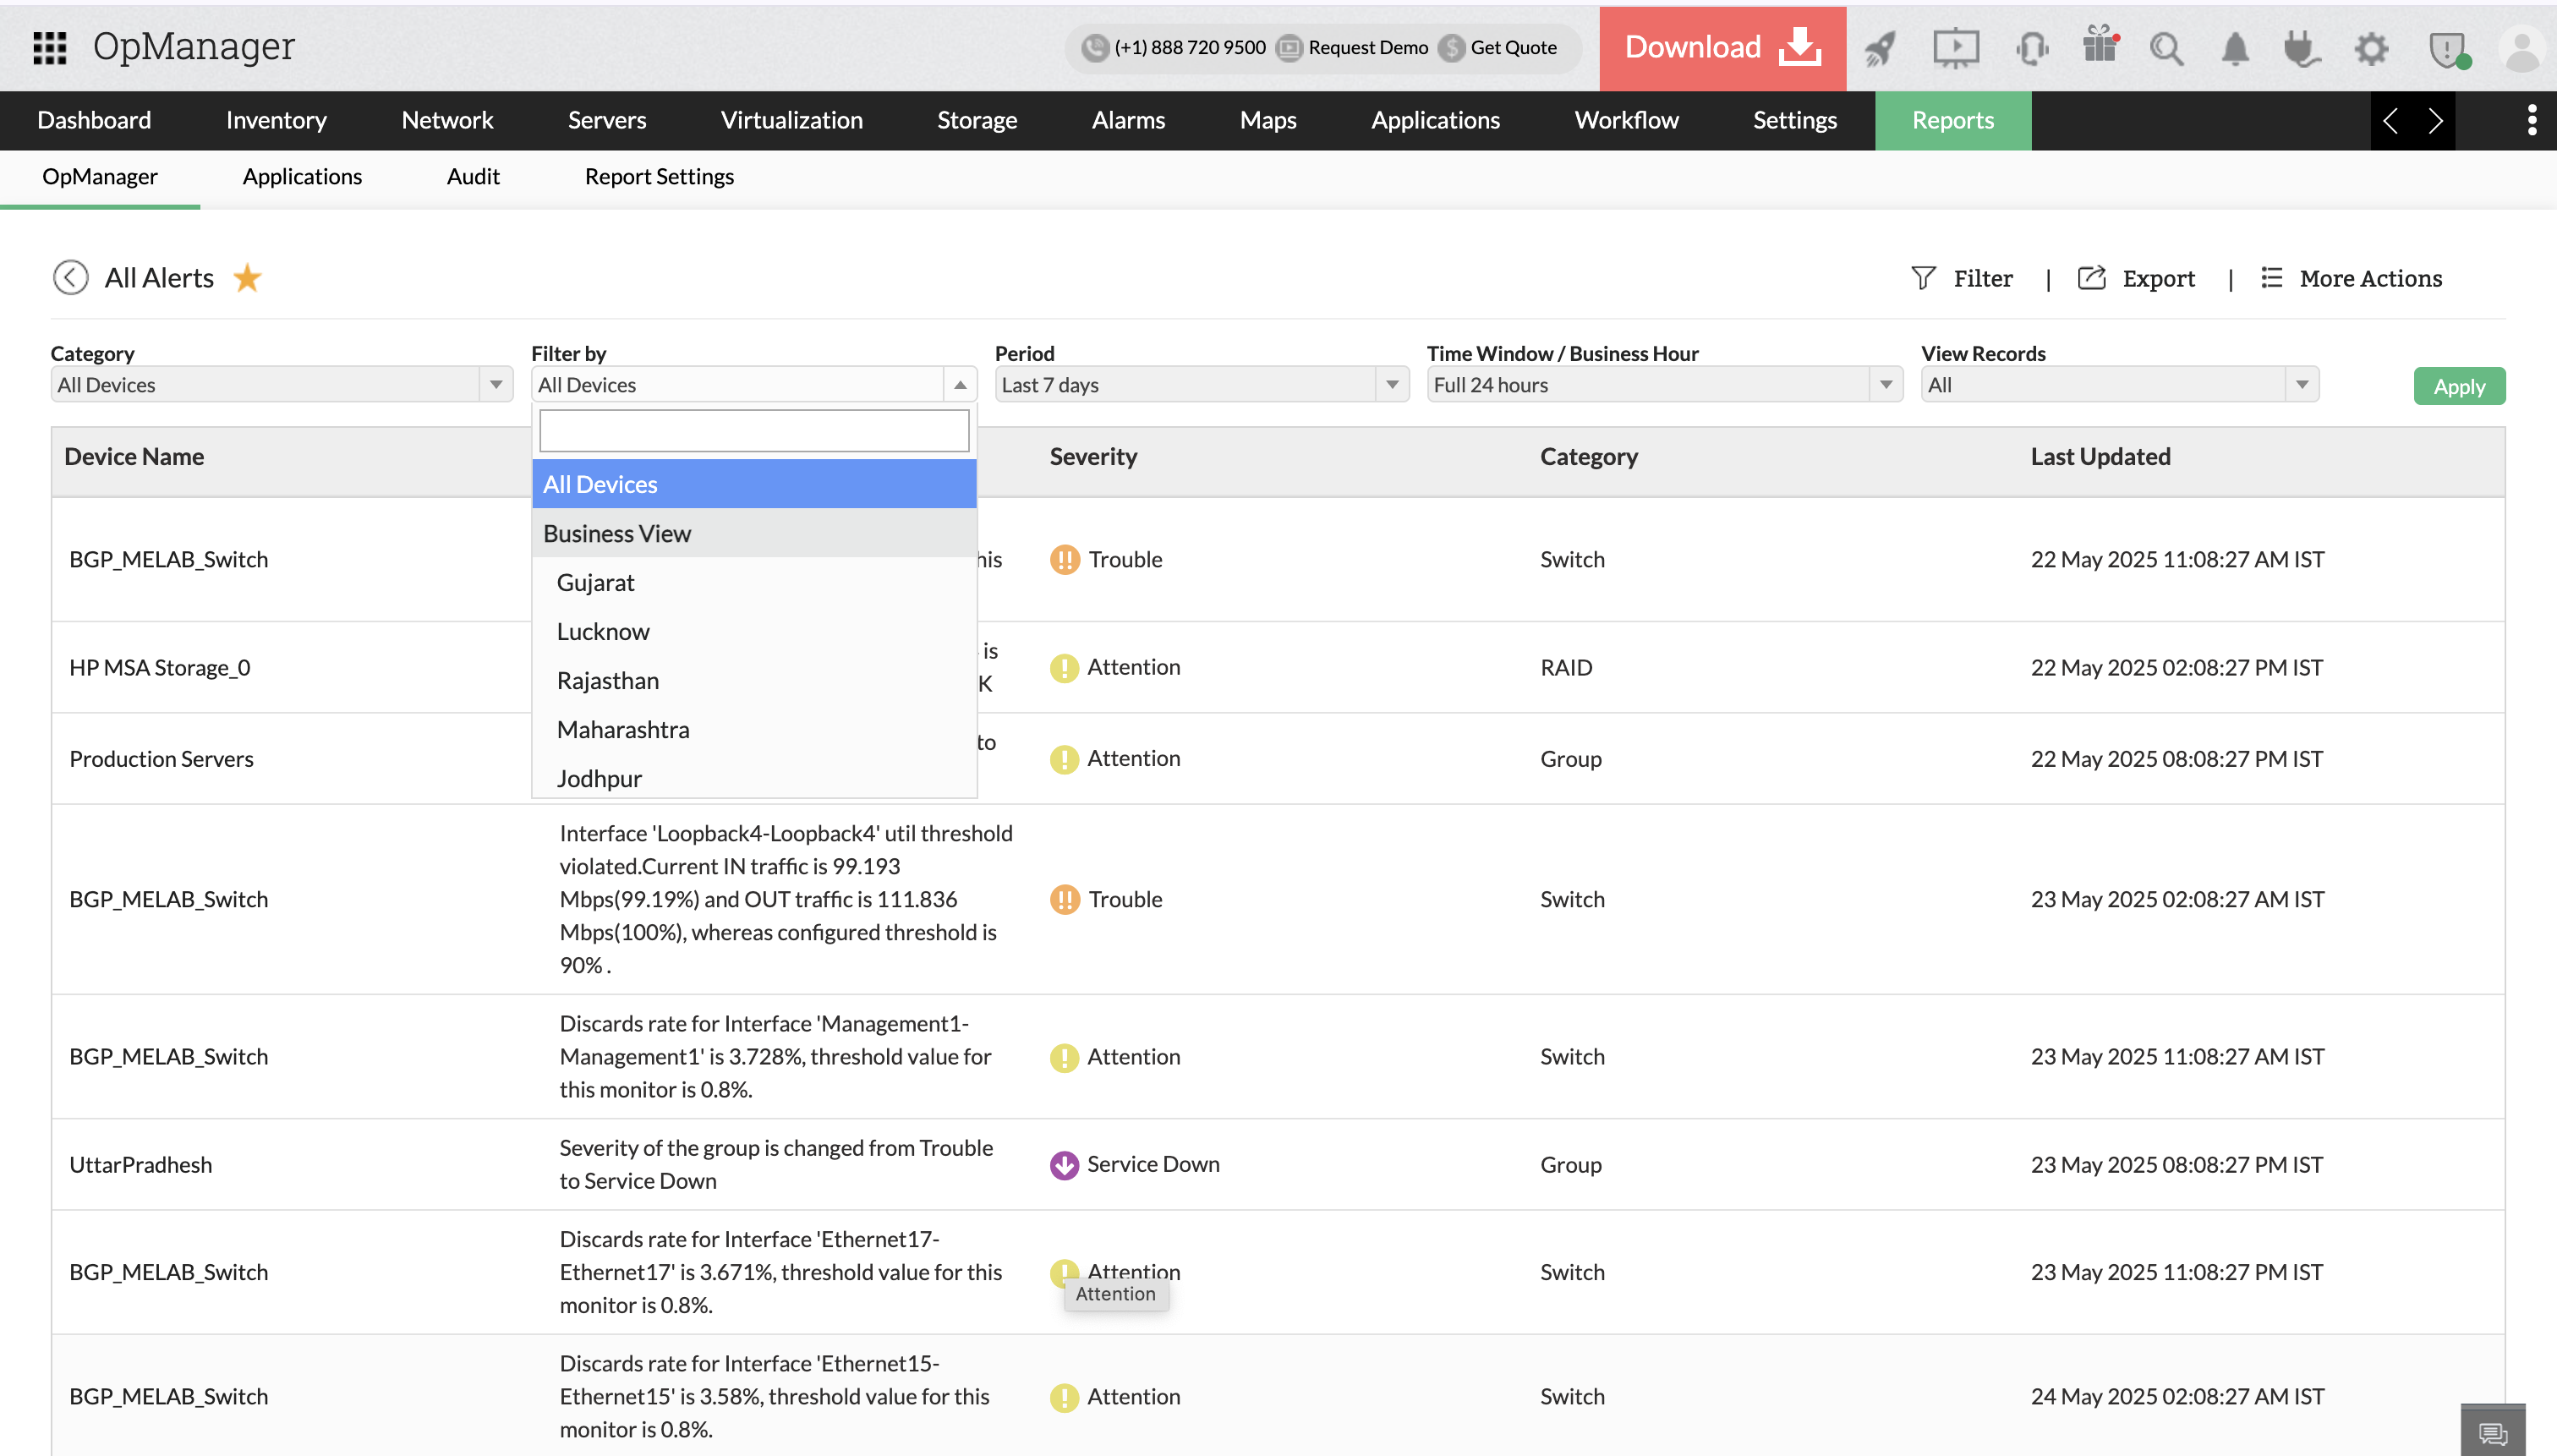
| Filter by | View data for all devices or narrow it down to a specific Business View or Logical Group. |
| Category | Filter devices based on type, such as Servers, Wireless, UCS, Printers, etc. |
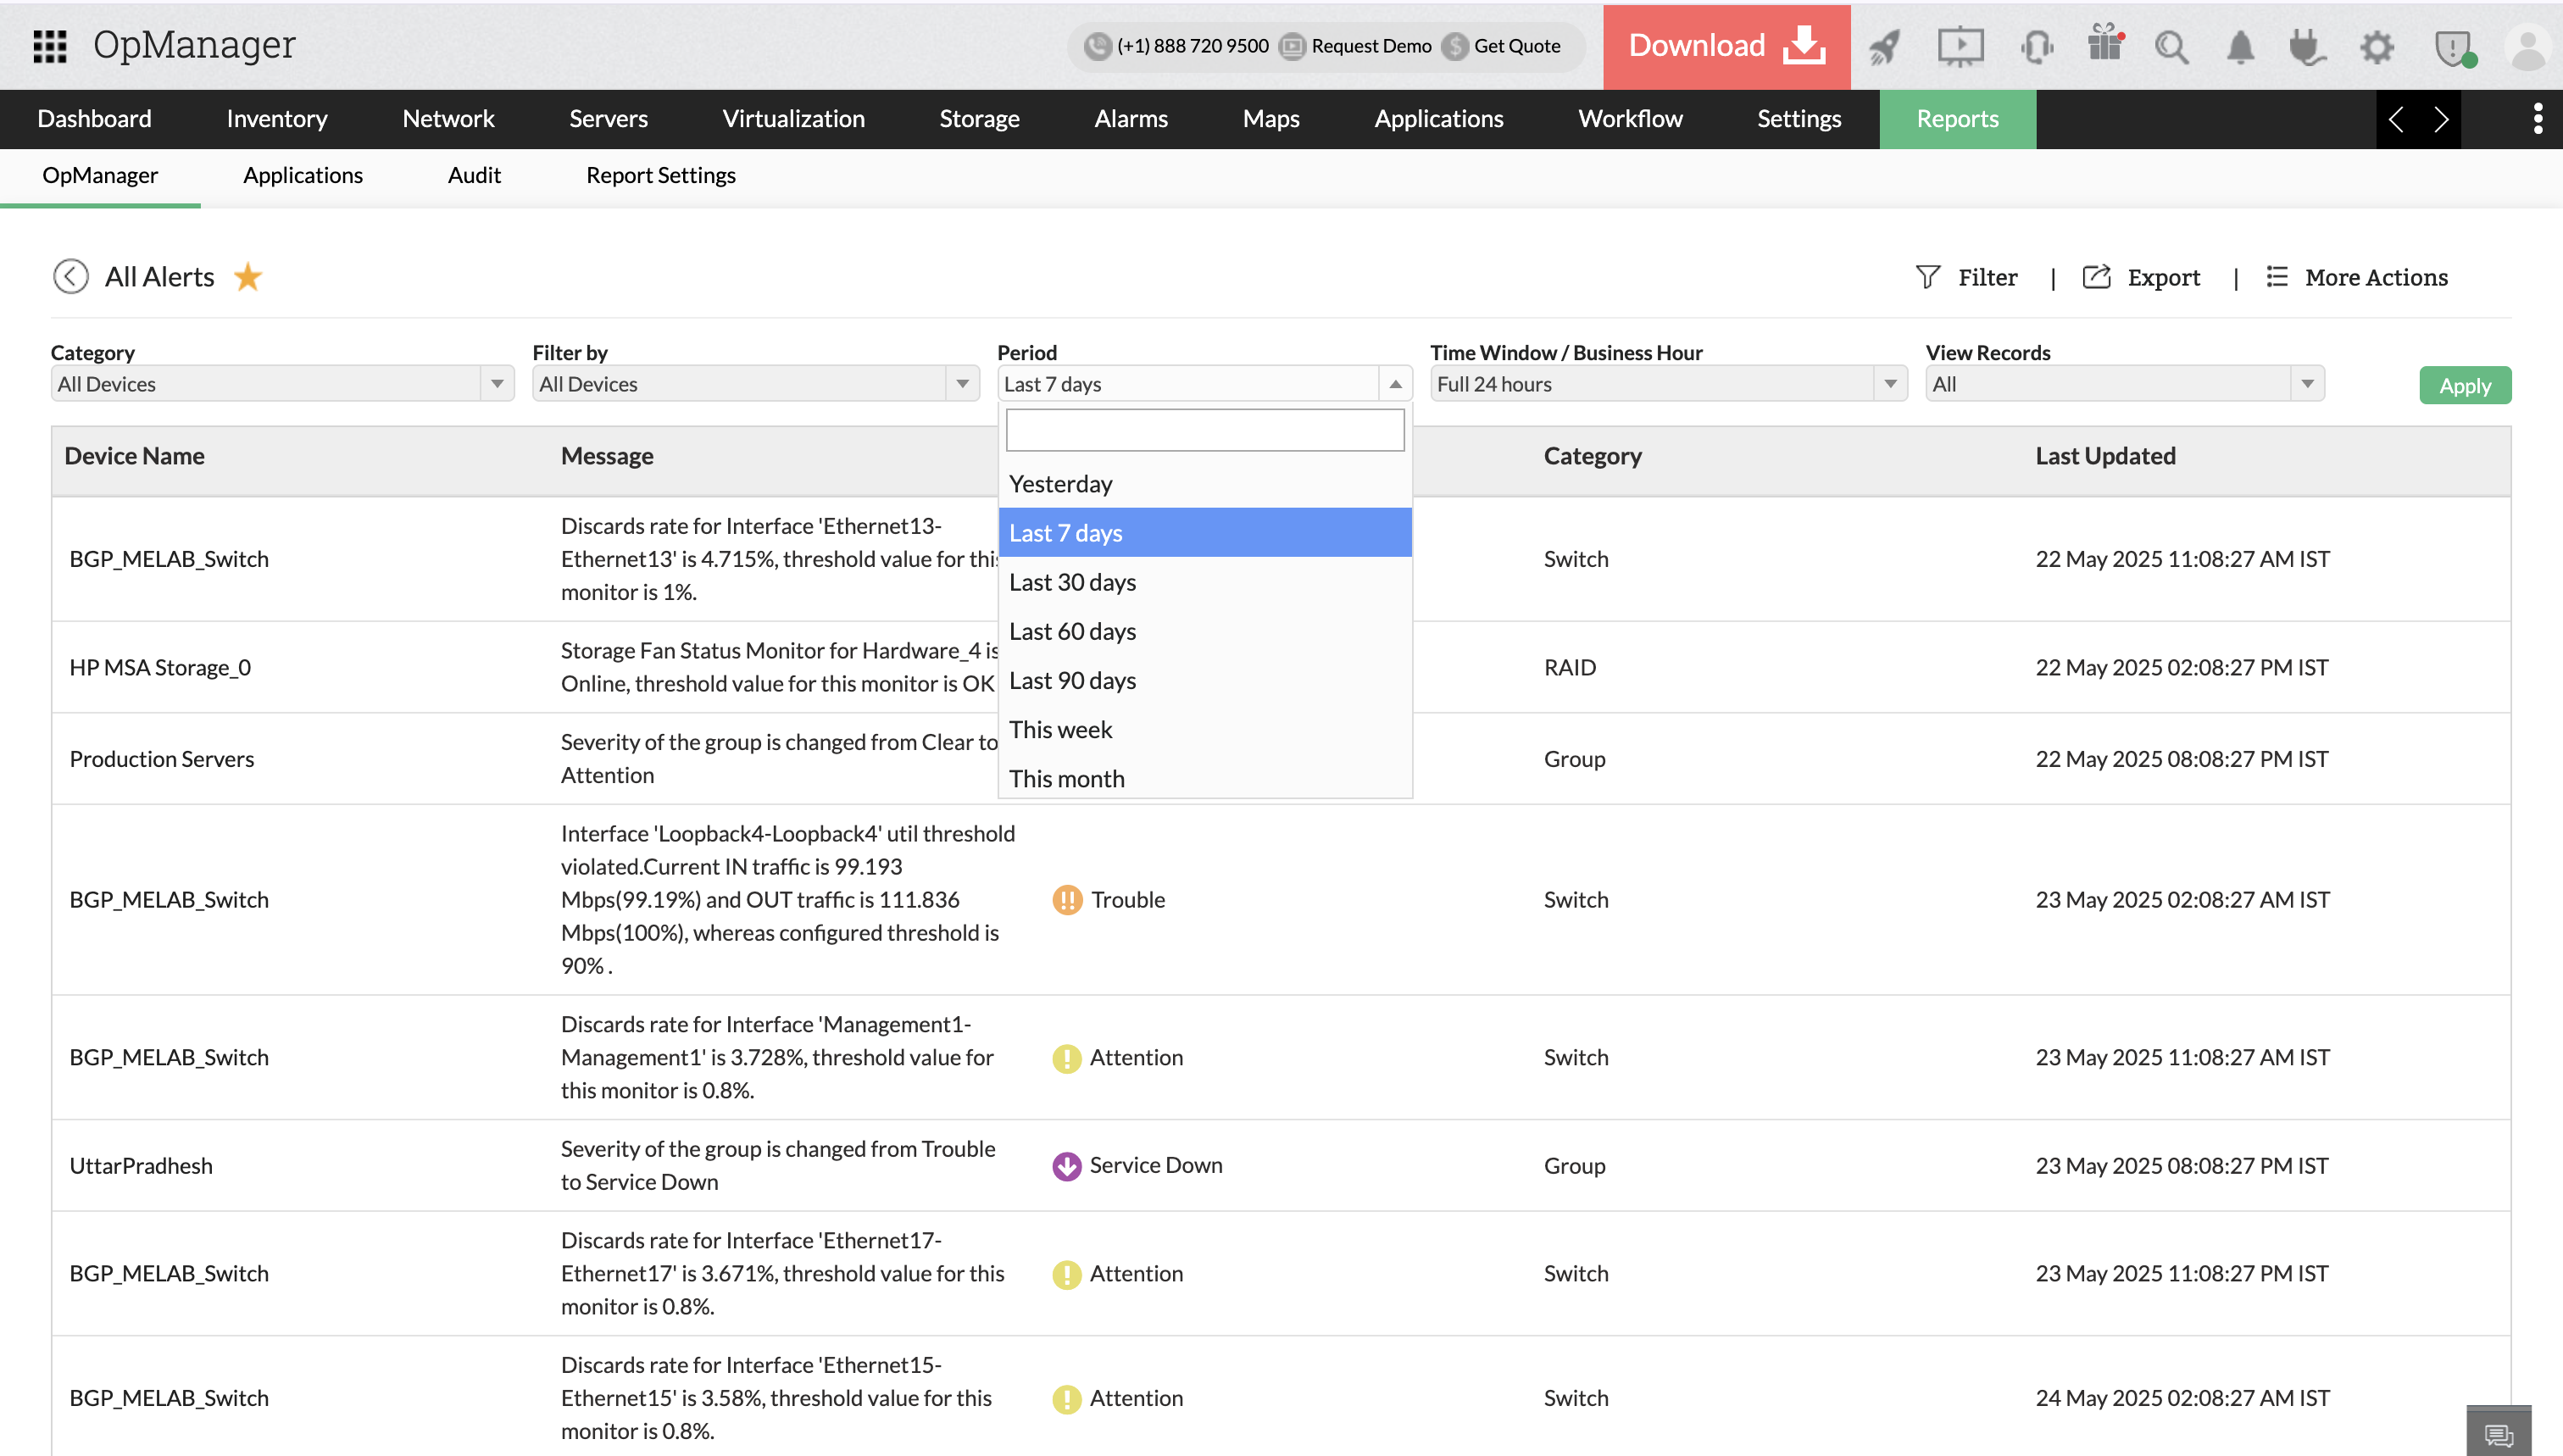
| Period | View data across defined time ranges like Last 1 hour to Last 90 days, or even future periods for forecasting reports. |
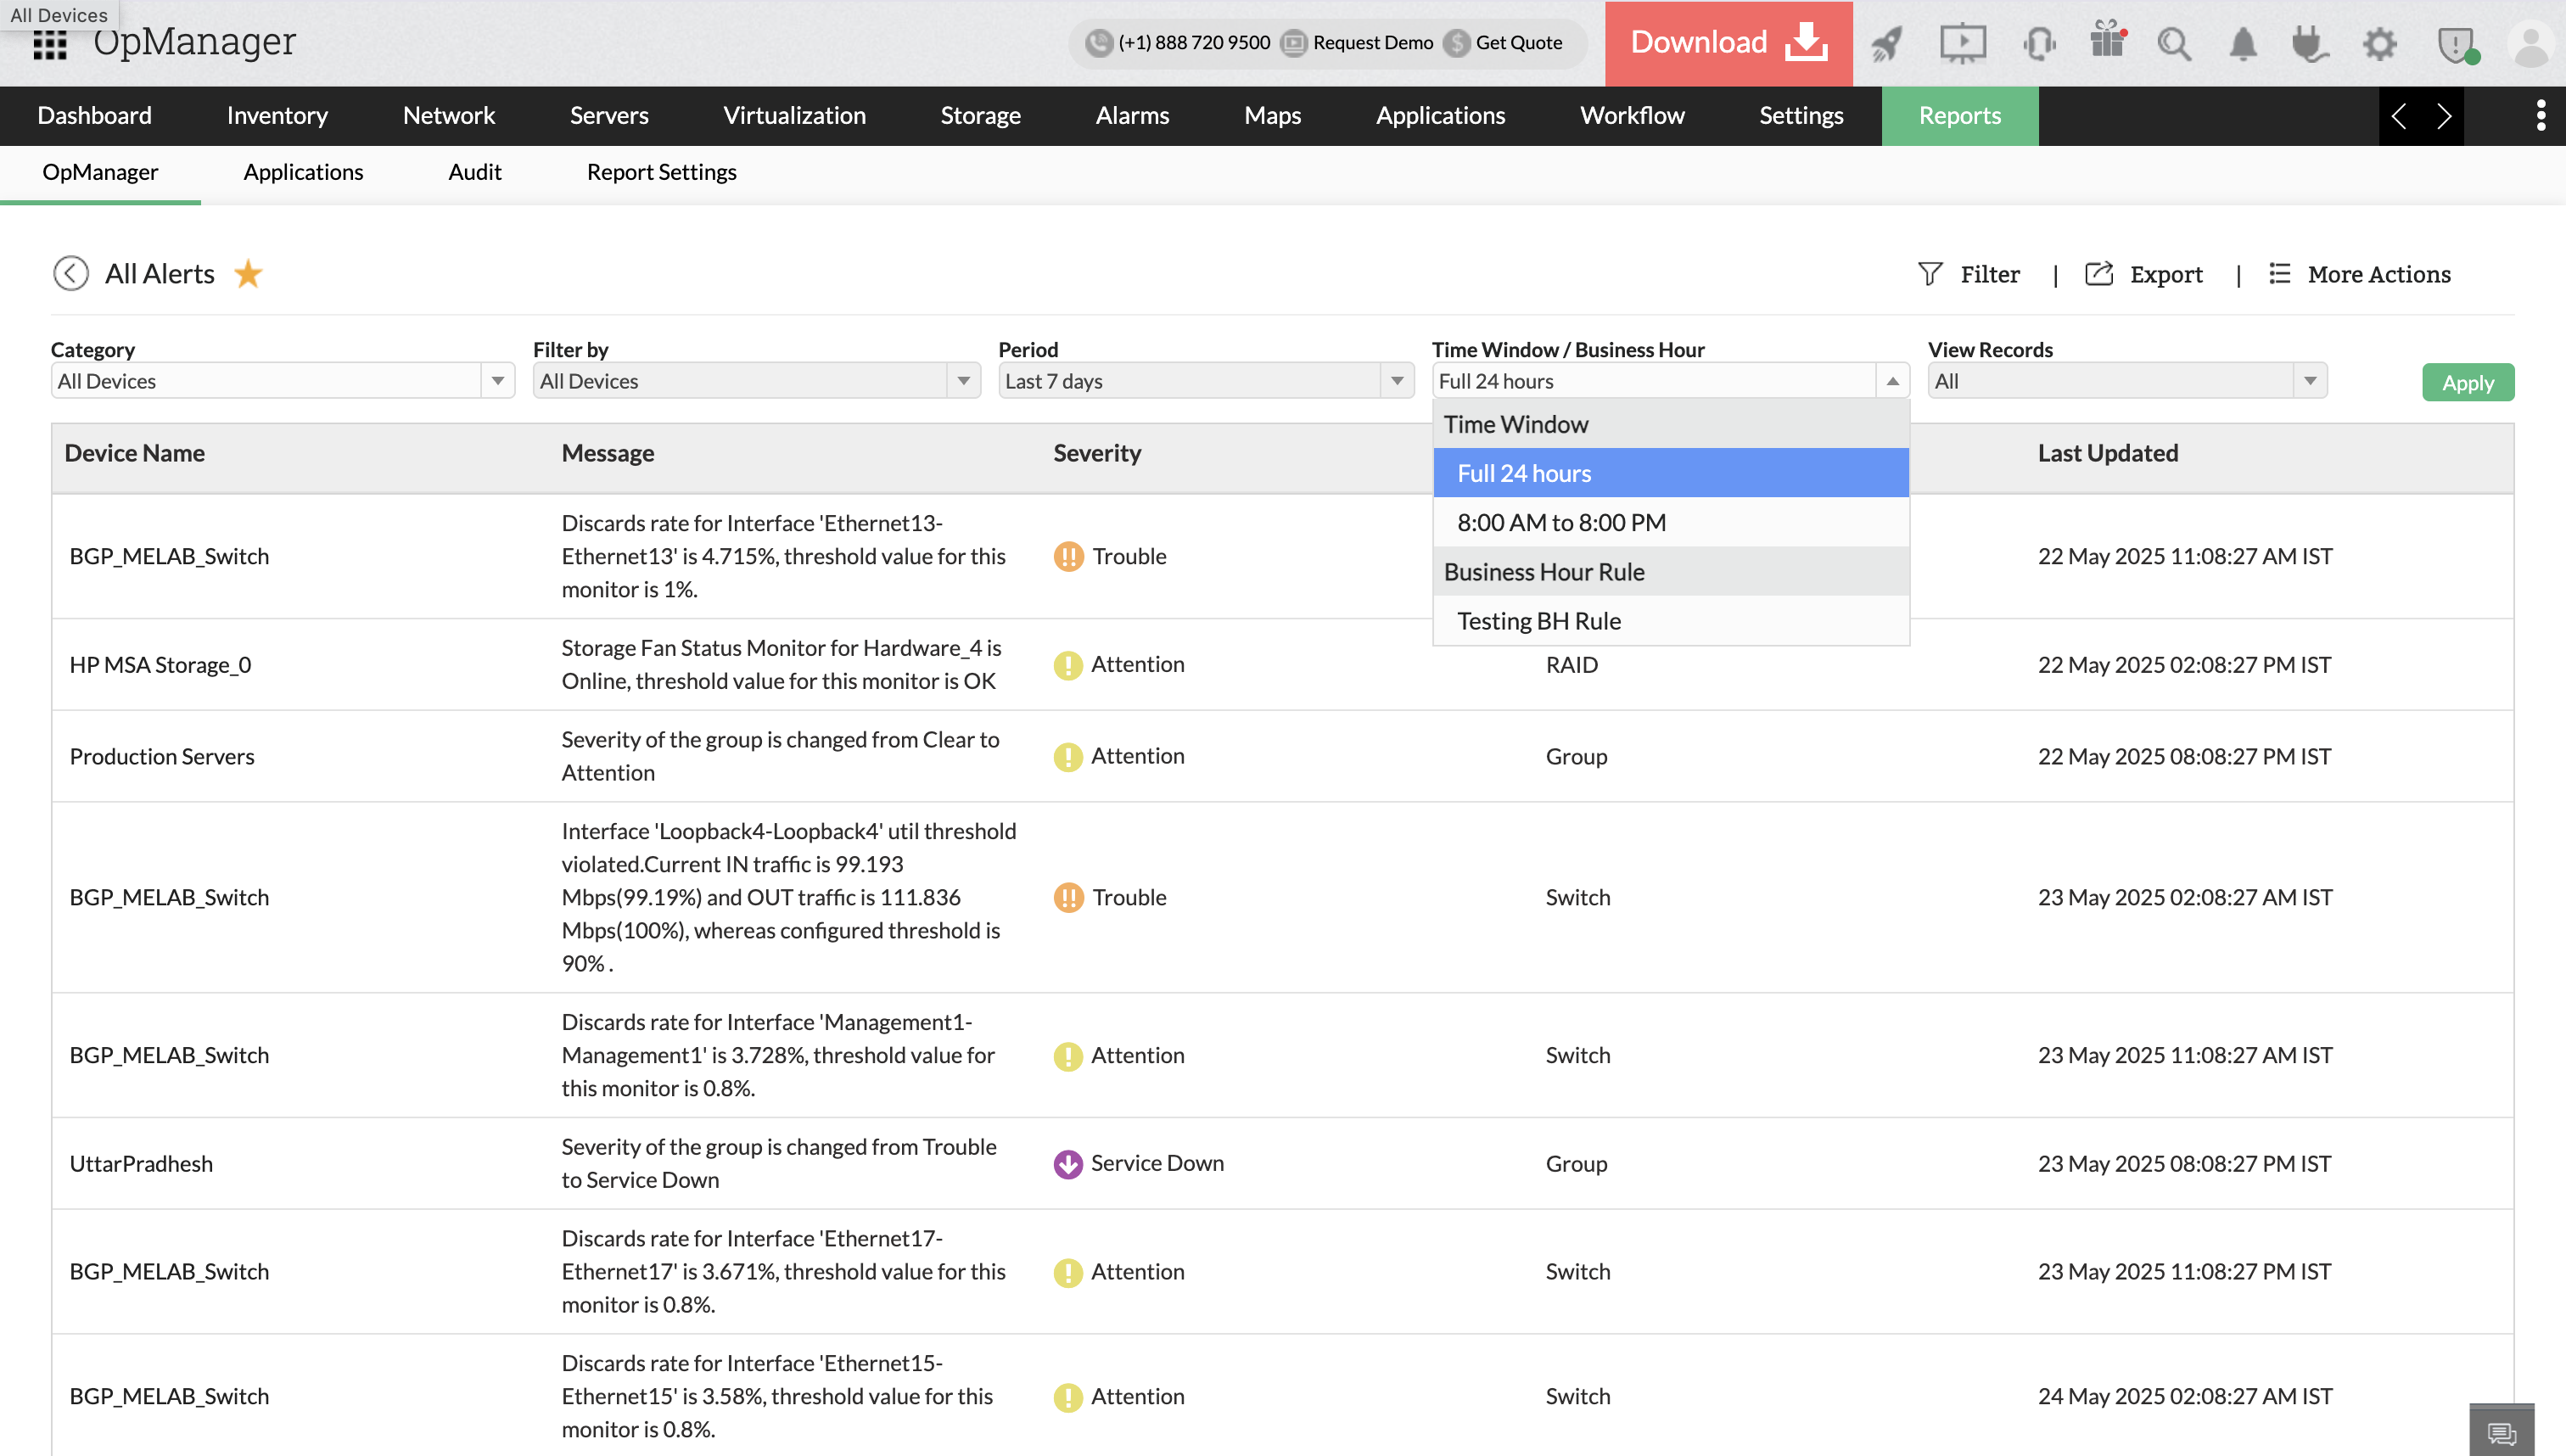
| Time Window / Business Hour | Focus on data within working hours, custom business hours, or entire 24-hour windows. |
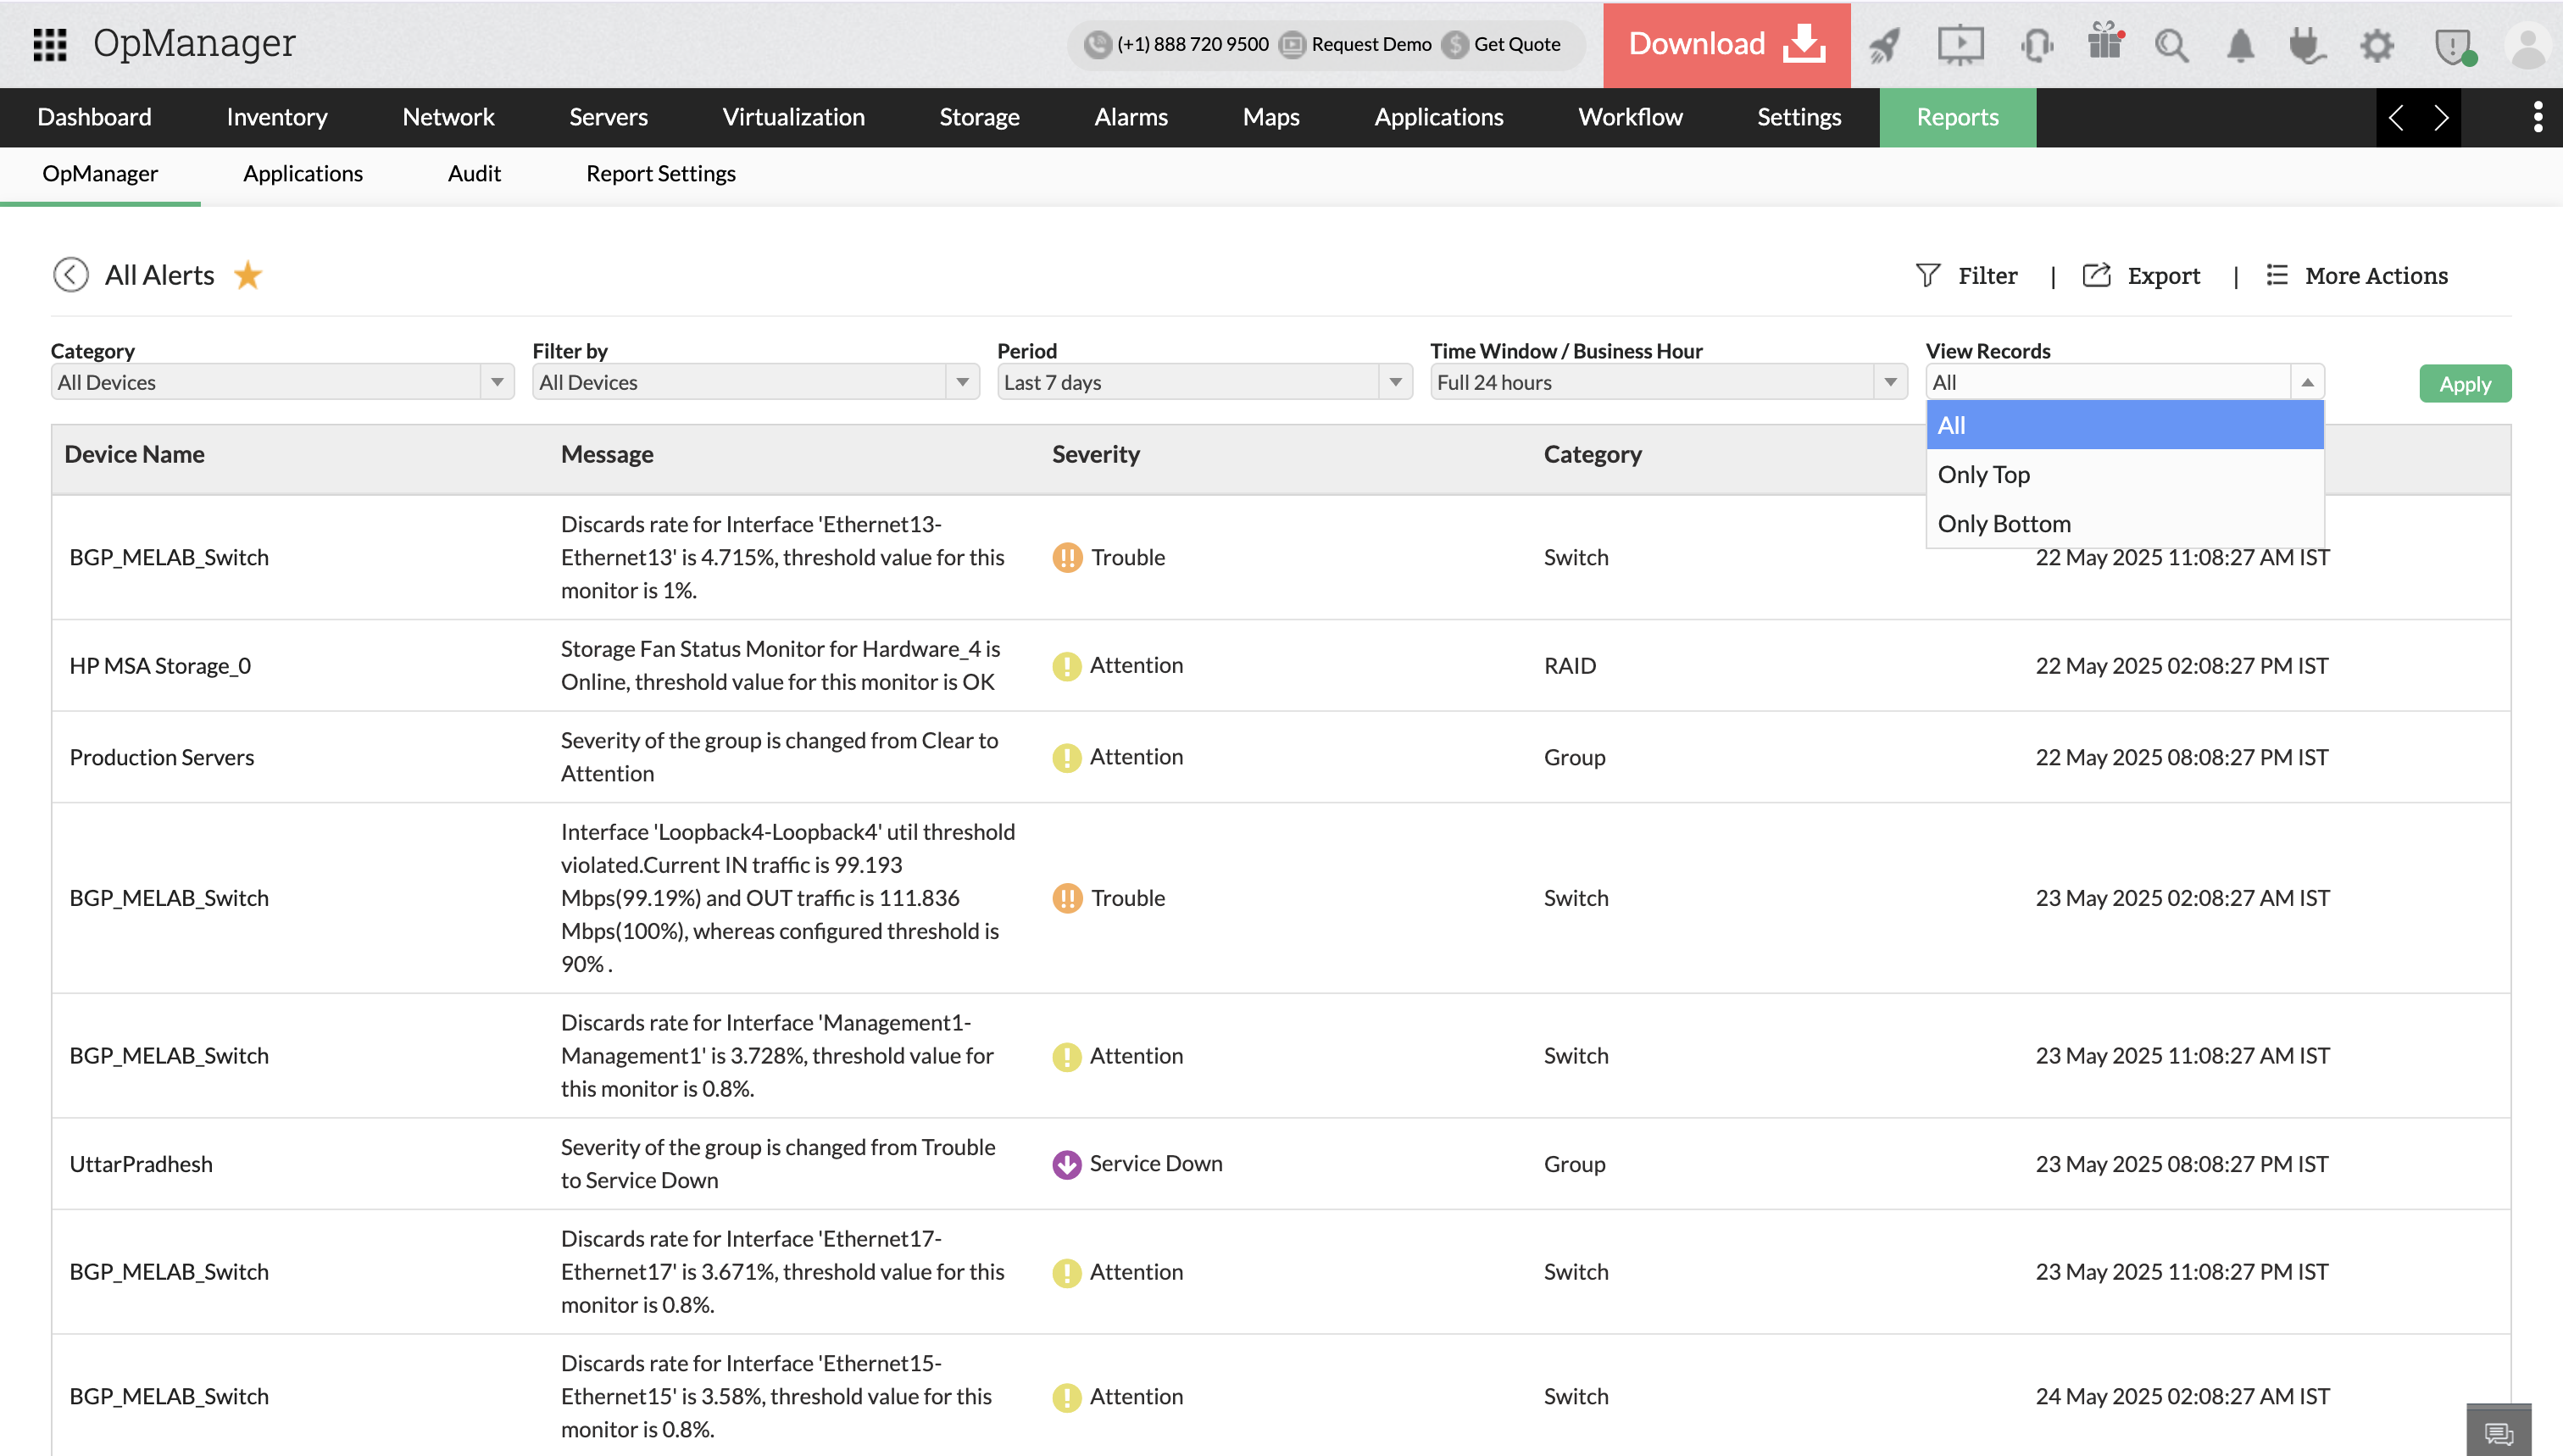
| View Records | Display only the Top N or Bottom N records based on chosen metrics. |
| Monitors | Focus the report only on specific performance monitors (e.g., CPU, Memory, RTT). |
| Devices | Include data from only selected devices. |
| Perf Group | The Perf Group is a collection of related performance monitors grouped together, useful for creating custom reports. Perf Group reports is available in in few default reports as well. |
| Value Types | OpManager collects device performance data at regular intervals (detailed statistics) and aggregates it hourly using Minimum, Maximum, and Average value types. These value types help visualize metrics like lowest CPU usage, peak memory usage, and average disk I/O. |
| Sites (Enterprise Edition) | Filter reports for a specific probe/site. |
| Customers (MSP Edition) | Generate reports for a particular customer. |
| Event type | Event type allows users to select specific event categories to view. It helps in quickly isolating and analyzing relevant network events. |
Click here to know more about Report Settings in OpManager.
