Forecast Reports
Forecast Reports in OpManager provide predictive insights into device resource utilization trends, enabling proactive capacity planning. These reports estimate when monitored resources—CPU, memory, and disk—are likely to reach defined thresholds, helping you prevent performance degradation and outages.
To access Forecast Reports, navigate to Reports → Forecast Reports.
Forecast Report types
| Report Name | Description | Available Columns | Available Filters |
|---|---|---|---|
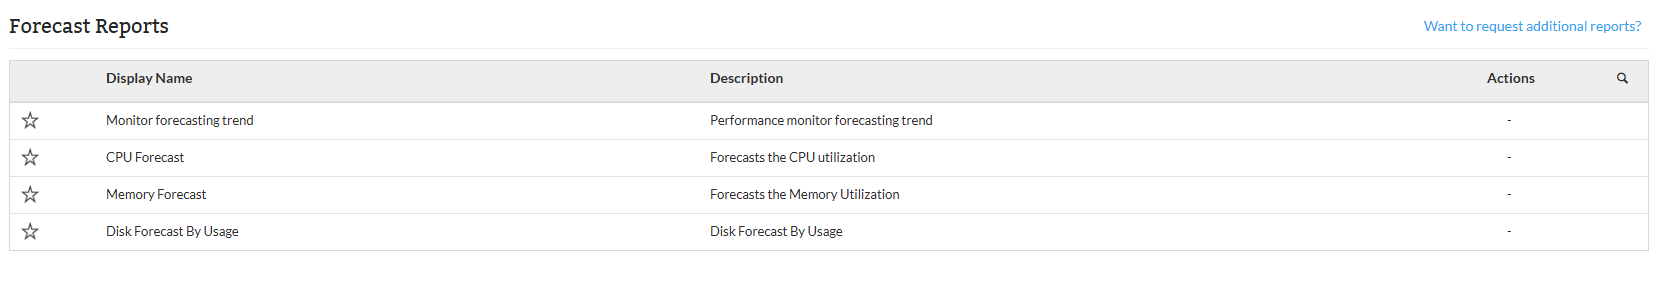
| Monitor Forecasting Trend | This report provides predictive insights into various performance metrics (monitors) of a selected device over a specified future period. Using historical data and trend analysis, it forecasts expected values for each monitor, helping users anticipate performance behaviors such as usage spikes, drops, or consistent trends. This enables proactive capacity planning, system optimization, and timely preventive measures to avoid potential issues. | Date and Time, Data Collected Value, Expected Value | Device Name, Monitors, Period |
| CPU Forecast | This report provides predictions on when the CPU usage of monitored devices will reach critical levels (80%, 90%, and 100%). It helps in forecasting potential performance issues by indicating the time frame within which CPU usage will peak, allowing administrators to take necessary actions to avoid overloads. The report helps in proactive system management and capacity planning. | Device Name, Protocol, Currently Used (%), Prediction (80%), Prediction (90%), Prediction (100%) | Category, Filter by |
| Memory Forecast | This report provides forecasts on when the memory usage of monitored devices will reach critical levels (80%, 90%, and 100%). By predicting when memory usage will peak, it allows administrators to take proactive measures before systems become overburdened. This report helps in managing system resources and preventing performance degradation due to high memory utilization. | Device Name, Protocol, Currently Used (%), Prediction (80%), Prediction (90%), Prediction (100%) | Category, Filter by |
| Disk Forecast By Usage | This report predicts when the disk usage for different partitions on monitored devices will reach critical levels (80%, 90%, and 100%). It helps in understanding the rate of disk consumption and provides timelines for when specific partitions will hit capacity limits, allowing administrators to take necessary actions to prevent potential disk space issues, such as allocating more space or clearing unused data. | Device Name, Partition, Currently Used (%), Prediction (80%), Prediction (90%), Prediction (100%) | Category, Filter by |
- Device Name: The monitored device for which forecasting is calculated.
- Protocol: The protocol used to collect performance data.
- Currently Used (%): Current utilization of the resource (CPU/Memory/Disk).
- Prediction (80/90/100%): Estimated time until the resource reaches 80%, 90%, and 100% utilization.
- Partition: For disk forecasting, the specific storage partition being monitored.
- Date and Time: Timestamp of collected data (used in trend graphs).
- Data Collected Value: The actual value recorded by the monitor at the given time.
- Expected Value: The projected or modeled trend value.
Note:
- Forecast reports require consistent performance data over the last three days to generate predictions.
- If longer historical data is available, OpManager uses up to 14 days of data to improve model accuracy.
Users can apply various filters to narrow down reports, such as filtering by category, device, or time period. You can also export reports to PDF or Excel, schedule them for automated generation within defined business hours or time windows. Click here to know more about other report types in OpManager.