gNMI monitoring
OpManager introduces telemetry-based monitoring using gNMI, enabling efficient, model-driven data collection over gRPC. Unlike traditional SNMP polling, telemetry supports both dial-in and dial-out models, with a roadmap toward streaming-based monitoring. With support for secure communication using One-way TLS and certificate based mutual TLS, OpManager aligns with modern network observability standards adopted by leading vendors.
Prerequisites
Before configuring gNMI monitoring in OpManager, ensure that gNMI is enabled and properly configured on the target device.
How to add a gNMI credential
- Go to Settings → Discovery → Credentials.
- Click Add Credential.
- Select Credential Type as gNMI.
- Enter the required details:
- Profile Name
- Description
- Port Number
- Choose the required communication mode:
- One-Way TLS
- Certificate Based (mTLS)
- Plain Text
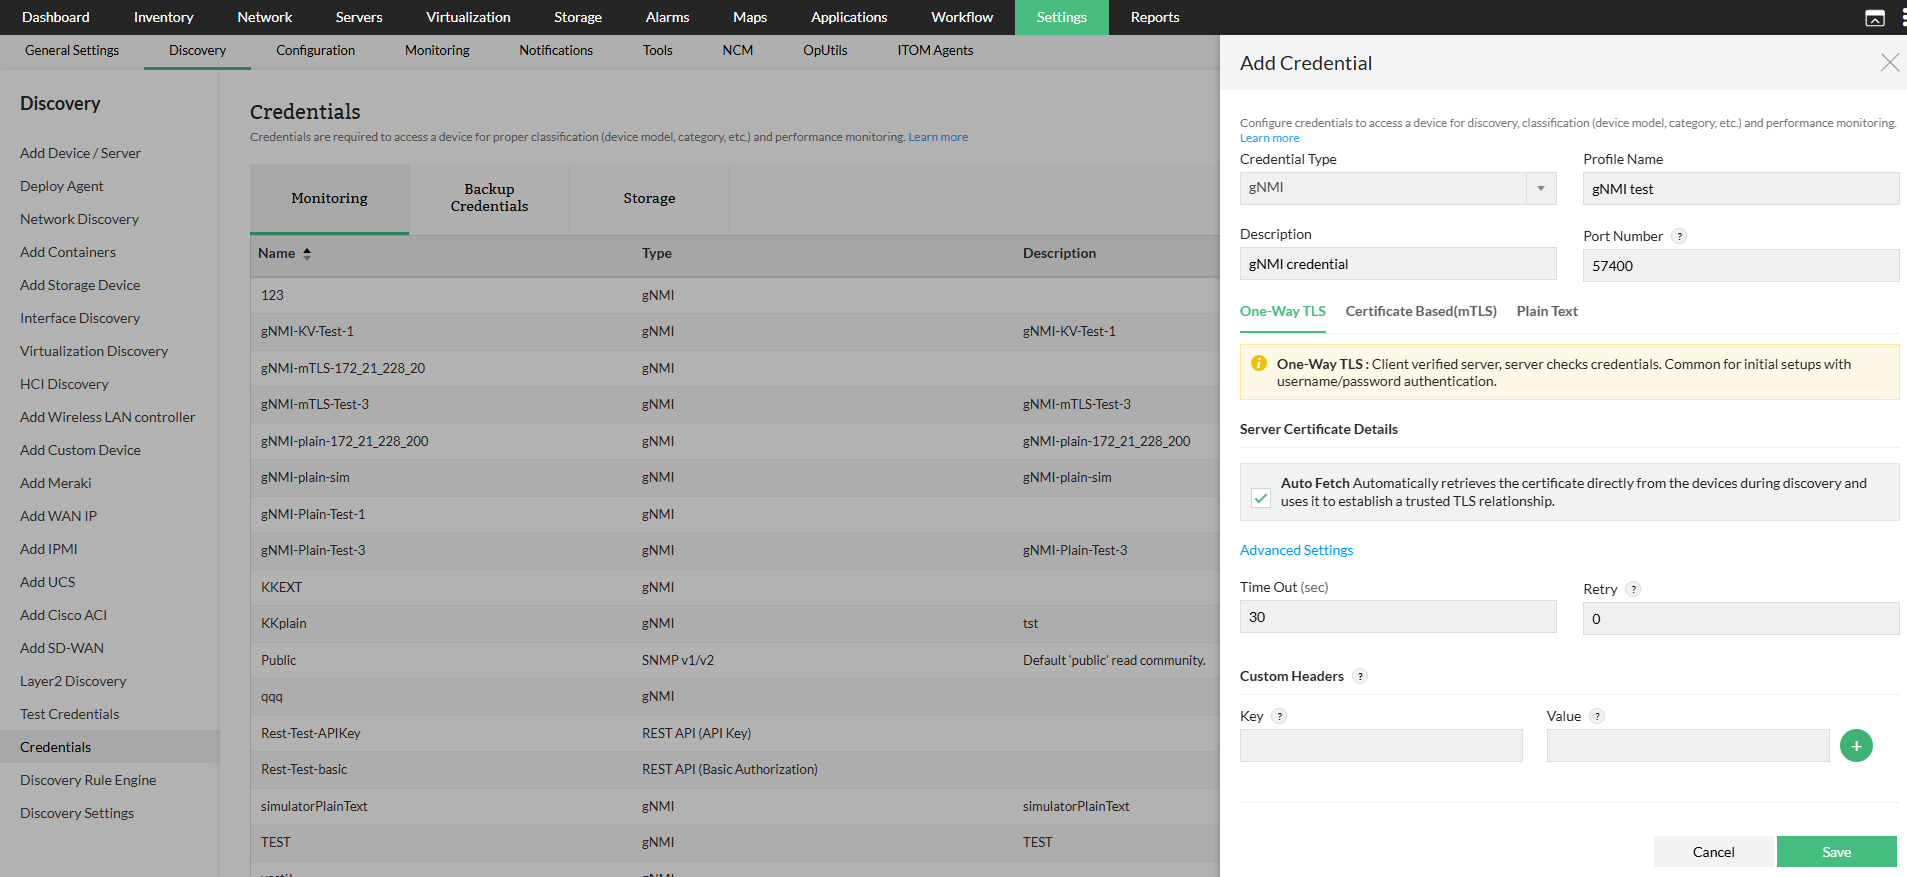
How to configure One-Way TLS
One-Way TLS secures communication by encrypting the channel and verifying the server's identity using a certificate. Configure the following fields to establish a secure gNMI connection:
- Port Number: Enter the port number used for gNMI communication.
- Server Certificate Validation: Configure how the server's SSL/TLS certificate should be validated during the connection using one of the following methods:
- Auto Fetch: Enable to automatically retrieve the server certificate during the initial connection.
- Upload Server Certificate: Upload the server certificate manually for validation.
- Hostname Override: Enter an alternate hostname for SSL/TLS validation when the certificate hostname does not match the device IP or domain used. This is useful in scenarios where the connection is made using an IP address or a different domain, but the server's SSL certificate is issued for another hostname.
- Authentication Headers: Provide the required authentication details, such as username and password.
- Timeout: Configure the maximum time to wait for a response before the request times out.
- Retry: Specify the number of retry attempts if the connection fails.
Certificate Based (mTLS)
mTLS provides mutual authentication where both OpManager and the device verify each other using certificates.
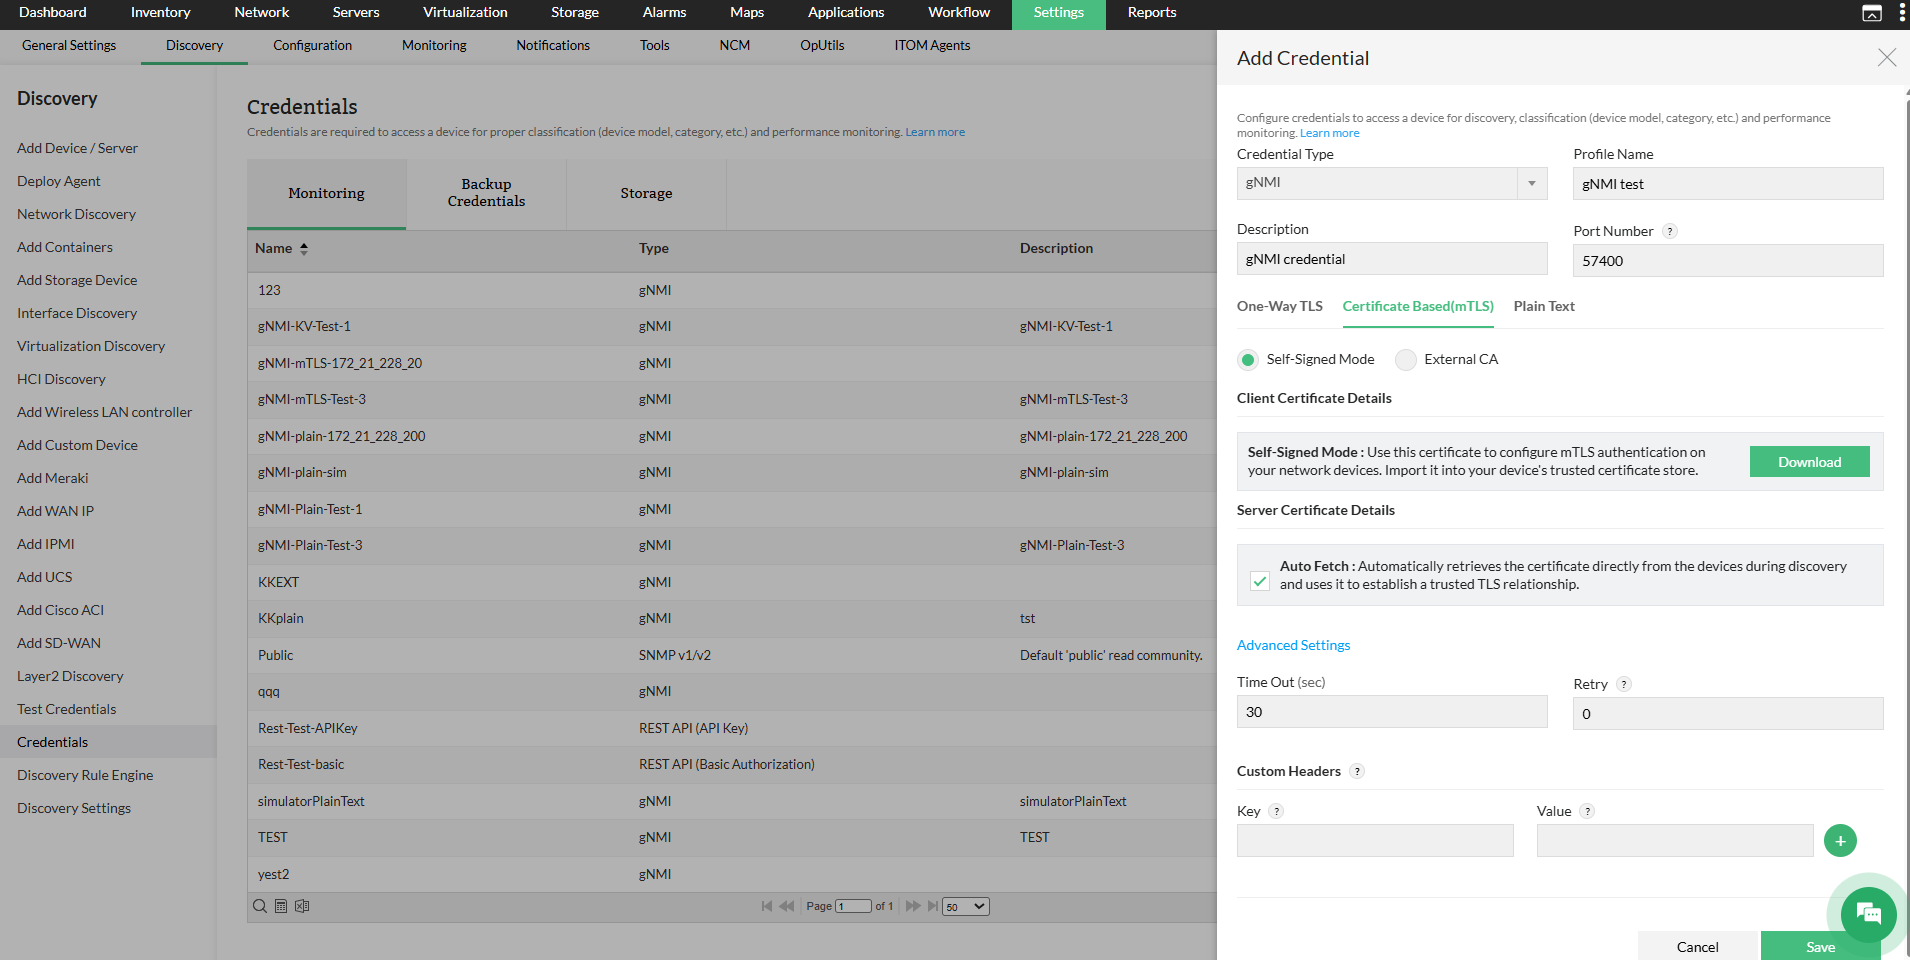
- Enter the Port Number for gNMI communication.
- Configure Server Certificate Validation:
- Enable Auto Fetch to automatically retrieve and trust the server certificate during discovery, or
- Upload the Server Certificate manually.
- Add the Client Certificate (OpManager certificate). Choose the client certificate type:
- Self-signed:
- Download the OpManager-generated certificate.
- Configure this certificate on the target device to establish trust.
- OpManager uses its internally maintained keystore for certificate management.
- Suitable for controlled environments or testing scenarios.
- External CA:
- Upload the Client Certificate issued for OpManager.
- Upload the corresponding Private Key.
- Upload the Intermediate/Root CA certificate chain.
- Ensure the same CA is configured and trusted on the end device.
- Supports enterprise-grade deployments with centralized certificate management.
- Self-signed:
- Provide authentication headers such as username and password if required.
- Configure optional parameters like Timeout and Retry under Advanced Settings.
Note: Only one certificate will be maintained in OpManager. The most recently uploaded certificate will be considered the default.
Plain Text
Plain Text mode allows communication without encryption or authentication. Data is transmitted directly over TCP.
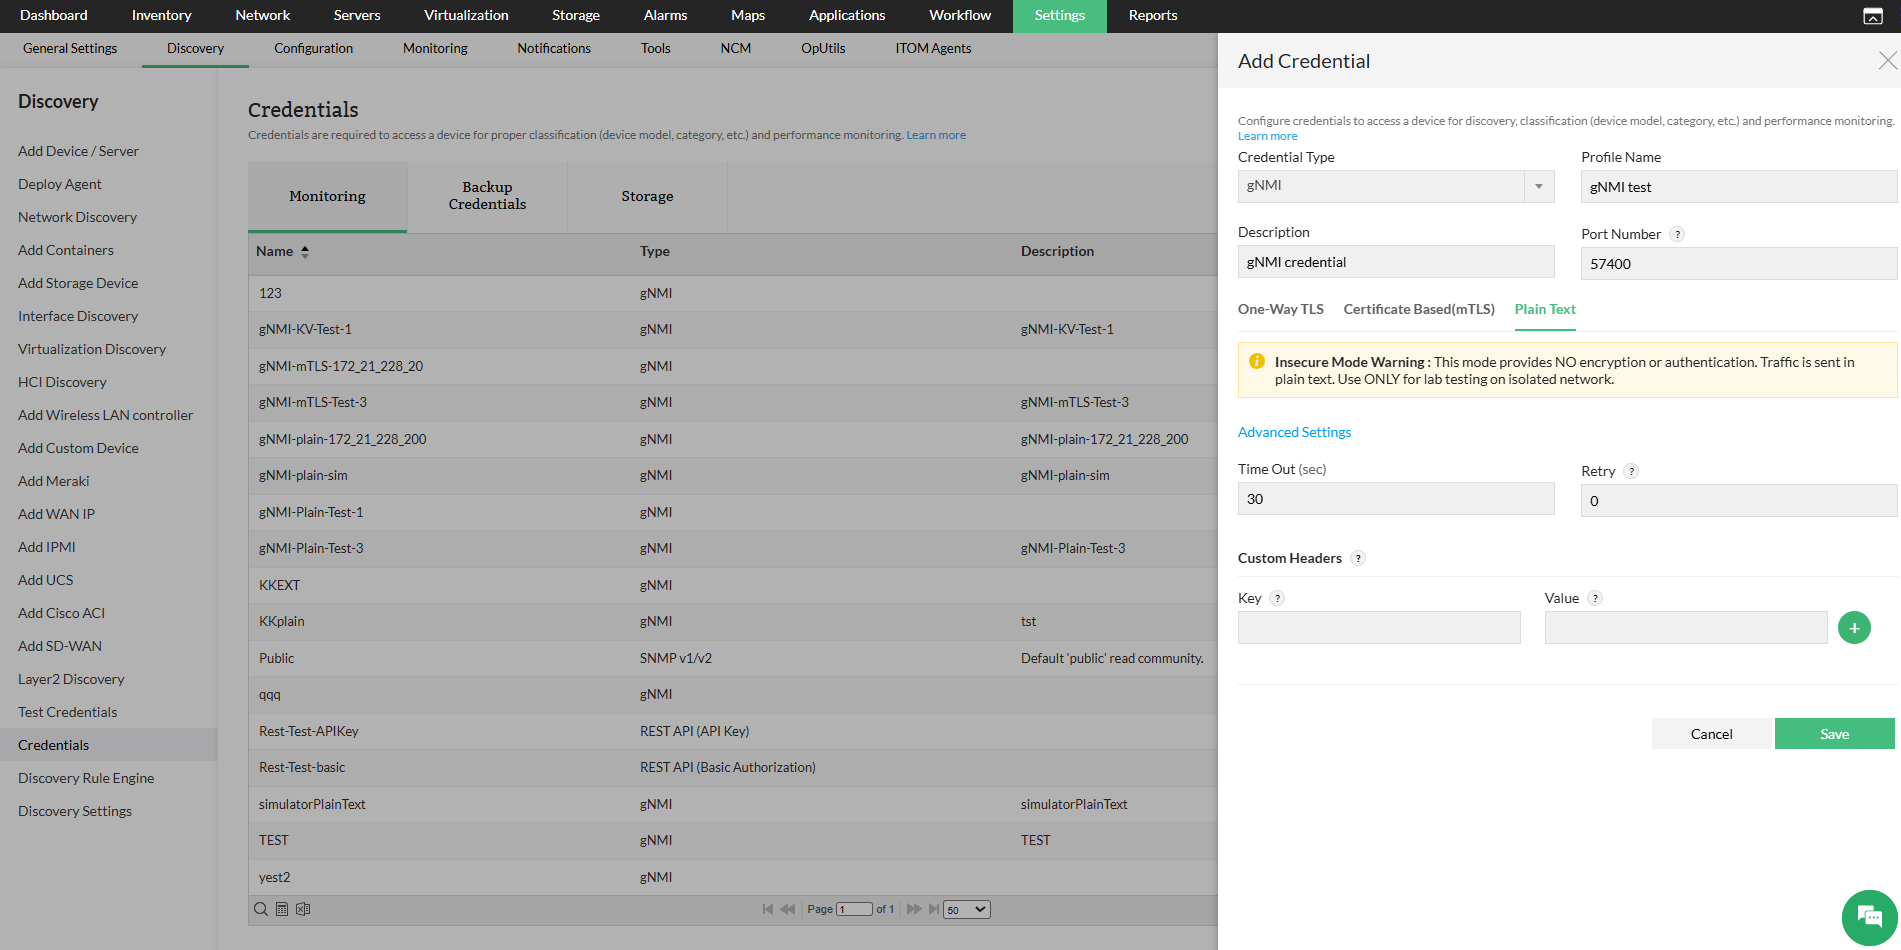
- Enter the Port Number for gNMI communication.
- Provide authentication headers such as username and password.
- Configure optional parameters like Timeout and Retry.
- Click Save.
Note: This mode is recommended only for testing or isolated environments.
How to discover a telemetry device
Follow the steps below to discover a telemetry device using gNMI credentials:
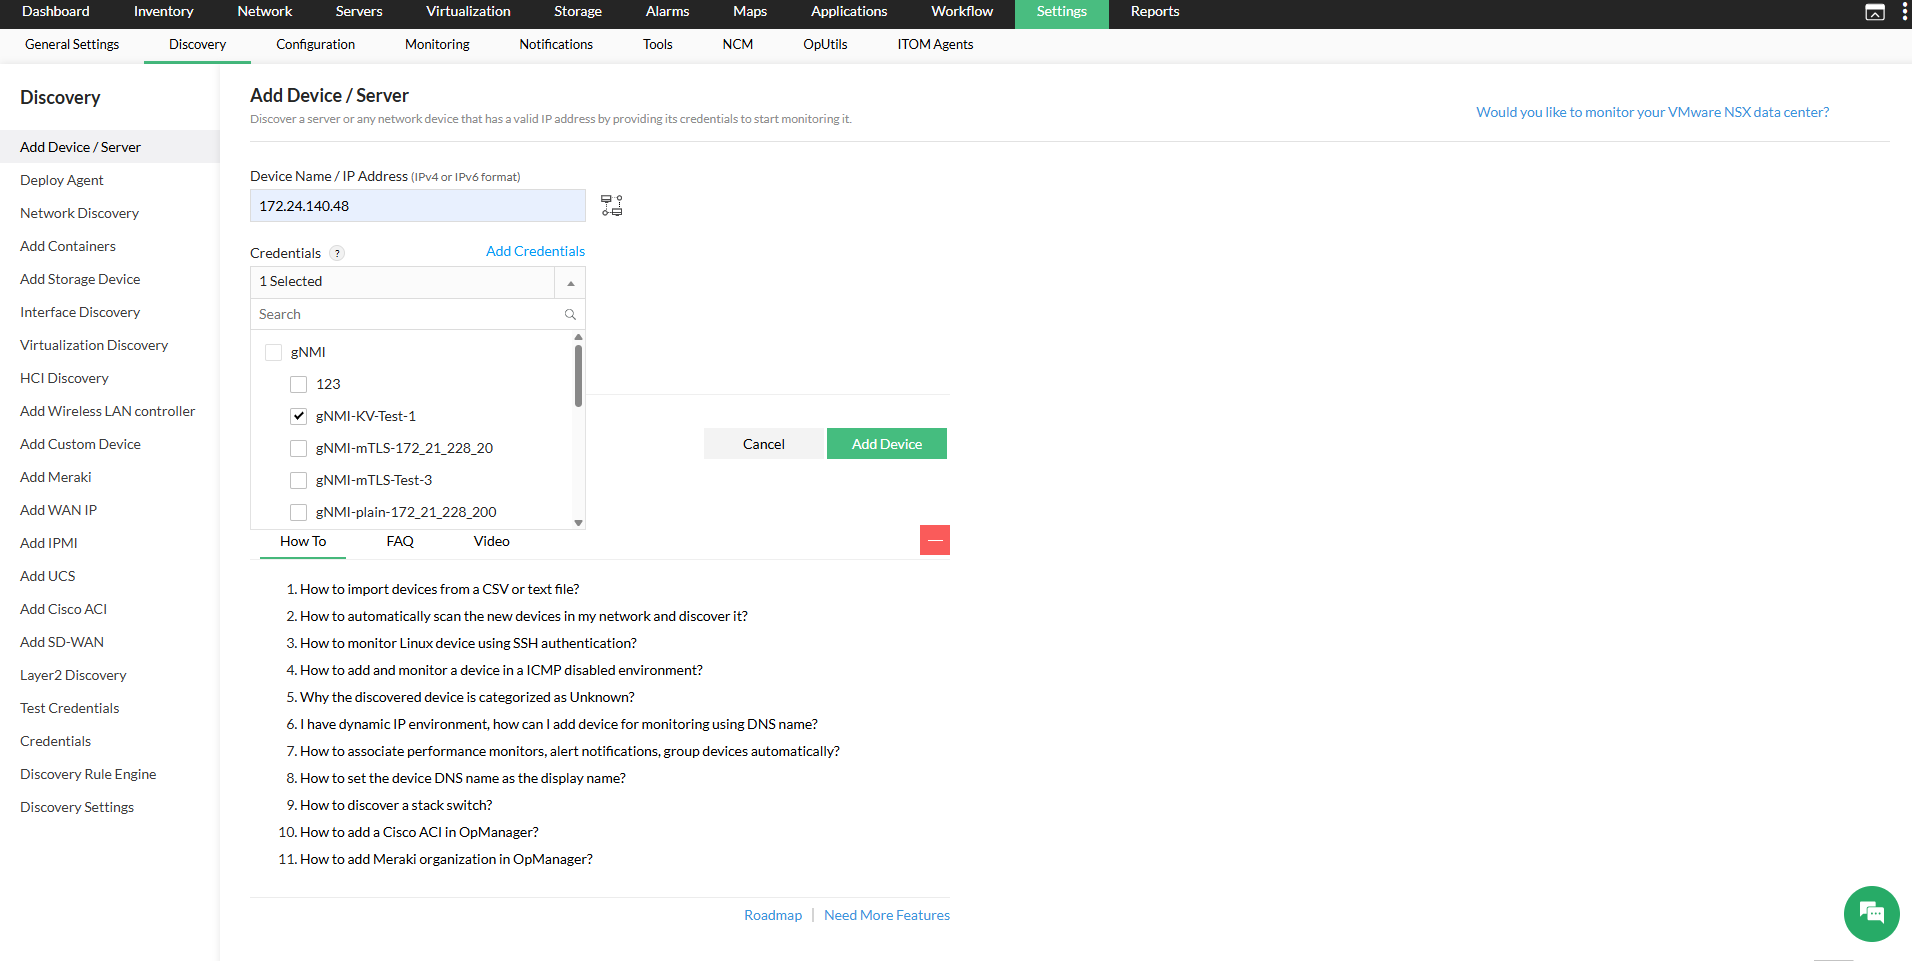
- Navigate to Discovery → Add Device.
Select the gNMI Credential.
Note: Only gNMI credentials are supported for telemetry discovery and cannot be combined with SNMP, WMI, or CLI credentials. Only one gNMI credential can be selected per discovery.
- Click Add Device to discover and add the device to the Inventory.
- Navigate to Inventory → Devices and click the telemetry device to view its device snapshot page, which provides an overview of the device details and associated performance monitors.