OpManager REST API

OpManager offers REST APIs for adding and fetching data from OpManager. Using these APIs, you can integrate OpManager with 3rd party IT management/service desk software.

Note: This document provides a list of REST APIs used to send OpManager data to external sources.

To learn more about ingesting data from external websitesor third-party tools into OpManager, click here.

How OpManager REST APIs work?

The APIs work with an API key. The API key is unique for each OpManager account and is mandatory for all API requests. Learn how to enable or disable Rest API keys

How to view an API Key?

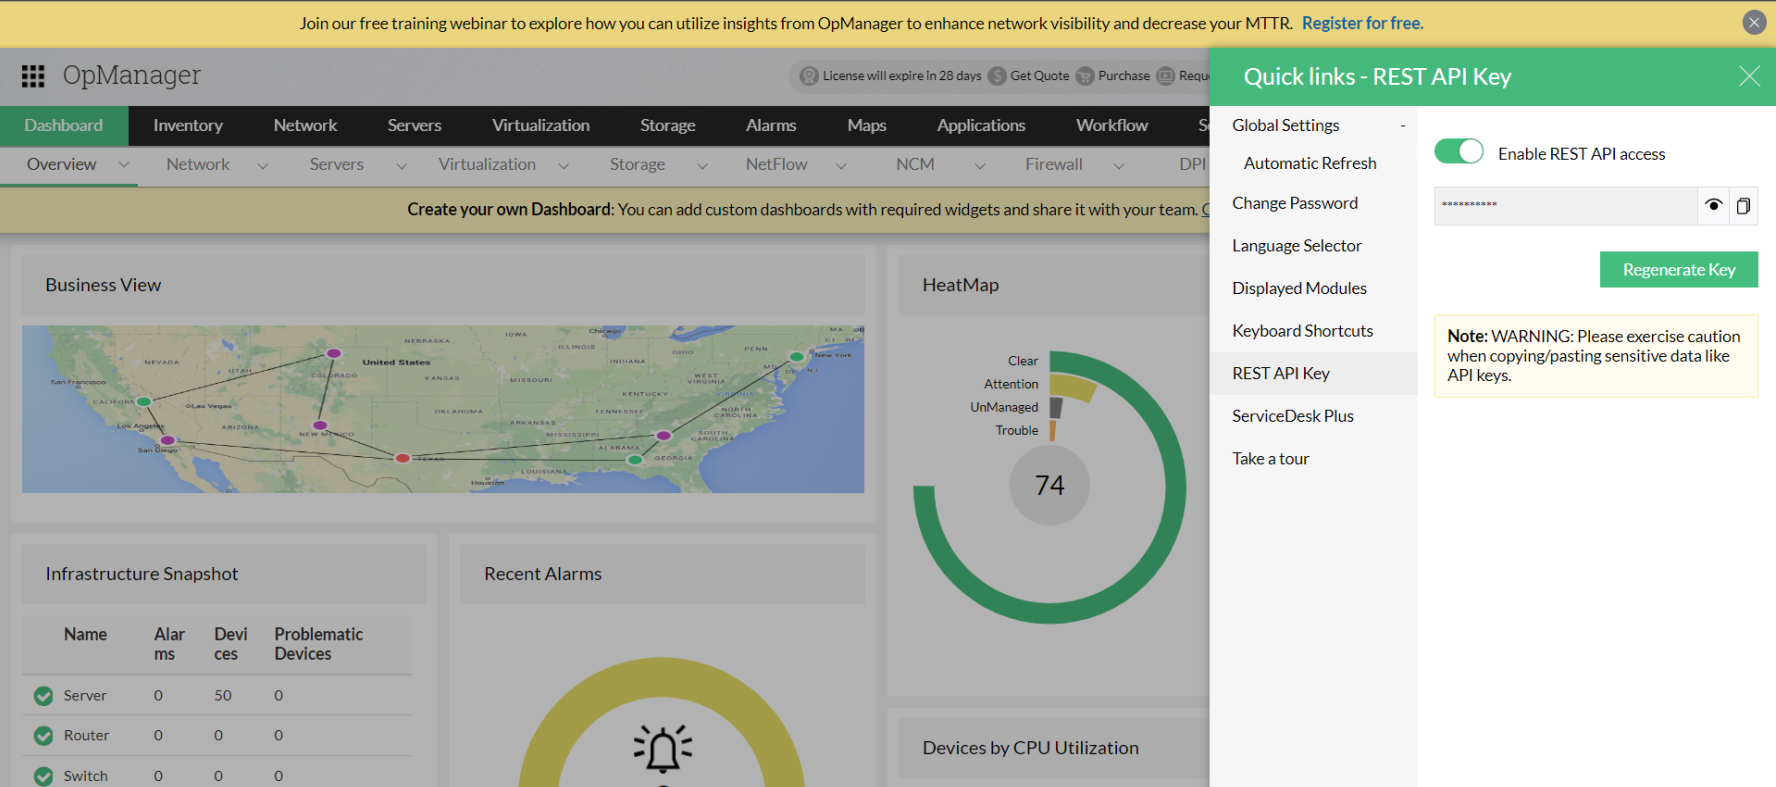
To view or copy an API key, go to Quick links > Rest API Key option in OpManager web client.(The quick link option is the Gear icon on the top right corner)

How to send an apiKey?

The functionality of request parameter-based apiKey authentication has been deprecated. Before version, 128100, the apiKey can be sent via the request parameter. From version 128100, the apiKey can now be sent either in the request header or as a request parameter.

Note: The support for request parameter based apiKey authentication will be ended soon. The following list of URLs should be called with apiKey only via the request header. ApiKey authentication based on request parameters will not work for these URLs.

API
/api/json/alarm/listAlarms
/api/json/admin/addLinuxCredential
/api/json/discovery/addDiscoveryProfile
/api/json/discovery/editDiscoveryProfile
/api/json/v2/discovery/addDiscoveryProfile
/api/json/v2/discovery/editDiscoveryProfile
/api/json/ncmsettings/importSSHKey
/api/json/ncmsettings/importDevices
/api/json/ncmsettings/uploadConfigletFile
/api/json/ncmsettings/uploadConfigletPreView
/api/json/ncmsettings/importConfiglets
/api/json/ncmdevice/updateHostNamefromFileImp
/api/json/ncmdevice/editCustomColfromFileImp
/api/json/ncmdevice/importDG
/api/json/ipam/addSubnet
/api/json/spm/addSwitch

A Sample configuration with header:OpManager rest API: Sample configuration

Enable / Disable Rest API access

From version 127131, the option to enable/disable Rest API has been added.

What has changed?

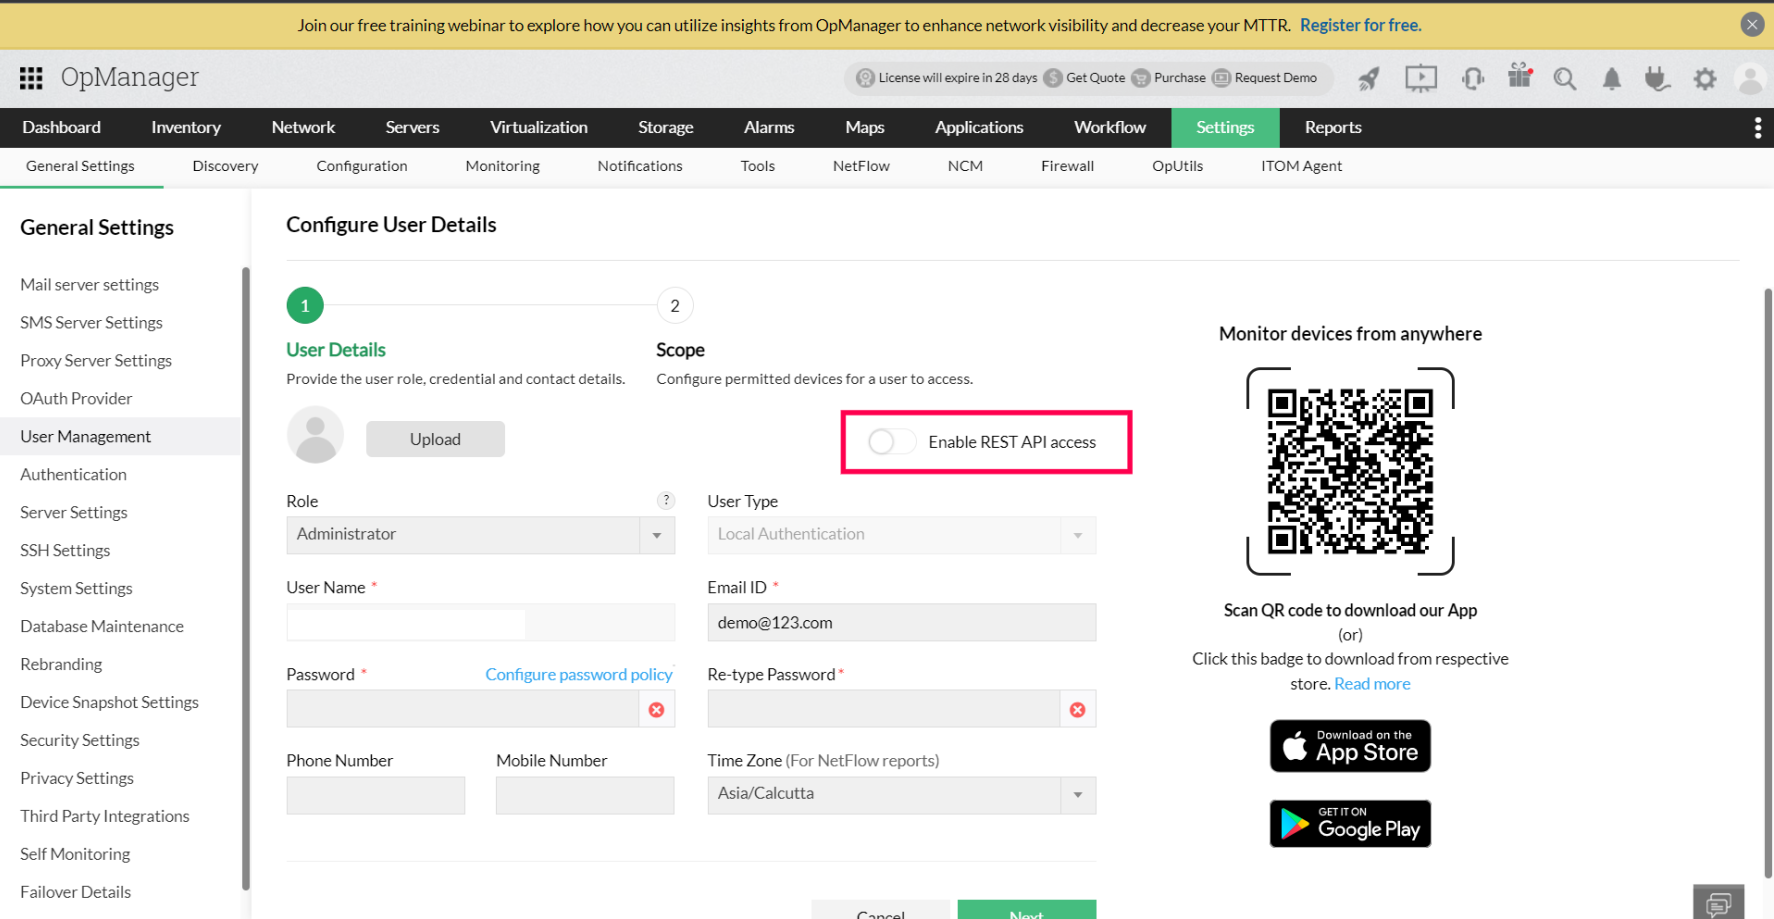
  • Rest API access will be disabled by default for the new users created under User Management. An administrator with complete access to all the modules and devices will be able to edit the user under User Management and provide Rest API access if required.
  • OpManager rest API: Enable rest API

  • If the RestApikey access has been enabled for the users, Rest API menu under Quick links will display the RestApikey, and external Rest API calls will be allowed only if the Rest API access has been enabled for the user.
  • OpManager rest API: After rest API is enabled

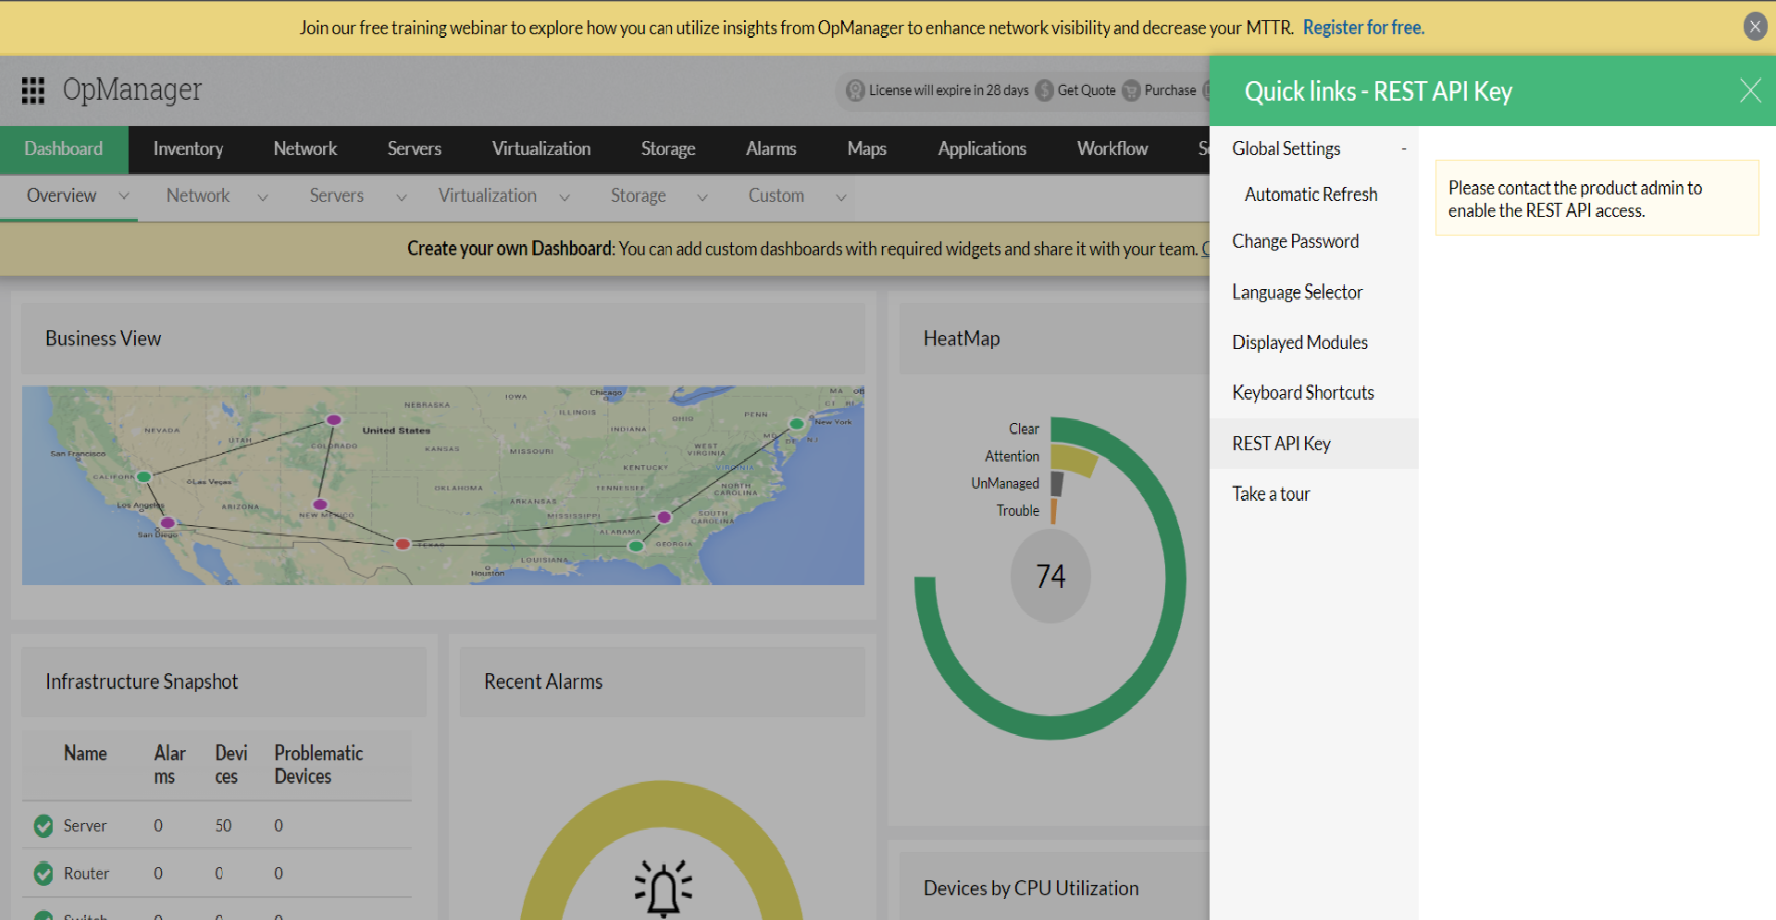
  • If the Rest API access has been disabled, the Rest API menu under Quick links will display "Contact the administrator user".
  • OpManager rest API: Rest API key under quick links

Note:

Enterprise edition user sync:The Rest API access will not be synced for users from Central to Probe servers. The synced users in Probes will not have permanent Rest API access. Whereas, for the users created in the Probe server, the Rest API access can be updated as required.

TFA:If Two-Factor Authentication has been configured, TFA OTP validation is mandatory to enable Rest API access.

Regenerate an API key:To generate an API key, go to Settings > Basic Settings > REST API in OpManager web client and click on Regenerate Key.

Alarms

listAlarms

This API is used to list all the alarms generated in OpManager.

HTTP Method

GET

API URL

http://localhost:8060/api/json/alarm/listAlarms?apiKey=********&deviceName=test1.zoho.com&severity=1&category=Device_Category&entity=sample_entity&alertType=ActiveAlarms&fromTime=2022-05-02 08:00:00&toTime=2022-06-02 18:30:00

Parameters

Param NameDescriptionData TypeAdditional InformationIs Mandatory
apiKeyAPI Key to access your OpManager server.Yes
deviceNameName of the device for which the alarms should be listed. This can be retrieved using the listDevices API.StringAllowed values: Any valid device nameNo
severitySeverity of the alarm.Allowed values: 1 (Critical), 2 (Trouble), 3 (Attention), 4 (Service Down), 5 (Clear)
(e.g., severity=1)
No
categoryCategory of the deviceA valid category name.
Allowed Characters: Any letters, numbers and these symbols: . , space ~ ` : \ / - _
No
alertTypeType of the alarms.Allowed values: ActiveAlarms, EventLogAlarms, SyslogAlarms, TrapAlarms, NCMAlarms, NFAAlarms, WebAlarms, FWAAlarms, StorageAlarms, APMAlarms, Server, Network, Virtualization, CorrelatedAlarms.
(e.g., alertType=ActiveAlarms)
No
fromTimeStart time for the custom time period range.It could be of the format yyyy-mm-dd or yyyy-mm-dd hh:mm:ss. If no time is specified (i.e, yyyy-mm-dd format), the default time will be set to 12 A.M(start of the day).
(e.g., fromTime=2022-05-02 08:00:00)
No
toTimeEnd time for the custom time period range.It could be of the format yyyy-mm-dd or yyyy-mm-dd hh:mm:ss. If no time is specified (i.e, yyyy-mm-dd format), the default time will be set to 12 A.M(start of the day).
(e.g., toTime=2022-06-02 18:30:00)
No
probeNameThe name of the Probe. The probe name could be obtained by executing the listProbes API ,where the parameter name in the response refers to the probeName.[Applicable only for Central Server]A valid probe name.
Allowed: Any combination of letters, numbers, underscores, and spaces.
No

Sample Response

HTTP Code: 200

{ "alarmPresent": true, "total": 1, "Details":{ "Server": [ { "label": "Attention", "value": 2, "status": 3} ]}, "pageLength": 100, "records": 2, "Acknowledge": "0", "Unacknowledge": "2", "severityVsCount":{ "Attention": 2}, "page": 1, "rowCount": 2, "rows": [ { "categoryString": "Server", "prettyTime": "147 days ago", "statusStr": "Attention", "isSuppressed": false, "displayName": "deviceName1", "lastNote": -1, "technician": "Unacknowledged", "message": "CPU Ready [VMware]'s data collection has been failing continuously", "deviceName": "deviceName1", "statusNum": 3, "suppressedMessage": "", "modTimeLong": 1748980058922, "modTime": "06/03/2025 12:47:38 PM PDT", "alarmId": 307, "eventtype": "Poll Failure", "category": "Server", "entity": "PollFailure_4260", "alarmcode": "PollFailure_Down_4260", "who": "Unacknowledge"}, { "categoryString": "Server", "prettyTime": "147 days ago", "statusStr": "Attention", "isSuppressed": false, "displayName": "deviceName2", "lastNote": -1, "technician": "Unacknowledged", "message": "CPU Utilization [VMware]'s data collection has been failing continuously", "deviceName": "deviceName2", "statusNum": 3, "suppressedMessage": "", "modTimeLong": 1748980058904, "modTime": "06/03/2025 12:47:38 PM PDT", "alarmId": 311, "eventtype": "Poll Failure", "category": "Server", "entity": "PollFailure_4266", "alarmcode": "PollFailure_Down_4266", "who": "Unacknowledge"} ], "notificationEnabled": true}
Rate limit: 100 requests per minute. Exceeding this limit will block requests for 1 minute

alarmProperties

To list alarm properties of the particular alarm

HTTP Method

GET

API URL

https://localhost:8060/api/json/alarm/alarmProperties?apiKey=***************&entity=sample_entity

Parameters

Param NameDescriptionData TypeAdditional InformationIs Mandatory
apiKeyAPI Key to access your OpManager server.Yes
entityEntity of the alarm for which the alarm properties should be retrieved. This can be retrieved using the listAlarms API.Entity name for which the properties should be retrieved.
Allowed values: Any letters, numbers, spaces, and these symbols: . ! & : @ # $ - _ ' , /
(e.g., entity=sampleEntity1_Poll)
Yes

Sample Response

HTTP Code: 200

{ "statusStr": "Critical", "stageStr": "New", "suppression": "false", "eventtype": "Threshold Down", "previousseverity": "3", "EVENTTYPE": "Threshold Down", "stage": "0", "modTime": "1666785470844", "createTime": "1666785470844", "pollid": "37", "category": "Desktop", "entity": "37_DiskUtilization", "stringpreviousseverity": "", "who": "Unacknowledge"}
Rate limit: 50 requests per minute. Exceeding this limit will block requests for 1 minute

addNotes

This API is used to add notes to an alarm

HTTP Method

POST

API URL

https://localhost:8060/api/json/alarm/addNotes?apiKey=***************&entity=sample_entity&notes=sample_notes

Parameters

Param NameDescriptionData TypeAdditional InformationIs Mandatory
apiKeyAPI Key to access your OpManager server.Yes
entityThe entity of the alarm(s) to which the notes should be added. This can be retrieved using the listAlarms API.Comma-separated list of entity names to which the notes should be added.
Allowed values: Any letters, numbers, spaces, and these symbols: . ! & : @ # $ - _ ' , /
(e.g., entity=sampleEntity1_Poll)
Yes
notesNotes description to be addedAllowed Values: Any letters, numbers, spaces, and these symbols: . ! : @ # % $=> < & + * - \ / ' , _ ( ) ~ ` [ ]{} ^ ; | ? "Yes

Sample Response

HTTP Code: 200

{ "result":{ "message": "Successfully Added"}}
Rate limit: 50 requests per minute. Exceeding this limit will block requests for 1 minute

acknowledgeAlarm

This API is used to acknowledge an alarm

HTTP Method

POST

API URL

https://localhost:8060/api/json/alarm/acknowledgeAlarm?apiKey=***************&entity=sample_entity

Parameters

Param NameDescriptionData TypeAdditional InformationIs Mandatory
apiKeyAPI Key to access your OpManager server.Yes
entityEntity of the alarm(s) that should be acknowledged. This can be retrieved using the listAlarms API. Comma-separated list of entity names to be acknowledged.
Allowed characters: Any letters, numbers, spaces, and these symbols: . ! & : @ # $ - _ ' , /
(e.g., entity=sampleEntity1_Poll,sampleEntity2_Poll)
Yes

Sample Response

HTTP Code: 200

{ "result":{ "message": "Alarm has been successfully Acknowledged"}}
Rate limit: 50 requests per minute. Exceeding this limit will block requests for 1 minute

unAcknowledgeAlarm

This API is used to unacknowledge an alarm

HTTP Method

POST

API URL

http://localhost:8060/api/json/alarm/unAcknowledgeAlarm?apiKey=********&entity=sample_entity

Parameters

Param NameDescriptionData TypeAdditional InformationIs Mandatory
apiKeyAPI Key to access your OpManager server.Yes
entityEntity of the alarm(s) that should be unacknowledged. This can be retrieved using the listAlarms API.Comma-separated list of entity names to be unacknowledged.
Allowed values: Any letters, numbers, spaces, and these symbols: . ! & : @ # $ - _ ' , /
(e.g., entity=sampleEntity1_Poll,sampleEntity2_Poll)
Yes

Sample Response

HTTP Code: 200

{ "result":{ "message": "Alarm has been successfully UnAcknowledged"}}
Rate limit: 50 requests per minute. Exceeding this limit will block requests for 1 minute

clearAlarm

This API is used to clear an Alarm.

HTTP Method

POST

API URL

https://localhost:8060/api/json/alarm/clearAlarm?apiKey=***************&entity=sample_entity

Parameters

Param NameDescriptionData TypeAdditional InformationIs Mandatory
apiKeyAPI Key to access your OpManager server.Yes
entityEntity of the alarm(s) that should be cleared. This can be retrieved using the listAlarms API.Comma-separated list of entity names to be cleared.
Allowed values: Any letters, numbers, spaces, and these symbols: . ! & : @ # $ - _ ' , /
(e.g., entity=sampleEntity1_Poll,sampleEntity2_Poll)
Yes

Sample Response

HTTP Code: 200

{ "result":{ "message": "Alarm has been successfully Cleared!"}}
Rate limit: 50 requests per minute. Exceeding this limit will block requests for 1 minute

deleteAlarm

This API is used to delete an alarm

HTTP Method

POST

API URL

https://localhost:8060/api/json/alarm/deleteAlarm?apiKey=***************&entity=sample_entity

Parameters

Param NameDescriptionData TypeAdditional InformationIs Mandatory
apiKeyAPI Key to access your OpManager server.Yes
entityThe entity of the alarm(s) that should be deleted. This can be retrieved using the listAlarms API.Comma-separated list of entity names to be deleted.
Allowed values: Any letters, numbers, spaces, and these symbols: . ! & : @ # $ - _ ' , /
(e.g., entity=sampleEntity1_Poll,sampleEntity2_Poll)
Yes

Sample Response

HTTP Code: 200

{ "result":{ "message": "Alarm has been successfully Deleted!"}}
Rate limit: 50 requests per minute. Exceeding this limit will block requests for 1 minute

ConfigureSuppressAlarm

This API is used to suppress alarms for a specific device.

HTTP Method

POST

API URL

https://localhost:8060/api/json/device/ConfigureSuppressAlarm?apiKey=&name=test.abc&suppressInterval=-2&startTime=2024-08-16 16:30&endTime=2024-08-16 16:50

Parameters

Param NameDescriptionData TypeAdditional InformationIs Mandatory
apiKeyAPI Key to access your OpManager server.Yes
nameName of the device to be suppressed. This can be retrieved using the listDevices API.StringAllowed values: Any valid device nameYes
suppressIntervalThe time period during which the device should be suppressed.Allowed values: 0 (never), -1 (forever), 3600000 (1 hour), 7200000 (2 hours), 28800000 (8 hours), 43200000 (12 hours), 86400000 (1 day), 604800000 (7 days), -2 (Custom Time Period - For Custom Time Period, specify the startTime and endTime parameters in the format YYYY-MM-DD HH:MM)
(e.g., suppressInterval=604800000)
Yes
startTimeAlarm suppression start time in YYYY-MM-DD HH:MM format.
This To be specified only for suppressInterval=-2
Allowed format: YYYY-MM-DD HH:MM
Example: 2025-10-24 14:42
No
endTimeAlarm suppression end time in YYYY-MM-DD HH:MM format.
To be specified only for suppressInterval=-2
Allowed format: YYYY-MM-DD HH:MM
Example: 2025-10-24 14:42
No

Sample Response

HTTP Code: 200

{ "result":{ "message": "Alarm Suppression rule has been added successfully"}}
Rate limit: 20 requests per minute. Exceeding this limit will block requests for 1 minute

getAnnotation

This API is used to get notes of the alarms

HTTP Method

GET

API URL

https://localhost:8060/api/json/alarm/getAnnotation?apiKey=***************&entity=sample_entity

Parameters

Param NameDescriptionData TypeAdditional InformationIs Mandatory
apiKeyAPI Key to access your OpManager server.Yes
entityThe entity of the alarm for which the notes should be retrieved. This can be retrieved using the listAlarms API.Entity name for which the notes should be retrieved.
Allowed values: Any letters, numbers, spaces, and these symbols: . ! & : @ # $ - _ ' , /
Yes

Sample Response

HTTP Code: 200

[ { "notes": "This is a test note", "modTime": 1666786020066, "noteID": 1, "modTimeStr": "26 Oct 2022 05:37:00 PM IST", "entity": "37_DiskUtilization", "who": "admin"}
]
Rate limit: 100 requests per minute. Exceeding this limit will block requests for 1 minute

updateAlarmNote

This API is used to update notes for an alarm

HTTP Method

POST

API URL

https://localhost:8060/api/json/alarm/updateAlarmNote?apiKey=***************&noteID=1&notes=sample_notes

Parameters

Param NameDescriptionData TypeAdditional InformationIs Mandatory
apiKeyAPI Key to access your OpManager server.Yes
noteIDID of the note to be updated. This can be retrieved using the getAnnotation API.longAny valid note idYes
notesNotes description to be addedAllowed Values: Any letters, numbers, spaces, and these symbols: . ! : @ # % $=> < & + * - \ / ' , _ ( ) ~ ` [ ]{} ^ ; | ? "Yes

Sample Response

HTTP Code: 200

{ "result":{ "message": "Note has been successfully updated"}}
Rate limit: 50 requests per minute. Exceeding this limit will block requests for 1 minute

GetSuppressAlarmDetails

This API is used to retrieve the suppression details for a specific device.

HTTP Method

GET

API URL

https://localhost:8060/api/json/device/GetSuppressAlarmDetails?apiKey=***************&name=test.abc

Parameters

Param NameDescriptionData TypeAdditional InformationIs Mandatory
apiKeyAPI Key to access your OpManager server.Yes
nameName of the device for which suppression details are to be retrieved. Device name can be retrieved using the listDevices API.StringAllowed values: Any valid device nameYes

Sample Response

HTTP Code: 200

{ { "List": [ { "configID": 10000000602, "LASTUPDATEDTIME": 1761320552761, "startTime": "24 Oct 2025 09:12:32 PM IST", "endTime": "25 Oct 2025 05:12:32 AM IST", "userName": "admin", "message": "Alarms are suppressed till : 25 Oct 2025 05:12:32 AM IST", "suppressInterval": "28800000"} ]}
Rate limit: 20 requests per minute. Exceeding this limit will block requests for 1 minute

Availability

getPingResponse

ICMP/Ping response for the given device.

HTTP Method

POST

API URL

https://localhost:8060/api/json/device/getPingResponse?apiKey=***************&deviceName=xxx.xxx.xx.x

Parameters

Param NameDescriptionData TypeAdditional InformationIs Mandatory
apiKeyAPI Key to access your OpManager server.String-Yes
deviceNameName of the device - Managed Entity name as seen in the URL of device snapshot page OR 'deviceName' property value in the listDevices API response.String-Yes
fromAddDeviceIs Ping response from Add Device/Server PageBoolean-No
isBulkFor Bulk ping response in Inventory PageBoolean-No
fromWANLinkIs Ping response from Add WAN Link PageBoolean-No

Sample Response

HTTP Code: 200

{ "PingResponse":{ "Details": "Pinging 127.0.0.1 with 32 bytes of data: Reply from 127.0.0.1: bytes=32 time=21ms TTL=251 Ping statistics for 127.0.0.1: Packets: Sent=1, Received=1, Lost=0 (0% loss), Approximate round trip times in milli-seconds: Minimum=21ms, Maximum=21ms, Average=21ms"}}
Rate limit: 500 requests per minute. Exceeding this limit will block requests for 1 minute

getTraceResponse

Trace route command response for the given device

HTTP Method

POST

API URL

https://localhost:8060/api/json/device/getTraceResponse?apiKey=***************&deviceName=xxx.xxx.xx.x

Parameters

Param NameDescriptionData TypeAdditional InformationIs Mandatory
apiKeyAPI Key to access your OpManager server.String-Yes
deviceNameName of the device - Managed Entity name as seen in the URL of device snapshot page OR 'deviceName' property value in the listDevices API response.String-Yes
fromWANLinkIs Trace Response from Add WAN Link PageString-No

Sample Response

HTTP Code: 200

{ "TraceResponse":{ "Details": "Tracing route to 127.0.0.1 over a maximum of 30 hops 1 8 ms 9 ms 3 ms 127.0.0.1 2 1 ms 1 ms 1 ms 127.0.0.1 3 20 ms 20 ms 20 ms 127.0.0.1 4 22 ms 21 ms 22 ms 127.0.0.1 5 21 ms 20 ms 20 ms 127.0.0.1 Trace complete."}}
Rate limit: 500 requests per minute. Exceeding this limit will block requests for 1 minute

getDownDevices

Lists the devices that are currently in down state and having device status as 'critical'

HTTP Method

GET

API URL

https://localhost:8060/api/json/discovery/getDownDevices?apiKey=******************

Parameters

Param NameDescriptionData TypeAdditional InformationIs Mandatory
apiKeyAPI Key to access your OpManager server.String-Yes

Sample Response

HTTP Code: 200

{ "DownDevices":{ "Details": [ { "name": "127.0.0.1", "type": "HPSwitch 3900X", "category": "Switch", "displayName": "SwitchDevice_SP"}, { "name": "127.0.0.2", "type": "Windows Server 2018", "category": "Server", "displayName": "AppServer-04"}, { "name": "UserPC_Michael", "type": "Linux RedHat", "category": "Server", "displayName": "127.0.0.3"} ]}}
Rate limit: 100 requests per minute. Exceeding this limit will block requests for 5 minutes

getAvailabilityGraphData

Fetches the Availability graphs for the given device or interface.

HTTP Method

GET

API URL

https://localhost:8060/api/json/device/getAvailabilityGraphData?apiKey=******************&isFluidic=true&name=opmserver.mydomain.com

Parameters

Param NameDescriptionData TypeAdditional InformationIs Mandatory
apiKeyAPI Key to access your OpManager server.String-Yes
nameName of the device or interface - Managed Entity name as seen in the URL of device/interface snapshot page OR 'deviceName' property value of listDevices API or 'interfaceName' property value in the listInterfaces API response [Example: opmserver.mydomain.com or IF-xx.xx.24.223-115]String-Yes
isFluidicSet value as TRUE by default (for internal purpose)Boolean-Yes
instanceSet instance=Interface if the Availability graph is requested for the interface. Mandatory field if the interface data is being fetched. This API can also be used to fetch availability of other monitors. [Example: Interface|URL|winService|service|process]StringAllowed values: Interface, URL, winService, service, process, MerakiUplink, WANLinkMonitorNo
elementIDThis is the unique ID column fetched from managedobject tableLong-No

Sample Response

HTTP Code: 200

{ "uptimeData":{ "Today": 100, "Yesterday": 100, "This Week": 100, "Last Week": 100, "This Month": 99.98, "Last Month": 100, "This Quarter": 99.98, "Last Quarter": 100, "This Year": 99.98, "Last Year": 0}, "availabilityData": [ { "name": "Last 24 Hours", "points": [ { "y": 100, "x": 1661392800000, "toolTipKey": "Aug 25, 12:00 AM", "color": "#1A8F47"} ]} ]}
Rate limit: 100 requests per minute. Exceeding this limit will block requests for 1 minute

listDownTimeSchedules

Provides the list of downtime schedules created in OpManager.

HTTP Method

GET

API URL

https://localhost:8060/api/json/admin/listDownTimeSchedules?apiKey=****************&callAction=settings

Parameters

Param NameDescriptionData TypeAdditional InformationIs Mandatory
apiKeyAPI Key to access your OpManager server.String-Yes
callActionPage from where this action takes placeString-Yes

Sample Response

HTTP Code: 200

[ { "MODIFIED_BY": "admin", "MODIFIED_TIME_STR": "at Oct 7, 2025 11:42", "type": "Once", "nextscheduledtime": "Tue, Oct 7, 2025 12:00:00", "statusNum": "1", "ADDED_TIME": "1759817559532", "MODIFIED_TIME": "1759817559532", "suppressType": "Monitoring", "name": "DemoSchedule", "id": "1", "ADDED_BY": "admin", "ADDED_TIME_STR": "at Oct 7, 2025 11:42", "status": "Enabled"}
]
Rate limit: 100 requests per minute. Exceeding this limit will block requests for 1 minute

addDowntimeSchedule

Allows you to schedule downtimes for groups and devices.

HTTP Method

POST

API URL

https://localhost:8060/api/json/admin/addDowntimeSchedule?apiKey=&operation=Add&scheduleName=FirmwareUpgrade&status=Enabled&scheduleDesc=&recurrence=OnceOnly&selectDevicesMethod=Device&once_startat=2024-07-10 00:00&once_endate=2024-07-11 04:00&selectedDevices=10.5.5.1,30.30.30.6,opm-sql

Parameters

Param NameDescriptionData TypeAdditional InformationIs Mandatory
apiKeyAPI Key to access your OpManager server.String-Yes
operationAdd (to create new downtime scheduler)StringAllowed values: Add, EditYes
scheduleNameName of the schedule (Strig value)StringAllowed characters: A-Z, a-z, 0-9, space( ), underscore(_)Yes
statusEnabled/DisabledStringAllowed values: Enabled, DisabledYes
scheduleDescDowntime scheduler description (Optional)StringAllowed characters: A-Z, a-z, 0-9, space( ), underscore(_), dot(.), slash(/), pipe(|), question mark(?), hyphen(-), tilde(~)No
recurrenceOnceOnly/DailyStringAllowed values: OnceOnly, Daily, Weekly, MonthlyYes
selectDevicesMethodDeviceStringAllowed values: Category, BV, Device, URL, GROUPYes
selectedCategDevice category (applicable only if selectDevicesMethod is 'Category')StringAllowed characters: A-Z, a-z, 0-9, space( ), underscore(_), dot(.), slash(/), pipe(|), question mark(?), hyphen(-), tilde(~)No
selectedBVBusiness view name suffixed with '_bv' (applicable only if selectDevicesMethod is 'Business View')String-No
selectedDevicesDevice IP (comma-separated values)String-No
selectedURLURL Monitor name (applicable only if selectDevicesMethod is 'URLs')String-No
selectedLogicalGroupsDevices Group name (comma-separated values)StringAllowed characters: A-Z, a-z, all Unicode letters, 0-9, space( ), underscore(_), hyphen(-), dot(.), exclamation(!), colon(:), at(@), hash(#), dollar($), backslash(\), slash(/), single quote('), comma(,)No
once_startatStart date & time (applicable only if recurrence is 'OnceOnly')StringAllowed characters: Digits(0-9), hyphen(-), space( ), colon(:)No
once_endatEnd date & time (applicable only if recurrence is 'OnceOnly')StringAllowed characters: Digits(0-9), hyphen(-), space( ), colon(:)No
startdayStart day of the week (applicable only for Daily)String/IntAllowed values: Sunday, Monday, Tuesday, Wednesday, Thursday, Friday, Saturday, 1-31, 32No
enddayEnd day of the week (applicable only for Daily)String/IntAllowed values: Sunday, Monday, Tuesday, Wednesday, Thursday, Friday, Saturday, 1-31, 32No
from_timeStart date & time (applicable only if recurrence is 'Daily')StringAllowed values: 00:00-23:59 (hours 00-23, minutes 00-59)No
to_timeEnd date & time (applicable only if recurrence is 'Daily')StringAllowed values: 00:00-23:59 (hours 00-23, minutes 00-59)No
daily_effectfromDowntime scheduler start date & time (applicable only if recurrence is 'Daily')StringAllowed values: year-month-date (0000-9999 for year, 01-12 for month, 01-31 for date)No
from_hrsStart hour (applicable only if recurrence is 'Monthly')IntAllowed values: 00-23No
to_hrsEnd hour (applicable only if recurrence is 'Monthly')IntAllowed values: 00-23No
from_minsStart Minutes (applicable only if recurrence is 'Monthly')IntAllowed values: 00-59No
to_minsEnd minutes (applicable only if recurrence is 'Monthly')IntAllowed values: 00-59No
monthlyTypemonthlyDate | monthlyDay (applicable only if recurrence is 'Monthly')StringAllowed values: monthlyDate, monthlyDayNo
weekOfMonthWeek of the monthStringAllowed values: First, Second, Third, Fourth, LastNo
weekdayDay of the week (applicable only if recurrence is 'Monthly' and monthlyType is 'monthlyDay')String/IntAllowed values: Sunday, Monday, Tuesday, Wednesday, Thursday, Friday, Saturday, 1-31, 32No
mailIDEmail id to which the report should be sentStringAllowed characters: A-Z, a-z, 0-9, underscore(_), hyphen(-), dot(.), plus(+), single quote('), slash(/), at(@), comma(,), space( )No
suppressTypeTo Suppress Alarm or MonitoringStringAllowed values: Alarm, MonitoringNo
timeZoneTime ZoneStringAllowed characters: A-Z, a-z, 0-9, underscore(_), hyphen(-), slash(/)No

Sample Response

HTTP Code: 200

{ "result":{ "message": "Downtime Scheduler has been added successfully.", "scheduleID": 7}}
Rate limit: 50 requests per minute. Exceeding this limit will block requests for 1 minute

updateDowntimeSchedule

Used to update downtime schedule.

HTTP Method

POST

API URL

http://localhost:8060/api/json/admin/updateDowntimeSchedule?operation=Edit&MS_INSTANCEID=14&scheduleId=14

Parameters

Param NameDescriptionData TypeAdditional InformationIs Mandatory
apiKeyAPI Key to access your OpManager server.String-Yes
operationEdit will be sent by default (Edit).StringAllowed values: Add, EditYes
MS_INSTANCEIDMaintenance schedule instance ID long-Yes
scheduleIdDowntime schedule IDlong-Yes
scheduleNameName of the schedule (Strig value)StringAllowed characters: A-Z, a-z, 0-9, space( ), underscore(_)Yes
statusEnabled/DisabledStringAllowed values: Enabled, DisabledYes

Sample Response

HTTP Code: 200

{ "result":{ "message": "Downtime Scheduler has been updated successfully."}}
Rate limit: 50 requests per minute. Exceeding this limit will block requests for 1 minute

getDowntimeSchedule

Used to get the downtime scheduler details

HTTP Method

GET

API URL

http://localhost:8060/api/json/admin/getDowntimeSchedule?suppressType=Monitoring&scheduleId=1&scheduleName=DemoSchedule&_=1564738493372

Parameters

Param NameDescriptionData TypeAdditional InformationIs Mandatory
scheduleNameDowntime scheduler nameStringAllowed characters: A-Z, a-z, 0-9, space( ), underscore(_)Yes
suppressTypeSuppress type for downtime scheduleStringAllowed values: Alarm, MonitoringNo
scheduleIdSchedule ID for Downtime scheduleLong-No

Sample Response

HTTP Code: 200

{ "scheduleName": "DemoSchedule", "allTimeZones": [ { "name": "(GMT -12:00) Etc/GMT+12", "id": "Etc/GMT+12"}, { "name": "(GMT -11:00) Pacific/Pago_Pago", "id": "Pacific/Pago_Pago"}, { "name": "(GMT -11:00) Pacific/Samoa", "id": "Pacific/Samoa"}, { "name": "(GMT -11:00) Pacific/Niue", "id": "Pacific/Niue"}, { "name": "(GMT -11:00) US/Samoa", "id": "US/Samoa"}, { "name": "(GMT -11:00) Etc/GMT+11", "id": "Etc/GMT+11"}, { "name": "(GMT -11:00) Pacific/Midway", "id": "Pacific/Midway"}, { "name": "(GMT -10:00) Pacific/Honolulu", "id": "Pacific/Honolulu"}, { "name": "(GMT -10:00) Pacific/Rarotonga", "id": "Pacific/Rarotonga"}, { "name": "(GMT -10:00) Pacific/Tahiti", "id": "Pacific/Tahiti"}, { "name": "(GMT -10:00) Pacific/Johnston", "id": "Pacific/Johnston"}, { "name": "(GMT -10:00) US/Hawaii", "id": "US/Hawaii"}, { "name": "(GMT -10:00) SystemV/HST10", "id": "SystemV/HST10"}, { "name": "(GMT -10:00) Etc/GMT+10", "id": "Etc/GMT+10"}, { "name": "(GMT -09:30) Pacific/Marquesas", "id": "Pacific/Marquesas"}, { "name": "(GMT -09:00) Etc/GMT+9", "id": "Etc/GMT+9"}, { "name": "(GMT -09:00) Pacific/Gambier", "id": "Pacific/Gambier"}, { "name": "(GMT -09:00) America/Atka", "id": "America/Atka"}, { "name": "(GMT -09:00) SystemV/YST9", "id": "SystemV/YST9"}, { "name": "(GMT -09:00) America/Adak", "id": "America/Adak"}, { "name": "(GMT -09:00) US/Aleutian", "id": "US/Aleutian"}, { "name": "(GMT -08:00) Etc/GMT+8", "id": "Etc/GMT+8"}, { "name": "(GMT -08:00) US/Alaska", "id": "US/Alaska"}, { "name": "(GMT -08:00) America/Juneau", "id": "America/Juneau"}, { "name": "(GMT -08:00) America/Metlakatla", "id": "America/Metlakatla"}, { "name": "(GMT -08:00) America/Yakutat", "id": "America/Yakutat"}, { "name": "(GMT -08:00) Pacific/Pitcairn", "id": "Pacific/Pitcairn"}, { "name": "(GMT -08:00) America/Sitka", "id": "America/Sitka"}, { "name": "(GMT -08:00) America/Anchorage", "id": "America/Anchorage"}, { "name": "(GMT -08:00) SystemV/PST8", "id": "SystemV/PST8"}, { "name": "(GMT -08:00) America/Nome", "id": "America/Nome"}, { "name": "(GMT -08:00) SystemV/YST9YDT", "id": "SystemV/YST9YDT"}, { "name": "(GMT -07:00) Canada/Yukon", "id": "Canada/Yukon"}, { "name": "(GMT -07:00) Etc/GMT+7", "id": "Etc/GMT+7"}, { "name": "(GMT -07:00) US/Arizona", "id": "US/Arizona"}, { "name": "(GMT -07:00) Mexico/BajaSur", "id": "Mexico/BajaSur"}, { "name": "(GMT -07:00) America/Dawson_Creek", "id": "America/Dawson_Creek"}, { "name": "(GMT -07:00) Canada/Pacific", "id": "Canada/Pacific"}, { "name": "(GMT -07:00) PST8PDT", "id": "PST8PDT"}, { "name": "(GMT -07:00) America/Mazatlan", "id": "America/Mazatlan"}, { "name": "(GMT -07:00) SystemV/MST7", "id": "SystemV/MST7"}, { "name": "(GMT -07:00) America/Dawson", "id": "America/Dawson"}, { "name": "(GMT -07:00) Mexico/BajaNorte", "id": "Mexico/BajaNorte"}, { "name": "(GMT -07:00) America/Tijuana", "id": "America/Tijuana"}, { "name": "(GMT -07:00) America/Creston", "id": "America/Creston"}, { "name": "(GMT -07:00) America/Hermosillo", "id": "America/Hermosillo"}, { "name": "(GMT -07:00) America/Santa_Isabel", "id": "America/Santa_Isabel"}, { "name": "(GMT -07:00) America/Vancouver", "id": "America/Vancouver"}, { "name": "(GMT -07:00) America/Ensenada", "id": "America/Ensenada"}, { "name": "(GMT -07:00) America/Phoenix", "id": "America/Phoenix"}, { "name": "(GMT -07:00) America/Whitehorse", "id": "America/Whitehorse"}, { "name": "(GMT -07:00) America/Fort_Nelson", "id": "America/Fort_Nelson"}, { "name": "(GMT -07:00) SystemV/PST8PDT", "id": "SystemV/PST8PDT"}, { "name": "(GMT -07:00) America/Los_Angeles", "id": "America/Los_Angeles"}, { "name": "(GMT -07:00) US/Pacific", "id": "US/Pacific"}, { "name": "(GMT -06:00) America/El_Salvador", "id": "America/El_Salvador"}, { "name": "(GMT -06:00) America/Guatemala", "id": "America/Guatemala"}, { "name": "(GMT -06:00) America/Belize", "id": "America/Belize"}, { "name": "(GMT -06:00) America/Managua", "id": "America/Managua"}, { "name": "(GMT -06:00) America/Tegucigalpa", "id": "America/Tegucigalpa"}, { "name": "(GMT -06:00) Etc/GMT+6", "id": "Etc/GMT+6"}, { "name": "(GMT -06:00) America/Regina", "id": "America/Regina"}, { "name": "(GMT -06:00) America/Denver", "id": "America/Denver"}, { "name": "(GMT -06:00) Mexico/General", "id": "Mexico/General"}, { "name": "(GMT -06:00) Pacific/Galapagos", "id": "Pacific/Galapagos"}, { "name": "(GMT -06:00) America/Yellowknife", "id": "America/Yellowknife"}, { "name": "(GMT -06:00) America/Swift_Current", "id": "America/Swift_Current"}, { "name": "(GMT -06:00) America/Inuvik", "id": "America/Inuvik"}, { "name": "(GMT -06:00) America/Ciudad_Juarez", "id": "America/Ciudad_Juarez"}, { "name": "(GMT -06:00) America/Boise", "id": "America/Boise"}, { "name": "(GMT -06:00) America/Costa_Rica", "id": "America/Costa_Rica"}, { "name": "(GMT -06:00) MST7MDT", "id": "MST7MDT"}, { "name": "(GMT -06:00) America/Monterrey", "id": "America/Monterrey"}, { "name": "(GMT -06:00) SystemV/CST6", "id": "SystemV/CST6"}, { "name": "(GMT -06:00) America/Chihuahua", "id": "America/Chihuahua"}, { "name": "(GMT -06:00) US/Mountain", "id": "US/Mountain"}, { "name": "(GMT -06:00) America/Mexico_City", "id": "America/Mexico_City"}, { "name": "(GMT -06:00) America/Edmonton", "id": "America/Edmonton"}, { "name": "(GMT -06:00) America/Bahia_Banderas", "id": "America/Bahia_Banderas"}, { "name": "(GMT -06:00) Canada/Mountain", "id": "Canada/Mountain"}, { "name": "(GMT -06:00) America/Cambridge_Bay", "id": "America/Cambridge_Bay"}, { "name": "(GMT -06:00) Navajo", "id": "Navajo"}, { "name": "(GMT -06:00) SystemV/MST7MDT", "id": "SystemV/MST7MDT"}, { "name": "(GMT -06:00) America/Merida", "id": "America/Merida"}, { "name": "(GMT -06:00) Canada/Saskatchewan", "id": "Canada/Saskatchewan"}, { "name": "(GMT -06:00) America/Shiprock", "id": "America/Shiprock"}, { "name": "(GMT -05:00) America/Panama", "id": "America/Panama"}, { "name": "(GMT -05:00) America/Chicago", "id": "America/Chicago"}, { "name": "(GMT -05:00) America/Eirunepe", "id": "America/Eirunepe"}, { "name": "(GMT -05:00) Etc/GMT+5", "id": "Etc/GMT+5"}, { "name": "(GMT -05:00) Pacific/Easter", "id": "Pacific/Easter"}, { "name": "(GMT -05:00) America/Porto_Acre", "id": "America/Porto_Acre"}, { "name": "(GMT -05:00) America/Guayaquil", "id": "America/Guayaquil"}, { "name": "(GMT -05:00) America/Rankin_Inlet", "id": "America/Rankin_Inlet"}, { "name": "(GMT -05:00) US/Central", "id": "US/Central"}, { "name": "(GMT -05:00) America/Rainy_River", "id": "America/Rainy_River"}, { "name": "(GMT -05:00) America/Indiana/Knox", "id": "America/Indiana/Knox"}, { "name": "(GMT -05:00) America/North_Dakota/Beulah", "id": "America/North_Dakota/Beulah"}, { "name": "(GMT -05:00) America/Jamaica", "id": "America/Jamaica"}, { "name": "(GMT -05:00) America/Atikokan", "id": "America/Atikokan"}, { "name": "(GMT -05:00) America/Coral_Harbour", "id": "America/Coral_Harbour"}, { "name": "(GMT -05:00) America/North_Dakota/Center", "id": "America/North_Dakota/Center"}, { "name": "(GMT -05:00) America/Cayman", "id": "America/Cayman"}, { "name": "(GMT -05:00) America/Indiana/Tell_City", "id": "America/Indiana/Tell_City"}, { "name": "(GMT -05:00) America/Ojinaga", "id": "America/Ojinaga"}, { "name": "(GMT -05:00) Chile/EasterIsland", "id": "Chile/EasterIsland"}, { "name": "(GMT -05:00) America/Matamoros", "id": "America/Matamoros"}, { "name": "(GMT -05:00) CST6CDT", "id": "CST6CDT"}, { "name": "(GMT -05:00) America/Knox_IN", "id": "America/Knox_IN"}, { "name": "(GMT -05:00) America/Bogota", "id": "America/Bogota"}, { "name": "(GMT -05:00) America/Menominee", "id": "America/Menominee"}, { "name": "(GMT -05:00) America/Resolute", "id": "America/Resolute"}, { "name": "(GMT -05:00) SystemV/EST5", "id": "SystemV/EST5"}, { "name": "(GMT -05:00) Canada/Central", "id": "Canada/Central"}, { "name": "(GMT -05:00) Brazil/Acre", "id": "Brazil/Acre"}, { "name": "(GMT -05:00) America/Cancun", "id": "America/Cancun"}, { "name": "(GMT -05:00) America/Lima", "id": "America/Lima"}, { "name": "(GMT -05:00) US/Indiana-Starke", "id": "US/Indiana-Starke"}, { "name": "(GMT -05:00) America/Rio_Branco", "id": "America/Rio_Branco"}, { "name": "(GMT -05:00) SystemV/CST6CDT", "id": "SystemV/CST6CDT"}, { "name": "(GMT -05:00) Jamaica", "id": "Jamaica"}, { "name": "(GMT -05:00) America/North_Dakota/New_Salem", "id": "America/North_Dakota/New_Salem"}, { "name": "(GMT -05:00) America/Winnipeg", "id": "America/Winnipeg"}, { "name": "(GMT -04:00) America/Cuiaba", "id": "America/Cuiaba"}, { "name": "(GMT -04:00) America/Marigot", "id": "America/Marigot"}, { "name": "(GMT -04:00) America/Indiana/Petersburg", "id": "America/Indiana/Petersburg"}, { "name": "(GMT -04:00) America/Grand_Turk", "id": "America/Grand_Turk"}, { "name": "(GMT -04:00) Cuba", "id": "Cuba"}, { "name": "(GMT -04:00) Etc/GMT+4", "id": "Etc/GMT+4"}, { "name": "(GMT -04:00) America/Manaus", "id": "America/Manaus"}, { "name": "(GMT -04:00) America/Fort_Wayne", "id": "America/Fort_Wayne"}, { "name": "(GMT -04:00) America/St_Thomas", "id": "America/St_Thomas"}, { "name": "(GMT -04:00) America/Anguilla", "id": "America/Anguilla"}, { "name": "(GMT -04:00) America/Havana", "id": "America/Havana"}, { "name": "(GMT -04:00) US/Michigan", "id": "US/Michigan"}, { "name": "(GMT -04:00) America/Barbados", "id": "America/Barbados"}, { "name": "(GMT -04:00) America/Louisville", "id": "America/Louisville"}, { "name": "(GMT -04:00) America/Curacao", "id": "America/Curacao"}, { "name": "(GMT -04:00) America/Guyana", "id": "America/Guyana"}, { "name": "(GMT -04:00) America/Martinique", "id": "America/Martinique"}, { "name": "(GMT -04:00) America/Puerto_Rico", "id": "America/Puerto_Rico"}, { "name": "(GMT -04:00) America/Port_of_Spain", "id": "America/Port_of_Spain"}, { "name": "(GMT -04:00) SystemV/AST4", "id": "SystemV/AST4"}, { "name": "(GMT -04:00) America/Indiana/Vevay", "id": "America/Indiana/Vevay"}, { "name": "(GMT -04:00) America/Indiana/Vincennes", "id": "America/Indiana/Vincennes"}, { "name": "(GMT -04:00) America/Kralendijk", "id": "America/Kralendijk"}, { "name": "(GMT -04:00) America/Antigua", "id": "America/Antigua"}, { "name": "(GMT -04:00) America/Indianapolis", "id": "America/Indianapolis"}, { "name": "(GMT -04:00) America/Iqaluit", "id": "America/Iqaluit"}, { "name": "(GMT -04:00) America/St_Vincent", "id": "America/St_Vincent"}, { "name": "(GMT -04:00) America/Kentucky/Louisville", "id": "America/Kentucky/Louisville"}, { "name": "(GMT -04:00) America/Dominica", "id": "America/Dominica"}, { "name": "(GMT -04:00) EST5EDT", "id": "EST5EDT"}, { "name": "(GMT -04:00) America/Nassau", "id": "America/Nassau"}, { "name": "(GMT -04:00) America/Kentucky/Monticello", "id": "America/Kentucky/Monticello"}, { "name": "(GMT -04:00) Brazil/West", "id": "Brazil/West"}, { "name": "(GMT -04:00) America/Aruba", "id": "America/Aruba"}, { "name": "(GMT -04:00) America/Indiana/Indianapolis", "id": "America/Indiana/Indianapolis"}, { "name": "(GMT -04:00) America/La_Paz", "id": "America/La_Paz"}, { "name": "(GMT -04:00) America/Thunder_Bay", "id": "America/Thunder_Bay"}, { "name": "(GMT -04:00) America/Indiana/Marengo", "id": "America/Indiana/Marengo"}, { "name": "(GMT -04:00) America/Blanc-Sablon", "id": "America/Blanc-Sablon"}, { "name": "(GMT -04:00) America/Santo_Domingo", "id": "America/Santo_Domingo"}, { "name": "(GMT -04:00) US/Eastern", "id": "US/Eastern"}, { "name": "(GMT -04:00) Canada/Eastern", "id": "Canada/Eastern"}, { "name": "(GMT -04:00) America/Port-au-Prince", "id": "America/Port-au-Prince"}, { "name": "(GMT -04:00) America/St_Barthelemy", "id": "America/St_Barthelemy"}, { "name": "(GMT -04:00) America/Nipigon", "id": "America/Nipigon"}, { "name": "(GMT -04:00) US/East-Indiana", "id": "US/East-Indiana"}, { "name": "(GMT -04:00) America/St_Lucia", "id": "America/St_Lucia"}, { "name": "(GMT -04:00) America/Montserrat", "id": "America/Montserrat"}, { "name": "(GMT -04:00) America/Lower_Princes", "id": "America/Lower_Princes"}, { "name": "(GMT -04:00) America/Detroit", "id": "America/Detroit"}, { "name": "(GMT -04:00) America/Tortola", "id": "America/Tortola"}, { "name": "(GMT -04:00) America/Porto_Velho", "id": "America/Porto_Velho"}, { "name": "(GMT -04:00) America/Campo_Grande", "id": "America/Campo_Grande"}, { "name": "(GMT -04:00) America/Virgin", "id": "America/Virgin"}, { "name": "(GMT -04:00) America/Pangnirtung", "id": "America/Pangnirtung"}, { "name": "(GMT -04:00) America/Montreal", "id": "America/Montreal"}, { "name": "(GMT -04:00) America/Indiana/Winamac", "id": "America/Indiana/Winamac"}, { "name": "(GMT -04:00) America/Boa_Vista", "id": "America/Boa_Vista"}, { "name": "(GMT -04:00) America/Grenada", "id": "America/Grenada"}, { "name": "(GMT -04:00) America/New_York", "id": "America/New_York"}, { "name": "(GMT -04:00) America/St_Kitts", "id": "America/St_Kitts"}, { "name": "(GMT -04:00) America/Caracas", "id": "America/Caracas"}, { "name": "(GMT -04:00) America/Guadeloupe", "id": "America/Guadeloupe"}, { "name": "(GMT -04:00) America/Toronto", "id": "America/Toronto"}, { "name": "(GMT -04:00) SystemV/EST5EDT", "id": "SystemV/EST5EDT"}, { "name": "(GMT -03:00) Chile/Continental", "id": "Chile/Continental"}, { "name": "(GMT -03:00) America/Argentina/Catamarca", "id": "America/Argentina/Catamarca"}, { "name": "(GMT -03:00) Canada/Atlantic", "id": "Canada/Atlantic"}, { "name": "(GMT -03:00) America/Argentina/Cordoba", "id": "America/Argentina/Cordoba"}, { "name": "(GMT -03:00) America/Araguaina", "id": "America/Araguaina"}, { "name": "(GMT -03:00) America/Argentina/Salta", "id": "America/Argentina/Salta"}, { "name": "(GMT -03:00) Etc/GMT+3", "id": "Etc/GMT+3"}, { "name": "(GMT -03:00) America/Montevideo", "id": "America/Montevideo"}, { "name": "(GMT -03:00) Brazil/East", "id": "Brazil/East"}, { "name": "(GMT -03:00) America/Argentina/Mendoza", "id": "America/Argentina/Mendoza"}, { "name": "(GMT -03:00) America/Argentina/Rio_Gallegos", "id": "America/Argentina/Rio_Gallegos"}, { "name": "(GMT -03:00) America/Catamarca", "id": "America/Catamarca"}, { "name": "(GMT -03:00) America/Cordoba", "id": "America/Cordoba"}, { "name": "(GMT -03:00) America/Sao_Paulo", "id": "America/Sao_Paulo"}, { "name": "(GMT -03:00) America/Argentina/Jujuy", "id": "America/Argentina/Jujuy"}, { "name": "(GMT -03:00) America/Cayenne", "id": "America/Cayenne"}, { "name": "(GMT -03:00) America/Recife", "id": "America/Recife"}, { "name": "(GMT -03:00) America/Buenos_Aires", "id": "America/Buenos_Aires"}, { "name": "(GMT -03:00) America/Paramaribo", "id": "America/Paramaribo"}, { "name": "(GMT -03:00) America/Moncton", "id": "America/Moncton"}, { "name": "(GMT -03:00) America/Mendoza", "id": "America/Mendoza"}, { "name": "(GMT -03:00) America/Santarem", "id": "America/Santarem"}, { "name": "(GMT -03:00) America/Asuncion", "id": "America/Asuncion"}, { "name": "(GMT -03:00) Atlantic/Bermuda", "id": "Atlantic/Bermuda"}, { "name": "(GMT -03:00) America/Maceio", "id": "America/Maceio"}, { "name": "(GMT -03:00) Atlantic/Stanley", "id": "Atlantic/Stanley"}, { "name": "(GMT -03:00) America/Halifax", "id": "America/Halifax"}, { "name": "(GMT -03:00) Antarctica/Rothera", "id": "Antarctica/Rothera"}, { "name": "(GMT -03:00) America/Argentina/San_Luis", "id": "America/Argentina/San_Luis"}, { "name": "(GMT -03:00) America/Santiago", "id": "America/Santiago"}, { "name": "(GMT -03:00) America/Argentina/Ushuaia", "id": "America/Argentina/Ushuaia"}, { "name": "(GMT -03:00) Antarctica/Palmer", "id": "Antarctica/Palmer"}, { "name": "(GMT -03:00) America/Punta_Arenas", "id": "America/Punta_Arenas"}, { "name": "(GMT -03:00) America/Glace_Bay", "id": "America/Glace_Bay"}, { "name": "(GMT -03:00) America/Fortaleza", "id": "America/Fortaleza"}, { "name": "(GMT -03:00) America/Thule", "id": "America/Thule"}, { "name": "(GMT -03:00) America/Argentina/La_Rioja", "id": "America/Argentina/La_Rioja"}, { "name": "(GMT -03:00) America/Belem", "id": "America/Belem"}, { "name": "(GMT -03:00) America/Jujuy", "id": "America/Jujuy"}, { "name": "(GMT -03:00) America/Bahia", "id": "America/Bahia"}, { "name": "(GMT -03:00) America/Goose_Bay", "id": "America/Goose_Bay"}, { "name": "(GMT -03:00) America/Argentina/San_Juan", "id": "America/Argentina/San_Juan"}, { "name": "(GMT -03:00) America/Argentina/ComodRivadavia", "id": "America/Argentina/ComodRivadavia"}, { "name": "(GMT -03:00) America/Argentina/Tucuman", "id": "America/Argentina/Tucuman"}, { "name": "(GMT -03:00) America/Rosario", "id": "America/Rosario"}, { "name": "(GMT -03:00) SystemV/AST4ADT", "id": "SystemV/AST4ADT"}, { "name": "(GMT -03:00) America/Argentina/Buenos_Aires", "id": "America/Argentina/Buenos_Aires"}, { "name": "(GMT -02:30) America/St_Johns", "id": "America/St_Johns"}, { "name": "(GMT -02:30) Canada/Newfoundland", "id": "Canada/Newfoundland"}, { "name": "(GMT -02:00) America/Miquelon", "id": "America/Miquelon"}, { "name": "(GMT -02:00) Etc/GMT+2", "id": "Etc/GMT+2"}, { "name": "(GMT -02:00) America/Noronha", "id": "America/Noronha"}, { "name": "(GMT -02:00) Brazil/DeNoronha", "id": "Brazil/DeNoronha"}, { "name": "(GMT -02:00) Atlantic/South_Georgia", "id": "Atlantic/South_Georgia"}, { "name": "(GMT -01:00) Etc/GMT+1", "id": "Etc/GMT+1"}, { "name": "(GMT -01:00) America/Godthab", "id": "America/Godthab"}, { "name": "(GMT -01:00) Atlantic/Cape_Verde", "id": "Atlantic/Cape_Verde"}, { "name": "(GMT -01:00) America/Scoresbysund", "id": "America/Scoresbysund"}, { "name": "(GMT -01:00) America/Nuuk", "id": "America/Nuuk"}, { "name": "(GMT +00:00) GMT", "id": "GMT"}, { "name": "(GMT +00:00) Etc/GMT-0", "id": "Etc/GMT-0"}, { "name": "(GMT +00:00) Atlantic/St_Helena", "id": "Atlantic/St_Helena"}, { "name": "(GMT +00:00) Etc/GMT+0", "id": "Etc/GMT+0"}, { "name": "(GMT +00:00) Africa/Banjul", "id": "Africa/Banjul"}, { "name": "(GMT +00:00) Etc/GMT", "id": "Etc/GMT"}, { "name": "(GMT +00:00) Africa/Freetown", "id": "Africa/Freetown"}, { "name": "(GMT +00:00) Africa/Bamako", "id": "Africa/Bamako"}, { "name": "(GMT +00:00) Africa/Conakry", "id": "Africa/Conakry"}, { "name": "(GMT +00:00) Universal", "id": "Universal"}, { "name": "(GMT +00:00) Africa/Sao_Tome", "id": "Africa/Sao_Tome"}, { "name": "(GMT +00:00) Africa/Nouakchott", "id": "Africa/Nouakchott"}, { "name": "(GMT +00:00) UTC", "id": "UTC"}, { "name": "(GMT +00:00) Etc/Universal", "id": "Etc/Universal"}, { "name": "(GMT +00:00) Atlantic/Azores", "id": "Atlantic/Azores"}, { "name": "(GMT +00:00) Africa/Abidjan", "id": "Africa/Abidjan"}, { "name": "(GMT +00:00) Africa/Accra", "id": "Africa/Accra"}, { "name": "(GMT +00:00) Etc/UCT", "id": "Etc/UCT"}, { "name": "(GMT +00:00) GMT0", "id": "GMT0"}, { "name": "(GMT +00:00) Zulu", "id": "Zulu"}, { "name": "(GMT +00:00) Africa/Ouagadougou", "id": "Africa/Ouagadougou"}, { "name": "(GMT +00:00) Atlantic/Reykjavik", "id": "Atlantic/Reykjavik"}, { "name": "(GMT +00:00) Etc/Zulu", "id": "Etc/Zulu"}, { "name": "(GMT +00:00) Iceland", "id": "Iceland"}, { "name": "(GMT +00:00) Africa/Lome", "id": "Africa/Lome"}, { "name": "(GMT +00:00) Greenwich", "id": "Greenwich"}, { "name": "(GMT +00:00) Etc/GMT0", "id": "Etc/GMT0"}, { "name": "(GMT +00:00) America/Danmarkshavn", "id": "America/Danmarkshavn"}, { "name": "(GMT +00:00) Africa/Dakar", "id": "Africa/Dakar"}, { "name": "(GMT +00:00) Africa/Bissau", "id": "Africa/Bissau"}, { "name": "(GMT +00:00) Etc/Greenwich", "id": "Etc/Greenwich"}, { "name": "(GMT +00:00) Africa/Timbuktu", "id": "Africa/Timbuktu"}, { "name": "(GMT +00:00) UCT", "id": "UCT"}, { "name": "(GMT +00:00) Africa/Monrovia", "id": "Africa/Monrovia"}, { "name": "(GMT +00:00) Etc/UTC", "id": "Etc/UTC"}, { "name": "(GMT +01:00) Europe/London", "id": "Europe/London"}, { "name": "(GMT +01:00) Etc/GMT-1", "id": "Etc/GMT-1"}, { "name": "(GMT +01:00) Europe/Jersey", "id": "Europe/Jersey"}, { "name": "(GMT +01:00) Europe/Guernsey", "id": "Europe/Guernsey"}, { "name": "(GMT +01:00) Europe/Isle_of_Man", "id": "Europe/Isle_of_Man"}, { "name": "(GMT +01:00) Africa/Tunis", "id": "Africa/Tunis"}, { "name": "(GMT +01:00) Africa/Malabo", "id": "Africa/Malabo"}, { "name": "(GMT +01:00) GB-Eire", "id": "GB-Eire"}, { "name": "(GMT +01:00) Africa/Lagos", "id": "Africa/Lagos"}, { "name": "(GMT +01:00) Africa/Algiers", "id": "Africa/Algiers"}, { "name": "(GMT +01:00) GB", "id": "GB"}, { "name": "(GMT +01:00) Portugal", "id": "Portugal"}, { "name": "(GMT +01:00) Africa/Ndjamena", "id": "Africa/Ndjamena"}, { "name": "(GMT +01:00) Atlantic/Faeroe", "id": "Atlantic/Faeroe"}, { "name": "(GMT +01:00) Eire", "id": "Eire"}, { "name": "(GMT +01:00) Atlantic/Faroe", "id": "Atlantic/Faroe"}, { "name": "(GMT +01:00) Europe/Dublin", "id": "Europe/Dublin"}, { "name": "(GMT +01:00) Africa/Libreville", "id": "Africa/Libreville"}, { "name": "(GMT +01:00) Africa/El_Aaiun", "id": "Africa/El_Aaiun"}, { "name": "(GMT +01:00) Africa/Douala", "id": "Africa/Douala"}, { "name": "(GMT +01:00) Africa/Brazzaville", "id": "Africa/Brazzaville"}, { "name": "(GMT +01:00) Africa/Porto-Novo", "id": "Africa/Porto-Novo"}, { "name": "(GMT +01:00) Atlantic/Madeira", "id": "Atlantic/Madeira"}, { "name": "(GMT +01:00) Europe/Lisbon", "id": "Europe/Lisbon"}, { "name": "(GMT +01:00) Atlantic/Canary", "id": "Atlantic/Canary"}, { "name": "(GMT +01:00) Africa/Casablanca", "id": "Africa/Casablanca"}, { "name": "(GMT +01:00) Europe/Belfast", "id": "Europe/Belfast"}, { "name": "(GMT +01:00) Africa/Luanda", "id": "Africa/Luanda"}, { "name": "(GMT +01:00) Africa/Kinshasa", "id": "Africa/Kinshasa"}, { "name": "(GMT +01:00) Africa/Bangui", "id": "Africa/Bangui"}, { "name": "(GMT +01:00) WET", "id": "WET"}, { "name": "(GMT +01:00) Africa/Niamey", "id": "Africa/Niamey"}, { "name": "(GMT +02:00) Africa/Mbabane", "id": "Africa/Mbabane"}, { "name": "(GMT +02:00) Europe/Brussels", "id": "Europe/Brussels"}, { "name": "(GMT +02:00) Europe/Warsaw", "id": "Europe/Warsaw"}, { "name": "(GMT +02:00) CET", "id": "CET"}, { "name": "(GMT +02:00) Europe/Luxembourg", "id": "Europe/Luxembourg"}, { "name": "(GMT +02:00) Etc/GMT-2", "id": "Etc/GMT-2"}, { "name": "(GMT +02:00) Libya", "id": "Libya"}, { "name": "(GMT +02:00) Africa/Kigali", "id": "Africa/Kigali"}, { "name": "(GMT +02:00) Africa/Tripoli", "id": "Africa/Tripoli"}, { "name": "(GMT +02:00) Europe/Kaliningrad", "id": "Europe/Kaliningrad"}, { "name": "(GMT +02:00) Africa/Windhoek", "id": "Africa/Windhoek"}, { "name": "(GMT +02:00) Europe/Malta", "id": "Europe/Malta"}, { "name": "(GMT +02:00) Europe/Busingen", "id": "Europe/Busingen"}, { "name": "(GMT +02:00) Europe/Skopje", "id": "Europe/Skopje"}, { "name": "(GMT +02:00) Europe/Sarajevo", "id": "Europe/Sarajevo"}, { "name": "(GMT +02:00) Europe/Rome", "id": "Europe/Rome"}, { "name": "(GMT +02:00) Europe/Zurich", "id": "Europe/Zurich"}, { "name": "(GMT +02:00) Europe/Gibraltar", "id": "Europe/Gibraltar"}, { "name": "(GMT +02:00) Africa/Lubumbashi", "id": "Africa/Lubumbashi"}, { "name": "(GMT +02:00) Europe/Vaduz", "id": "Europe/Vaduz"}, { "name": "(GMT +02:00) Europe/Ljubljana", "id": "Europe/Ljubljana"}, { "name": "(GMT +02:00) Europe/Berlin", "id": "Europe/Berlin"}, { "name": "(GMT +02:00) Europe/Stockholm", "id": "Europe/Stockholm"}, { "name": "(GMT +02:00) Europe/Budapest", "id": "Europe/Budapest"}, { "name": "(GMT +02:00) Europe/Zagreb", "id": "Europe/Zagreb"}, { "name": "(GMT +02:00) Europe/Paris", "id": "Europe/Paris"}, { "name": "(GMT +02:00) Africa/Ceuta", "id": "Africa/Ceuta"}, { "name": "(GMT +02:00) Europe/Prague", "id": "Europe/Prague"}, { "name": "(GMT +02:00) Antarctica/Troll", "id": "Antarctica/Troll"}, { "name": "(GMT +02:00) Africa/Gaborone", "id": "Africa/Gaborone"}, { "name": "(GMT +02:00) Europe/Copenhagen", "id": "Europe/Copenhagen"}, { "name": "(GMT +02:00) Europe/Vienna", "id": "Europe/Vienna"}, { "name": "(GMT +02:00) Europe/Tirane", "id": "Europe/Tirane"}, { "name": "(GMT +02:00) MET", "id": "MET"}, { "name": "(GMT +02:00) Europe/Amsterdam", "id": "Europe/Amsterdam"}, { "name": "(GMT +02:00) Africa/Maputo", "id": "Africa/Maputo"}, { "name": "(GMT +02:00) Europe/San_Marino", "id": "Europe/San_Marino"}, { "name": "(GMT +02:00) Poland", "id": "Poland"}, { "name": "(GMT +02:00) Europe/Andorra", "id": "Europe/Andorra"}, { "name": "(GMT +02:00) Europe/Oslo", "id": "Europe/Oslo"}, { "name": "(GMT +02:00) Europe/Podgorica", "id": "Europe/Podgorica"}, { "name": "(GMT +02:00) Africa/Bujumbura", "id": "Africa/Bujumbura"}, { "name": "(GMT +02:00) Atlantic/Jan_Mayen", "id": "Atlantic/Jan_Mayen"}, { "name": "(GMT +02:00) Africa/Maseru", "id": "Africa/Maseru"}, { "name": "(GMT +02:00) Europe/Madrid", "id": "Europe/Madrid"}, { "name": "(GMT +02:00) Africa/Blantyre", "id": "Africa/Blantyre"}, { "name": "(GMT +02:00) Africa/Lusaka", "id": "Africa/Lusaka"}, { "name": "(GMT +02:00) Africa/Harare", "id": "Africa/Harare"}, { "name": "(GMT +02:00) Africa/Khartoum", "id": "Africa/Khartoum"}, { "name": "(GMT +02:00) Africa/Johannesburg", "id": "Africa/Johannesburg"}, { "name": "(GMT +02:00) Europe/Belgrade", "id": "Europe/Belgrade"}, { "name": "(GMT +02:00) Africa/Juba", "id": "Africa/Juba"}, { "name": "(GMT +02:00) Europe/Bratislava", "id": "Europe/Bratislava"}, { "name": "(GMT +02:00) Arctic/Longyearbyen", "id": "Arctic/Longyearbyen"}, { "name": "(GMT +02:00) Europe/Vatican", "id": "Europe/Vatican"}, { "name": "(GMT +02:00) Europe/Monaco", "id": "Europe/Monaco"}, { "name": "(GMT +03:00) Asia/Aden", "id": "Asia/Aden"}, { "name": "(GMT +03:00) Africa/Nairobi", "id": "Africa/Nairobi"}, { "name": "(GMT +03:00) Africa/Cairo", "id": "Africa/Cairo"}, { "name": "(GMT +03:00) Europe/Istanbul", "id": "Europe/Istanbul"}, { "name": "(GMT +03:00) Etc/GMT-3", "id": "Etc/GMT-3"}, { "name": "(GMT +03:00) Europe/Zaporozhye", "id": "Europe/Zaporozhye"}, { "name": "(GMT +03:00) Israel", "id": "Israel"}, { "name": "(GMT +03:00) Indian/Comoro", "id": "Indian/Comoro"}, { "name": "(GMT +03:00) Antarctica/Syowa", "id": "Antarctica/Syowa"}, { "name": "(GMT +03:00) Africa/Mogadishu", "id": "Africa/Mogadishu"}, { "name": "(GMT +03:00) Europe/Bucharest", "id": "Europe/Bucharest"}, { "name": "(GMT +03:00) Africa/Asmera", "id": "Africa/Asmera"}, { "name": "(GMT +03:00) Europe/Mariehamn", "id": "Europe/Mariehamn"}, { "name": "(GMT +03:00) Asia/Istanbul", "id": "Asia/Istanbul"}, { "name": "(GMT +03:00) Europe/Tiraspol", "id": "Europe/Tiraspol"}, { "name": "(GMT +03:00) Europe/Moscow", "id": "Europe/Moscow"}, { "name": "(GMT +03:00) Europe/Chisinau", "id": "Europe/Chisinau"}, { "name": "(GMT +03:00) Europe/Helsinki", "id": "Europe/Helsinki"}, { "name": "(GMT +03:00) Asia/Beirut", "id": "Asia/Beirut"}, { "name": "(GMT +03:00) Asia/Tel_Aviv", "id": "Asia/Tel_Aviv"}, { "name": "(GMT +03:00) Africa/Djibouti", "id": "Africa/Djibouti"}, { "name": "(GMT +03:00) Europe/Simferopol", "id": "Europe/Simferopol"}, { "name": "(GMT +03:00) Europe/Sofia", "id": "Europe/Sofia"}, { "name": "(GMT +03:00) Asia/Gaza", "id": "Asia/Gaza"}, { "name": "(GMT +03:00) Africa/Asmara", "id": "Africa/Asmara"}, { "name": "(GMT +03:00) Europe/Riga", "id": "Europe/Riga"}, { "name": "(GMT +03:00) Asia/Baghdad", "id": "Asia/Baghdad"}, { "name": "(GMT +03:00) Asia/Damascus", "id": "Asia/Damascus"}, { "name": "(GMT +03:00) Africa/Dar_es_Salaam", "id": "Africa/Dar_es_Salaam"}, { "name": "(GMT +03:00) Africa/Addis_Ababa", "id": "Africa/Addis_Ababa"}, { "name": "(GMT +03:00) Europe/Uzhgorod", "id": "Europe/Uzhgorod"}, { "name": "(GMT +03:00) Asia/Jerusalem", "id": "Asia/Jerusalem"}, { "name": "(GMT +03:00) Asia/Riyadh", "id": "Asia/Riyadh"}, { "name": "(GMT +03:00) Asia/Kuwait", "id": "Asia/Kuwait"}, { "name": "(GMT +03:00) Europe/Kirov", "id": "Europe/Kirov"}, { "name": "(GMT +03:00) Africa/Kampala", "id": "Africa/Kampala"}, { "name": "(GMT +03:00) Europe/Minsk", "id": "Europe/Minsk"}, { "name": "(GMT +03:00) Asia/Qatar", "id": "Asia/Qatar"}, { "name": "(GMT +03:00) Europe/Kiev", "id": "Europe/Kiev"}, { "name": "(GMT +03:00) Asia/Bahrain", "id": "Asia/Bahrain"}, { "name": "(GMT +03:00) Europe/Vilnius", "id": "Europe/Vilnius"}, { "name": "(GMT +03:00) Indian/Antananarivo", "id": "Indian/Antananarivo"}, { "name": "(GMT +03:00) Indian/Mayotte", "id": "Indian/Mayotte"}, { "name": "(GMT +03:00) Europe/Volgograd", "id": "Europe/Volgograd"}, { "name": "(GMT +03:00) Europe/Tallinn", "id": "Europe/Tallinn"}, { "name": "(GMT +03:00) Turkey", "id": "Turkey"}, { "name": "(GMT +03:00) Europe/Kyiv", "id": "Europe/Kyiv"}, { "name": "(GMT +03:00) Asia/Nicosia", "id": "Asia/Nicosia"}, { "name": "(GMT +03:00) Asia/Famagusta", "id": "Asia/Famagusta"}, { "name": "(GMT +03:00) W-SU", "id": "W-SU"}, { "name": "(GMT +03:00) EET", "id": "EET"}, { "name": "(GMT +03:00) Asia/Hebron", "id": "Asia/Hebron"}, { "name": "(GMT +03:00) Egypt", "id": "Egypt"}, { "name": "(GMT +03:00) Asia/Amman", "id": "Asia/Amman"}, { "name": "(GMT +03:00) Europe/Nicosia", "id": "Europe/Nicosia"}, { "name": "(GMT +03:00) Europe/Athens", "id": "Europe/Athens"}, { "name": "(GMT +03:30) Iran", "id": "Iran"}, { "name": "(GMT +03:30) Asia/Tehran", "id": "Asia/Tehran"}, { "name": "(GMT +04:00) Asia/Yerevan", "id": "Asia/Yerevan"}, { "name": "(GMT +04:00) Etc/GMT-4", "id": "Etc/GMT-4"}, { "name": "(GMT +04:00) Asia/Dubai", "id": "Asia/Dubai"}, { "name": "(GMT +04:00) Indian/Reunion", "id": "Indian/Reunion"}, { "name": "(GMT +04:00) Indian/Mauritius", "id": "Indian/Mauritius"}, { "name": "(GMT +04:00) Europe/Saratov", "id": "Europe/Saratov"}, { "name": "(GMT +04:00) Europe/Samara", "id": "Europe/Samara"}, { "name": "(GMT +04:00) Indian/Mahe", "id": "Indian/Mahe"}, { "name": "(GMT +04:00) Asia/Baku", "id": "Asia/Baku"}, { "name": "(GMT +04:00) Asia/Muscat", "id": "Asia/Muscat"}, { "name": "(GMT +04:00) Europe/Astrakhan", "id": "Europe/Astrakhan"}, { "name": "(GMT +04:00) Asia/Tbilisi", "id": "Asia/Tbilisi"}, { "name": "(GMT +04:00) Europe/Ulyanovsk", "id": "Europe/Ulyanovsk"}, { "name": "(GMT +04:30) Asia/Kabul", "id": "Asia/Kabul"}, { "name": "(GMT +05:00) Asia/Aqtau", "id": "Asia/Aqtau"}, { "name": "(GMT +05:00) Etc/GMT-5", "id": "Etc/GMT-5"}, { "name": "(GMT +05:00) Asia/Samarkand", "id": "Asia/Samarkand"}, { "name": "(GMT +05:00) Asia/Almaty", "id": "Asia/Almaty"}, { "name": "(GMT +05:00) Asia/Karachi", "id": "Asia/Karachi"}, { "name": "(GMT +05:00) Asia/Yekaterinburg", "id": "Asia/Yekaterinburg"}, { "name": "(GMT +05:00) Asia/Dushanbe", "id": "Asia/Dushanbe"}, { "name": "(GMT +05:00) Indian/Maldives", "id": "Indian/Maldives"}, { "name": "(GMT +05:00) Asia/Oral", "id": "Asia/Oral"}, { "name": "(GMT +05:00) Asia/Tashkent", "id": "Asia/Tashkent"}, { "name": "(GMT +05:00) Asia/Qostanay", "id": "Asia/Qostanay"}, { "name": "(GMT +05:00) Antarctica/Mawson", "id": "Antarctica/Mawson"}, { "name": "(GMT +05:00) Asia/Qyzylorda", "id": "Asia/Qyzylorda"}, { "name": "(GMT +05:00) Asia/Aqtobe", "id": "Asia/Aqtobe"}, { "name": "(GMT +05:00) Asia/Ashkhabad", "id": "Asia/Ashkhabad"}, { "name": "(GMT +05:00) Antarctica/Vostok", "id": "Antarctica/Vostok"}, { "name": "(GMT +05:00) Asia/Ashgabat", "id": "Asia/Ashgabat"}, { "name": "(GMT +05:00) Asia/Atyrau", "id": "Asia/Atyrau"}, { "name": "(GMT +05:00) Indian/Kerguelen", "id": "Indian/Kerguelen"}, { "name": "(GMT +05:30) Asia/Kolkata", "id": "Asia/Kolkata"}, { "name": "(GMT +05:30) Asia/Colombo", "id": "Asia/Colombo"}, { "name": "(GMT +05:30) Asia/Calcutta", "id": "Asia/Calcutta"}, { "name": "(GMT +05:45) Asia/Kathmandu", "id": "Asia/Kathmandu"}, { "name": "(GMT +05:45) Asia/Katmandu", "id": "Asia/Katmandu"}, { "name": "(GMT +06:00) Asia/Kashgar", "id": "Asia/Kashgar"}, { "name": "(GMT +06:00) Etc/GMT-6", "id": "Etc/GMT-6"}, { "name": "(GMT +06:00) Asia/Dacca", "id": "Asia/Dacca"}, { "name": "(GMT +06:00) Asia/Omsk", "id": "Asia/Omsk"}, { "name": "(GMT +06:00) Asia/Dhaka", "id": "Asia/Dhaka"}, { "name": "(GMT +06:00) Indian/Chagos", "id": "Indian/Chagos"}, { "name": "(GMT +06:00) Asia/Bishkek", "id": "Asia/Bishkek"}, { "name": "(GMT +06:00) Asia/Urumqi", "id": "Asia/Urumqi"}, { "name": "(GMT +06:00) Asia/Thimbu", "id": "Asia/Thimbu"}, { "name": "(GMT +06:00) Asia/Thimphu", "id": "Asia/Thimphu"}, { "name": "(GMT +06:30) Asia/Yangon", "id": "Asia/Yangon"}, { "name": "(GMT +06:30) Asia/Rangoon", "id": "Asia/Rangoon"}, { "name": "(GMT +06:30) Indian/Cocos", "id": "Indian/Cocos"}, { "name": "(GMT +07:00) Asia/Pontianak", "id": "Asia/Pontianak"}, { "name": "(GMT +07:00) Etc/GMT-7", "id": "Etc/GMT-7"}, { "name": "(GMT +07:00) Asia/Phnom_Penh", "id": "Asia/Phnom_Penh"}, { "name": "(GMT +07:00) Asia/Novosibirsk", "id": "Asia/Novosibirsk"}, { "name": "(GMT +07:00) Antarctica/Davis", "id": "Antarctica/Davis"}, { "name": "(GMT +07:00) Asia/Tomsk", "id": "Asia/Tomsk"}, { "name": "(GMT +07:00) Asia/Jakarta", "id": "Asia/Jakarta"}, { "name": "(GMT +07:00) Asia/Barnaul", "id": "Asia/Barnaul"}, { "name": "(GMT +07:00) Indian/Christmas", "id": "Indian/Christmas"}, { "name": "(GMT +07:00) Asia/Ho_Chi_Minh", "id": "Asia/Ho_Chi_Minh"}, { "name": "(GMT +07:00) Asia/Hovd", "id": "Asia/Hovd"}, { "name": "(GMT +07:00) Asia/Bangkok", "id": "Asia/Bangkok"}, { "name": "(GMT +07:00) Asia/Vientiane", "id": "Asia/Vientiane"}, { "name": "(GMT +07:00) Asia/Novokuznetsk", "id": "Asia/Novokuznetsk"}, { "name": "(GMT +07:00) Asia/Krasnoyarsk", "id": "Asia/Krasnoyarsk"}, { "name": "(GMT +07:00) Asia/Saigon", "id": "Asia/Saigon"}, { "name": "(GMT +08:00) Asia/Kuching", "id": "Asia/Kuching"}, { "name": "(GMT +08:00) Asia/Chungking", "id": "Asia/Chungking"}, { "name": "(GMT +08:00) Etc/GMT-8", "id": "Etc/GMT-8"}, { "name": "(GMT +08:00) Australia/Perth", "id": "Australia/Perth"}, { "name": "(GMT +08:00) Asia/Macao", "id": "Asia/Macao"}, { "name": "(GMT +08:00) Asia/Macau", "id": "Asia/Macau"}, { "name": "(GMT +08:00) Asia/Choibalsan", "id": "Asia/Choibalsan"}, { "name": "(GMT +08:00) Asia/Shanghai", "id": "Asia/Shanghai"}, { "name": "(GMT +08:00) Antarctica/Casey", "id": "Antarctica/Casey"}, { "name": "(GMT +08:00) Asia/Ulan_Bator", "id": "Asia/Ulan_Bator"}, { "name": "(GMT +08:00) Asia/Chongqing", "id": "Asia/Chongqing"}, { "name": "(GMT +08:00) Asia/Ulaanbaatar", "id": "Asia/Ulaanbaatar"}, { "name": "(GMT +08:00) Asia/Taipei", "id": "Asia/Taipei"}, { "name": "(GMT +08:00) Asia/Manila", "id": "Asia/Manila"}, { "name": "(GMT +08:00) PRC", "id": "PRC"}, { "name": "(GMT +08:00) Asia/Ujung_Pandang", "id": "Asia/Ujung_Pandang"}, { "name": "(GMT +08:00) Asia/Harbin", "id": "Asia/Harbin"}, { "name": "(GMT +08:00) Singapore", "id": "Singapore"}, { "name": "(GMT +08:00) Asia/Brunei", "id": "Asia/Brunei"}, { "name": "(GMT +08:00) Australia/West", "id": "Australia/West"}, { "name": "(GMT +08:00) Asia/Hong_Kong", "id": "Asia/Hong_Kong"}, { "name": "(GMT +08:00) Asia/Makassar", "id": "Asia/Makassar"}, { "name": "(GMT +08:00) Hongkong", "id": "Hongkong"}, { "name": "(GMT +08:00) Asia/Kuala_Lumpur", "id": "Asia/Kuala_Lumpur"}, { "name": "(GMT +08:00) Asia/Irkutsk", "id": "Asia/Irkutsk"}, { "name": "(GMT +08:00) Asia/Singapore", "id": "Asia/Singapore"}, { "name": "(GMT +08:45) Australia/Eucla", "id": "Australia/Eucla"}, { "name": "(GMT +09:00) Etc/GMT-9", "id": "Etc/GMT-9"}, { "name": "(GMT +09:00) Pacific/Palau", "id": "Pacific/Palau"}, { "name": "(GMT +09:00) Asia/Chita", "id": "Asia/Chita"}, { "name": "(GMT +09:00) Asia/Dili", "id": "Asia/Dili"}, { "name": "(GMT +09:00) Asia/Jayapura", "id": "Asia/Jayapura"}, { "name": "(GMT +09:00) Asia/Yakutsk", "id": "Asia/Yakutsk"}, { "name": "(GMT +09:00) Asia/Pyongyang", "id": "Asia/Pyongyang"}, { "name": "(GMT +09:00) ROK", "id": "ROK"}, { "name": "(GMT +09:00) Asia/Seoul", "id": "Asia/Seoul"}, { "name": "(GMT +09:00) Asia/Khandyga", "id": "Asia/Khandyga"}, { "name": "(GMT +09:00) Japan", "id": "Japan"}, { "name": "(GMT +09:00) Asia/Tokyo", "id": "Asia/Tokyo"}, { "name": "(GMT +09:30) Australia/North", "id": "Australia/North"}, { "name": "(GMT +09:30) Australia/Darwin", "id": "Australia/Darwin"}, { "name": "(GMT +10:00) Pacific/Yap", "id": "Pacific/Yap"}, { "name": "(GMT +10:00) Pacific/Port_Moresby", "id": "Pacific/Port_Moresby"}, { "name": "(GMT +10:00) Pacific/Chuuk", "id": "Pacific/Chuuk"}, { "name": "(GMT +10:00) Australia/Queensland", "id": "Australia/Queensland"}, { "name": "(GMT +10:00) Pacific/Guam", "id": "Pacific/Guam"}, { "name": "(GMT +10:00) Pacific/Truk", "id": "Pacific/Truk"}, { "name": "(GMT +10:00) Asia/Vladivostok", "id": "Asia/Vladivostok"}, { "name": "(GMT +10:00) Pacific/Saipan", "id": "Pacific/Saipan"}, { "name": "(GMT +10:00) Antarctica/DumontDUrville", "id": "Antarctica/DumontDUrville"}, { "name": "(GMT +10:00) Australia/Brisbane", "id": "Australia/Brisbane"}, { "name": "(GMT +10:00) Etc/GMT-10", "id": "Etc/GMT-10"}, { "name": "(GMT +10:00) Asia/Ust-Nera", "id": "Asia/Ust-Nera"}, { "name": "(GMT +10:00) Australia/Lindeman", "id": "Australia/Lindeman"}, { "name": "(GMT +10:30) Australia/Yancowinna", "id": "Australia/Yancowinna"}, { "name": "(GMT +10:30) Australia/Adelaide", "id": "Australia/Adelaide"}, { "name": "(GMT +10:30) Australia/Broken_Hill", "id": "Australia/Broken_Hill"}, { "name": "(GMT +10:30) Australia/South", "id": "Australia/South"}, { "name": "(GMT +11:00) Australia/Hobart", "id": "Australia/Hobart"}, { "name": "(GMT +11:00) Australia/Tasmania", "id": "Australia/Tasmania"}, { "name": "(GMT +11:00) Australia/ACT", "id": "Australia/ACT"}, { "name": "(GMT +11:00) Pacific/Ponape", "id": "Pacific/Ponape"}, { "name": "(GMT +11:00) Pacific/Bougainville", "id": "Pacific/Bougainville"}, { "name": "(GMT +11:00) Australia/Victoria", "id": "Australia/Victoria"}, { "name": "(GMT +11:00) Antarctica/Macquarie", "id": "Antarctica/Macquarie"}, { "name": "(GMT +11:00) Australia/Canberra", "id": "Australia/Canberra"}, { "name": "(GMT +11:00) Australia/Currie", "id": "Australia/Currie"}, { "name": "(GMT +11:00) Australia/Lord_Howe", "id": "Australia/Lord_Howe"}, { "name": "(GMT +11:00) Australia/NSW", "id": "Australia/NSW"}, { "name": "(GMT +11:00) Pacific/Pohnpei", "id": "Pacific/Pohnpei"}, { "name": "(GMT +11:00) Pacific/Efate", "id": "Pacific/Efate"}, { "name": "(GMT +11:00) Asia/Magadan", "id": "Asia/Magadan"}, { "name": "(GMT +11:00) Pacific/Kosrae", "id": "Pacific/Kosrae"}, { "name": "(GMT +11:00) Australia/Sydney", "id": "Australia/Sydney"}, { "name": "(GMT +11:00) Australia/LHI", "id": "Australia/LHI"}, { "name": "(GMT +11:00) Asia/Sakhalin", "id": "Asia/Sakhalin"}, { "name": "(GMT +11:00) Pacific/Noumea", "id": "Pacific/Noumea"}, { "name": "(GMT +11:00) Etc/GMT-11", "id": "Etc/GMT-11"}, { "name": "(GMT +11:00) Asia/Srednekolymsk", "id": "Asia/Srednekolymsk"}, { "name": "(GMT +11:00) Australia/Melbourne", "id": "Australia/Melbourne"}, { "name": "(GMT +11:00) Pacific/Guadalcanal", "id": "Pacific/Guadalcanal"}, { "name": "(GMT +12:00) Pacific/Kwajalein", "id": "Pacific/Kwajalein"}, { "name": "(GMT +12:00) Pacific/Wallis", "id": "Pacific/Wallis"}, { "name": "(GMT +12:00) Pacific/Fiji", "id": "Pacific/Fiji"}, { "name": "(GMT +12:00) Pacific/Funafuti", "id": "Pacific/Funafuti"}, { "name": "(GMT +12:00) Pacific/Nauru", "id": "Pacific/Nauru"}, { "name": "(GMT +12:00) Kwajalein", "id": "Kwajalein"}, { "name": "(GMT +12:00) Pacific/Wake", "id": "Pacific/Wake"}, { "name": "(GMT +12:00) Pacific/Norfolk", "id": "Pacific/Norfolk"}, { "name": "(GMT +12:00) Pacific/Tarawa", "id": "Pacific/Tarawa"}, { "name": "(GMT +12:00) Asia/Kamchatka", "id": "Asia/Kamchatka"}, { "name": "(GMT +12:00) Etc/GMT-12", "id": "Etc/GMT-12"}, { "name": "(GMT +12:00) Asia/Anadyr", "id": "Asia/Anadyr"}, { "name": "(GMT +12:00) Pacific/Majuro", "id": "Pacific/Majuro"}, { "name": "(GMT +13:00) Pacific/Fakaofo", "id": "Pacific/Fakaofo"}, { "name": "(GMT +13:00) Antarctica/McMurdo", "id": "Antarctica/McMurdo"}, { "name": "(GMT +13:00) Pacific/Enderbury", "id": "Pacific/Enderbury"}, { "name": "(GMT +13:00) NZ", "id": "NZ"}, { "name": "(GMT +13:00) Pacific/Apia", "id": "Pacific/Apia"}, { "name": "(GMT +13:00) Antarctica/South_Pole", "id": "Antarctica/South_Pole"}, { "name": "(GMT +13:00) Pacific/Kanton", "id": "Pacific/Kanton"}, { "name": "(GMT +13:00) Pacific/Auckland", "id": "Pacific/Auckland"}, { "name": "(GMT +13:00) Pacific/Tongatapu", "id": "Pacific/Tongatapu"}, { "name": "(GMT +13:00) Etc/GMT-13", "id": "Etc/GMT-13"}, { "name": "(GMT +13:45) NZ-CHAT", "id": "NZ-CHAT"}, { "name": "(GMT +13:45) Pacific/Chatham", "id": "Pacific/Chatham"}, { "name": "(GMT +14:00) Pacific/Kiritimati", "id": "Pacific/Kiritimati"}, { "name": "(GMT +14:00) Etc/GMT-14", "id": "Etc/GMT-14"} ], "onceonly_to_mins_sel": "00", "categoryName": [ "Server", "Router", "Switch", "Desktop", "Firewall", "DomainController", "LoadBalancer", "WANAccelerator", "Wireless", "UPS", "Printer", "Unknown", "Storage", "PDU", "UCS", "RAID", "FCSwitch", "TapeLibrary", "WirelessLANController", "WirelessAccessPoint", "IPMI", "MerakiController", "MerakiSecurity", "MerakiSwitch", "MerakiRadio", "MerakiVision", "MerakiCellularGateway", "SDN", "IoT", "SDWAN", "MerakiSensor", "Container" ], "selectedDevices": [ "10.5.5.1", "10.5.5.2" ], "once_endat": "2025-10-08", "availableDevices": [ "10.5.5.3", "10.5.5.4", "10.5.5.5", "10.5.5.6" ], "weekly_startweekdays": [ "Sunday", "Monday", "Tuesday", "Wednesday", "Thursday", "Friday", "Saturday" ], "categoryDispName": [ "Server", "Router", "Switch", "Desktop", "Firewall", "DomainController", "Load Balancer", "WAN Accelerator", "Wireless", "UPS", "Printer", "Unknown", "Storage", "PDU", "UCS", "RAID", "FCSwitch", "TapeLibrary", "Wireless LAN Controller", "Wireless Access Point", "IPMI", "Meraki Controller", "Meraki Security", "Meraki Switch", "Meraki Radio", "Meraki Vision", "Meraki Cellular Gateway", "SDN", "IoT", "SDWAN", "Meraki Sensor", "Container" ], "weekly_endweekdays": [ "Sunday", "Monday", "Tuesday", "Wednesday", "Thursday", "Friday", "Saturday" ], "daily_effectfrom": "2025-10-08", "daily_to_hrs_sel": "14", "selectedCateg": "Printer", "MS_INSTANCEID": "1", "onceonly_from_hrs_sel": "12", "onceonly_from_mins_sel": "00", "serverTimeZone": "Asia/Calcutta", "selectedDisplayDevices": [ "10.5.5.1", "10.5.5.2" ], "businessviewsCount": "", "recurrence": "OnceOnly", "schedulesList": [ "DemoSuppress", "DemoSchedule" ], "manageScheduleID": 10, "scheduleDesc": "For testing purpose", "suppressType": "Monitoring", "daily_to_mins_sel": "00", "selectDevicesMethod": "Category", "daily_from_hrs_sel": "12", "once_startat": "2025-10-08", "unmanageScheduleID": 11, "daily_from_mins_sel": "00", "availableDisplayDevices": [
"10.5.5.3", "10.5.5.4", "10.5.5.5", "10.5.5.6" ], "status": "Enabled", "onceonly_to_hrs_sel": "14"}
Rate limit: 50 requests per minute. Exceeding this limit will block requests for 1 minute

setManaged

Manage or Unmanage the devices,interfaces or URL monitors that are currently added in OpManager.

HTTP Method

POST

API URL

https://localhost:8060/api/json/device/setManaged?manage=true&apiKey=***************

Parameters

Param NameDescriptionData TypeAdditional InformationIs Mandatory
apiKeyAPI Key to access your OpManager server.String-Yes
manageEnables monitoring of devices or interfaces if manage=true, disables monitoring if manage=falseBoolean-Yes
isUrlURL monitorBoolean-No
isLicenseLicensed deviceBoolean-No
isInterfaceThis parameter will take effect only when the value 'INTERFACE' is supplied to type param. Set the value for this param as 'true' if the managed entity is an interface. By default, the entity will be assumed as device, hence it is not required to pass this parameter for managing device.Boolean-No
isMerakiUplinkCisco Meraki uplink deviceBoolean-No
typeType of the managed entityStringAllowed values: INTERFACE, URL, MerakiUplinkNo

Sample Response

HTTP Code: 200

{ "result":{ "message": "Device \"DemoDevice\" is being managed."}}
Rate limit: 100 requests per minute. Exceeding this limit will block requests for 5 minutes

Business views

getBusinessView

Lists all the business views created in OpManager.

HTTP Method

GET

API URL

https://localhost:8060/api/json/businessview/getBusinessView?apiKey=***************

Parameters

Param NameDescriptionData TypeAdditional InformationIs Mandatory
apiKeyAPI Key to access your OpManager server.String-Yes
isSubTabIndicates sub view within a Business viewBoolean-No
customerIDSpecifies the customer's ID used to fetch Business view for a specific business viewLong-No

Sample Response

HTTP Code: 200

{ "BusinessView":{ "Details": [ { "name": "New BusinessView_bv", "total": "3", "error": "0", "displayName": "New BusinessView", "status": "5", "alarms": "0"} ]}}
Rate limit: 200 requests per minute. Exceeding this limit will block requests for 1 minute

getBusinessDetailsView

Lists all the devices available in the given business view

HTTP Method

GET

API URL

https://localhost:8060/api/json/businessview/getBusinessDetailsView?apiKey=***************&bvName=ProductionSite_bv

Parameters

Param NameDescriptionData TypeAdditional InformationIs Mandatory
apiKeyAPI Key to access your OpManager server.String-Yes
bvNameName of the Business View (as shown in the URL of Business View page).String-Yes
viewLengthNumber of records to fetchInteger-Yes
startPointStarting index for recordsInteger-Yes

Sample Response

HTTP Code: 200

{ "BusinessDetailsView":{ "Details": [ { "severity": "5", "MemUtilization": 0, "CPUUtilization": 0, "displayName": "OPMSwitch_TeamA", "name": "OPMSwitch", "IpAddress": "127.0.0.1"} ], "TotalRecords": "3"}}
Rate limit: 100 requests per minute. Exceeding this limit will block requests for 1 minute

Custom Fields

listAdditionalFields

Retrieves all custom or additional fields defined for devices or interfaces.

HTTP Method

GET

API URL

https://localhost:8060/api/json/admin/listAdditionalFields?apiKey=*******************************&type=Device

Parameters

Param NameDescriptionData TypeAdditional InformationIs Mandatory
apiKeyAPI Key to access your OpManager server.String-Yes
typeSpecifies the entity type for which additional fields are requestedStringAllowed values: Device, Interface, CustFieldToGraph, WANLinkMonitor, WANLinkSite, WANLinkProps (case-insensitive)Yes

Sample Response

HTTP Code: 200

[ { "name": "SerialNumber", "description": "Serial Number of the device", "checked": true, "id": 1, "type": "Text", "delete": false}, { "name": "Model", "description": "Model of the device", "checked": false, "id": 2, "type": "Text", "delete": false}
]
Rate limit: 500 requests per minute. Exceeding this limit will block requests for 1 minute

Dashboard

getWidgetData

This API is used to fetch the data to be loaded for a given widget id.

HTTP Method

GET

API URL

https://localhost:8060/api/json/v2/dashboard/getWidgetData?apiKey=***************&widgetID=495

Parameters

Param NameDescriptionData TypeAdditional InformationIs Mandatory
apiKeyAPI Key to access your OpManager server.Yes
widgetIDThe widget ID for which data is to be fetched.
Can be retrieved from the API: getWidgetsList.
StringAllowed values: Positive numbers separated by commas (e.g., 1,2,3)Yes
widgetNameName of the widget for which data needs to be fetched. String-No
widgetTypeType of the widget as defined in the widget configuration (e.g., Heatmap, DeviceTree, Grid).
Can be retrieved from the API: getWidgetList.
StringAllowed values: depends on widget configuration (e.g., Heatmap, DeviceTree, Grid)No

Sample Response

HTTP Code: 200

{ "623":{ "WidgetName": "Devices by Availability", "WidgetData": [ { "displayName": "SampleDevice", "availability": "99.5%"} ], "Name": "widget.name.topnavail"}}
Rate limit: NO_TIME_LIMIT requests per minute. Exceeding this limit will block requests for NO_TIME_LIMIT minute

getWidgetsList

This API is used to list the widgets to be loaded for a given dashboard.

HTTP Method

GET

API URL

https://localhost:8060/api/json/dashboard/getWidgetsList?apiKey=***************&dashboardName=dashboardname

Parameters

Param NameDescriptionData TypeAdditional InformationIs Mandatory
apiKeyAPI Key to access your OpManager server.Yes
dashboardNameName of the dashboard.
Can be viewed or configured in the OpManager UI under Dashboards.
StringAllowed values: Any valid dashboard name (string value)Yes

Sample Response

HTTP Code: 200

{ "dashName": "Enterprise Dashboard", "dashboardID": "31", "isDashPropsAvailable": true, "isDefaultDashboard": true, "dashDesc": "contains widgets from all products", "noOfCols": "4", "colWidths": [ { "colWidth": "50", "colID": "1"}, { "colWidth": "50", "colID": "2"} ], "configureWidget": true, "editDashboard": false, "widgetList": []}
Rate limit: 30 requests per minute. Exceeding this limit will block requests for 1 minute

Devices

List Devices

Lists all devices monitored by OpManager - Version 1 API

HTTP Method

GET

API URL

https://localhost:8060/api/json/device/listDevices?apiKey=***************

Parameters

Param NameDescriptionData TypeAdditional InformationIs Mandatory
apiKeyAPI Key to access your OpManager server.String-Yes
subnetNameName of the subnetString-No
typeFetches the list of devices that fall under the given Device Type. [Example: type=Cisco2081]StringAllowed characters: A-Z, a-z, all Unicode letters, 0-9, space( ), comma(,), dot(.), hyphen(-), underscore(_), parenthesis(()), slash(/), plus(+), exclamation(!), at(@), hash(#), dollar($), square brackets([ ]), caret(^), colon(:), semicolon(;), equals(=), single quote(')No
categoryFetches the list of devices that fall under the given device category [Example: Server, Switch, etc.]StringAllowed characters: A-Z, a-z, 0-9, space( ), underscore(_), hyphen(-), dot(.)No
classificationFetches the list of devices that fall under the given device category [Example: Server, Switch, etc.]StringAllowed values: Network, Router, Switch, Printer, Server, PhysicalServer, Windows, Linux, MSSQL, Exchange, DomainController, Wireless, Firewall, IPMI, MonitoringAgentNo
isMapViewIs fetched from Maps pageBoolean-No
isFluidicSet value as 'true' by default.(for internal purpose)Boolean-No
isSubnetFilters device by IP SubnetBoolean-No
deviceNameName of the deviceString-No
appFetches the list of devices that have the given App in it and monitored in OpManager [Example: MSSQL, Exchange, Domain Controller]String-No
bvNameFetches the list of devices that are under the given Business View map nameString-No
vendorNameFetches the list of devices that have the given vendor nameStringAllowed characters: A-Z, a-z, all Unicode letters, 0-9, hyphen(-), parenthesis(()), dot(.), comma(,), underscore(_), slash(/), space( ), hash(#)No
vendorFetches the list of devices that have the given vendor name.StringAllowed characters: A-Z, a-z, all Unicode letters, 0-9, hyphen(-), parenthesis(()), dot(.), comma(,), underscore(_), slash(/), space( ), hash(#)No
protocolFilter devices by protocol [Example: all|SNMP|WMI|CLI|VIWebService|VIWMI|CLI|XenService|PrismAPI|NetAppAPI|SMI]String-No
severityFilter devices by severity [Example: 1 (Critical), 2 (Trouble), 3 (Attention), 4 (service down), 5 (Clear), 7 (Unmanaged)]StringAllowed characters: 1-11, comma(,)No
stateList of statesStringAllowed characters: 1-11, comma(,)No
subnetFilters device by specific IP SubnetString-No
pageTo fetch devices in batches. This should be combinedly used with 'rows' parameter. [Example: page=1, rows=200, page=2, rows=200]Integer-No
rowsTo fetch devices in batches. This should be combinedly used with 'page' parameter [Example: page=1, rows=200, page=2, rows=200]Integer-No
sortByTypeDefining sort type to be ascending or descendingStringAllowed values: asc, desc , ASC, DESCNo
sortByColumnSorting device list by columns [Example: displayName, interfaceCount, ipaddress, type, etc.]StringAllowed characters: A-Z, a-z, all Unicode letters, 0-9, underscore(_), space( )No
selectedVTypesFilter devices by Virtual device typeStringAllowed values: all, All, VMware, HyperV, Xen, Nutanix, Proxmox, VMware-VM, VMware-Host, VMware-vCenter, HyperV-Host, HyperV-VM, Xen-Host, Xen-VM, Nutanix-Cluster, Nutanix-Host, Nutanix-VM, Proxmox-Node, Proxmox-VM, Proxmox-Container, OPM-DEVICENo
fileTemplatefilters devices linked with a specific file monitoring templateLong-No
folderTemplatefilters devices linked with a specific folder monitoring templateLong-No
getInterfacesTo fetch devices with associated interfaces. Boolean value: Allowed Values: The input must exactly match either true or falseBoolean-No
isStorageIs storage deviceBoolean-No
storageCategoryStorage categoryStringAllowed values: RAID, TapeLibrary, FCSwitch, comma(,) (case-insensitive)No
excludeStorageWhether to exclude storage devices or notBoolean-No
groupNameFilter devices by Group nameStringAllowed characters: A-Z, a-z, all Unicode letters, 0-9, space( ), dot(.), exclamation(!), colon(:), at(@), hash(#), dollar($), hyphen(-), underscore(_), backslash(), slash(/), single quote('), comma(,)No
filtersapplies custom filter conditions to narrow device resultsString-No
_searchflag indicating whether a search operation is being performedBoolean-No
ndRequest timestampLong-No
skipLocalhostexcludes the OpManager server (localhost) from the device listBoolean-No
getMonitorsIncludes device monitor details in the response.Boolean-No
customFieldsTo fetch custom field values for the devices, supply the required custom field names in the 'customFields' param in the API request. Example: /api/json/device/listDevices?apiKey=***************&customFields=Building,Comments,FloorStringAllowed characters: A-Z, a-z, all Unicode letters, 0-9, space( ), dot(.), exclamation(!), colon(:), at(@), hash(#), dollar($), hyphen(-), underscore(_), backslash(), slash(/), single quote('), square brackets([ ]), comma(,)No
selectedMonTypefilters devices by specific monitor typeString-No
hideEmptyDeviceshides devices without any monitors or dataBoolean-No
probe_customer_idfilters devices by probe or customer IDLongAllowed values: >=1No
excludeIPMIExcludes IPMI devicesBoolean-No
excludeAPExcludes Access pointsBoolean-No
isLicenseViewshows device data based on license viewBoolean-No
isManagedWhether to list managed device aloneBoolean-No
pageNameidentifies the UI page or view requesting the dataStringAllowed values: InventoryNo
excludeAgentExcludes agent based devicesBoolean-No

Sample Response

HTTP Code: 200

[ { "isSNMP": true, "ipaddress": "10.5.5.1", "isSuppressed": false, "statusStr": "Clear", "prettyTime": "2 days ago", "displayName": "10.5.5.1", "isNew": false, "type": "Windows 10", "vendorName": "Microsoft", "deviceName": "10.5.5.1", "moid": 13699, "statusNum": "5", "suppressedMessage": "", "addedTime": "15 Oct 2025 12:37:55 PM IST", "numericStatus": "5", "interfaceCount": 0, "id": "13699", "mapName": "Desktops_Map.netmap", "category": "Desktop", "status": "<img src='/images/devices/status5.gif'>Clear"}, { "isSNMP": true, "ipaddress": "10.5.5.2", "isSuppressed": false, "statusStr": "Clear", "prettyTime": "2 days ago", "displayName": "10.5.5.2", "isNew": false, "type": "Windows 2019", "vendorName": "Microsoft", "deviceName": "10.5.5.2", "moid": 13710, "statusNum": "5", "suppressedMessage": "", "addedTime": "15 Oct 2025 12:37:56 PM IST", "numericStatus": "5", "interfaceCount": 0, "id": "13710", "mapName": "Servers_Map.netmap", "category": "Server", "status": "<img src='/images/devices/status5.gif'>Clear"}
]
Rate limit: 500 requests per minute. Exceeding this limit will block requests for 1 minute.

v2/listDevices

Lists all devices monitored by OpManager - Enhanced Version 2 API with additional fields

HTTP Method

GET

API URL

https://localhost:8060/api/json/v2/device/listDevices?apiKey=***************

Parameters

Param NameDescriptionData TypeAdditional InformationIs Mandatory
apiKeyAPI Key to access your OpManager server.String-Yes
subnetNameName of the subnetString-No
typeFetches the list of devices that fall under the given Device Type. [Example: type=Cisco2081]StringAllowed characters: A-Z, a-z, all Unicode letters, 0-9, space( ), comma(,), dot(.), hyphen(-), underscore(_), parenthesis(()), slash(/), plus(+), exclamation(!), at(@), hash(#), dollar($), square brackets([ ]), caret(^), colon(:), semicolon(;), equals(=), single quote(')No
categoryFetches the list of devices that fall under the given device category [Example: Server, Switch, etc.]StringAllowed characters: A-Z, a-z, 0-9, space( ), underscore(_), hyphen(-), dot(.)No
classificationDevice categoryStringAllowed values: Network, Router, Switch, Printer, Server, PhysicalServer, Windows, Linux, MSSQL, Exchange, DomainController, Wireless, Firewall, IPMI, MonitoringAgentNo
isMapViewIs fetched from Maps pageBoolean-No
isFluidicSet value as 'true' by default.(for internal purpose)Boolean-No
isSubnetFilters device by IP SubnetBoolean-No
deviceNameName of the deviceString-No
appFetches the list of devices that have the given App in it and monitored in OpManager [Example: MSSQL, Exchange, Domain Controller]String-No
bvNameFetches the list of devices that are under the given Business View map nameString-No
vendorNameName of the VendorStringAllowed characters: A-Z, a-z, all Unicode letters, 0-9, hyphen(-), parenthesis(()), dot(.), comma(,), underscore(_), slash(/), space( ), hash(#)No
vendorFetches the list of devices that have the given vendor name.StringAllowed characters: A-Z, a-z, all Unicode letters, 0-9, hyphen(-), parenthesis(()), dot(.), comma(,), underscore(_), slash(/), space( ), hash(#)No
protocolFilter devices by protocol [Example: all|SNMP|WMI|CLI|VIWebService|VIWMI|CLI|XenService|PrismAPI|NetAppAPI|SMI]String-No
severityFilter devices by severity [Example: 1 (Critical), 2 (Trouble), 3 (Attention), 4 (service down), 5 (Clear), 7 (Unmanaged)]StringAllowed characters: 1-11, comma(,)No
stateList of statesStringAllowed characters: 1-11, comma(,)No
subnetFilters device by specific IP SubnetString-No
pageTo fetch devices in batches. This should be combinedly used with 'rows' parameter. [Example: page=1, rows=200, page=2, rows=200]Integer-No
rowsTo fetch devices in batches. This should be combinedly used with 'page' parameter [Example: page=1, rows=200, page=2, rows=200]Integer-No
sortByTypeDefining sort type to be ascending or descendingStringAllowed values: asc, desc , ASC, DESCNo
sortByColumnSorting device list by columns [Example: displayName, interfaceCount, ipaddress, type, etc.]StringAllowed characters: A-Z, a-z, all Unicode letters, 0-9, underscore(_), space( )No
selectedVTypesFilter devices by Virtual device type [Allowed values: VMware-VM, VMware-Host, VMware-vCenter, HyperV-VM, HyperV-Host, Xen-VM, Xen-Host, Nutanix-VM, Nutanix-Host, Nutanix-Cluster]StringAllowed values: all, All, VMware, HyperV, Xen, Nutanix, Proxmox, VMware-VM, VMware-Host, VMware-vCenter, HyperV-Host, HyperV-VM, Xen-Host, Xen-VM, Nutanix-Cluster, Nutanix-Host, Nutanix-VM, Proxmox-Node, Proxmox-VM, Proxmox-Container, OPM-DEVICENo
fileTemplatefilters devices linked with a specific file monitoring templateLong-No
folderTemplatefilters devices linked with a specific folder monitoring templateLong-No
getInterfacesTo fetch devices with associated interfaces. Boolean value: Allowed Values: The input must exactly match either true or falseBoolean-No
isStorageIs storage deviceBoolean-No
storageCategoryStorage categoryStringAllowed values: RAID, TapeLibrary, FCSwitch, comma(,) (case-insensitive)No
excludeStorageWhether to exclude storage devices or notBoolean-No
groupNameFilter devices by Group nameStringAllowed characters: A-Z, a-z, all Unicode letters, 0-9, space( ), dot(.), exclamation(!), colon(:), at(@), hash(#), dollar($), hyphen(-), underscore(_), backslash(), slash(/), single quote('), comma(,)No
filtersapplies custom filter conditions to narrow device resultsString-No
_searchflag indicating whether a search operation is being performedBoolean-No
ndRequest timestampLong-No
skipLocalhostexcludes the OpManager server (localhost) from the device listBoolean-No
getMonitorsIncludes device monitor details in the response.Boolean-No
customFieldsTo fetch custom field values for the devices, supply the required custom field names in the 'customFields' param in the API request. Example: /api/json/device/listDevices?apiKey=***************&customFields=Building,Comments,FloorStringAllowed characters: A-Z, a-z, all Unicode letters, 0-9, space( ), dot(.), exclamation(!), colon(:), at(@), hash(#), dollar($), hyphen(-), underscore(_), backslash(), slash(/), single quote('), square brackets([ ]), comma(,)No
selectedMonTypefilters devices by specific monitor typeString-No
hideEmptyDeviceshides devices without any monitors or dataBoolean-No
probe_customer_idfilters devices by probe or customer IDLongAllowed values: >=1No
excludeIPMIExcludes IPMI devicesBoolean-No
excludeAPExcludes Access pointsBoolean-No
isLicenseViewshows device data based on license viewBoolean-No
isManagedWhether to list managed device aloneBoolean-No
pageNameidentifies the UI page or view requesting the dataStringAllowed values: InventoryNo
excludeAgentExcludes agent based devicesBoolean-No

Sample Response

HTTP Code: 200

{ "total": 0, "page": 1, "rows": [ { "isSNMP": true, "ipaddress": "10.5.5.1", "isSuppressed": false, "statusStr": "Clear", "prettyTime": "5 hours ago", "displayName": "10.5.5.1", "isNew": false, "type": "Windows 10", "vendorName": "Microsoft", "deviceName": "10.5.5.1", "moid": 341, "statusNum": "5", "suppressedMessage": "", "addedTime": "7 Oct 2025 11:08:30 AM IST", "interfaceCount": 0, "id": "341", "category": "Desktop"}, { "isSNMP": true, "ipaddress": "10.5.5.2", "isSuppressed": false, "statusStr": "Clear", "prettyTime": "5 hours ago", "displayName": "10.5.5.2", "isNew": false, "type": "Windows 2019", "vendorName": "Microsoft", "deviceName": "10.5.5.2", "moid": 362, "statusNum": "5", "suppressedMessage": "", "addedTime": "7 Oct 2025 11:08:31 AM IST", "interfaceCount": 0, "id": "362", "category": "Server"} ], "records": 2}
Rate limit: 500 requests per minute. Exceeding this limit will block requests for 1 minute

getDeviceInfo

Provides the Hardware Information of a device

HTTP Method

GET

API URL

https://localhost:8060/api/json/device/getDeviceInfo?apiKey=***************&deviceName=xxx.xxx.xx.x

Parameters

Param NameDescriptionData TypeAdditional InformationIs Mandatory
apiKeyAPI Key to access your OpManager server.Yes
deviceName/ipAddress/dnsNameEither one of these three parameters can be used to retrieve the device details. These parameters are the managed Entity name as seen in the URL of the device snapshot page (OR 'deviceName' property value in the listDevices API response), or the IP address of the device, or the DNS name of the device.deviceName(String)/ipAddress(ipAddress Regex)/dnsName(String)Yes

Sample Response

HTTP Code: 200

{ "OperatingSystem":"Windows", "MACAddress":"00:00:00:11:11:11", "SoftwareVersion":"10.0.1", "SerialNumber":"RKRRRR", "ServiceTag":"ADRRB126", "Model":"ProLiant BL460c", "Manufacturer":"HP", "HDD":"512", "RAM":"16384", "..
Rate limit: 60 requests per minute. Exceeding this limit will block requests for 1 minute

Set Device Info

Updates device information and configuration settings

HTTP Method

POST

API URL

https://localhost:8060/api/json/device/setDeviceInfo?apiKey=***************

Parameters

Param NameDescriptionData TypeAdditional InformationIs Mandatory
apiKeyAPI Key to access your OpManager server.String-Yes
deviceNameName of the device to updateString-Yes
locationDevice locationString-No
categoryDevice categoryString-No

Sample Response

HTTP Code: 200

{ "result":{ "status": "Success", "message": "Device information updated successfully"}}
Rate limit: 50 requests per minute. Exceeding this limit will block requests for 1 minute

Get Device Notes

Retrieves notes associated with a specific device

HTTP Method

GET

API URL

https://localhost:8060/api/json/device/getDeviceNotes?apiKey=***************&deviceName=devicename

Parameters

Param NameDescriptionData TypeAdditional InformationIs Mandatory
apiKeyAPI Key to access your OpManager server.String-Yes
deviceNameName of the deviceString-Yes

Sample Response

HTTP Code: 200

{ "notes": [ { "noteId": "101", "note": "Device maintenance completed on 2025-01-15", "createdBy": "admin", "createdTime": "2025-01-15 14:30:00"} ]}
Rate limit: 50 requests per minute. Exceeding this limit will block requests for 1 minute

getInfrastructureDetailsView

Retrieves detailed infrastructure view for devices and their relationships

HTTP Method

GET

API URL

https://localhost:8060/api/json/device/getInfrastructureDetailsView?apiKey=***************

Parameters

Param NameDescriptionData TypeAdditional InformationIs Mandatory
apiKeyAPI Key to access your OpManager server.String-Yes
categoryNameName of the device category. [Example: Server, Desktop etc]StringAllowed characters: A-Z, a-z, 0-9, space( ), underscore(_), hyphen(-), dot(.)Yes
viewLengthnumber of records to displayInteger-No
startPointstarting index for paginationInteger-No
isIphoneRequestindicates if the request comes from an iPhone clientBoolean-No

Sample Response

HTTP Code: 200

{ "InfrastructureDetailsView":{ "Details": [ { "intfCount": "0", "severity": "5", "displayName": "10.5.5.1", "name": "10.5.5.1", "IpAddress": "10.5.5.1", "type": "Linux", "monitors":{ "DiskUtilization": 0, "CPUUtilization": 0, "MemoryUtilization": 0}, "status": "Clear"}, { "intfCount": "0", "severity": "5", "displayName": "10.5.5.2", "name": "10.5.5.2", "IpAddress": "10.5.5.2", "type": "Windows 2016", "monitors":{ "DiskUtilization": 0, "CPUUtilization": 0, "MemoryUtilization": 0}, "status": "Clear"} ], "TotalRecords": "2"}}
Rate limit: 50 requests per minute. Exceeding this limit will block requests for 1 minute

getDeviceSummary

Provides the device details as in the Device snapshot page

HTTP Method

GET

API URL

https://localhost:8060/api/json/device/getDeviceSummary?apiKey=**************&name=opmserver.testdomain.com

Parameters

Param NameDescriptionData TypeAdditional InformationIs Mandatory
apiKeyAPI Key to access your OpManager server.Yes
nameName of the device - Managed Entity name as seen in the URL of device snapshot page OR 'deviceName' property value in the listDevices API response.String-Yes
isFluidicSet value as TRUE by default. (for internal purpose) String-No
snapTypeType of the device snapshot. If the device is monitored only in OpManager, set value as 'MonitoringDevice'. If Flow monitoring is enabled for this device, set value as 'FlowDevice'String-No
RouterIDRouter ID of the device if the snapType is set as 'FlowDevice'.String-No

Sample Response

HTTP Code: 200

{ "NFA_ID": "", "recBandwidth": "1", "IntfIpaddress": "127.0.0.1", "instance": "101", "displayName": "ciscostackswitchdevice874", "Util": "5", "availability":{ "Down": 0, "Dependent Unavailable": 0, "On Hold": 0, "Not Monitored": 0, "Parent Down": 98.34, "On Maintenance": 0, "Up": 1.66}, "avgOutPackets": "500 ", "outTraffic": "0.008 ", "moID": "10000000310", "isIPAvailable": true, "inSpeedDisplayValue": "1 bps", "intfDisplayName": "GigabitEthernet1/0/1", "txUtil": "0.89", "typeIdDescr": "Ethernet (6)", "operStateImg": "", "isSubInterface": "false", "managed": "true", "snapDetails":{ "snapList": [ { "indexCount": 0, "ondemandWidget": false, "refresh": false, "type": "IntfSummary", "sizex": 10, "expand": false, "apiurl": "/client/api/json/device/getInterfaceSummary", "rowNum": 1, "parameter": "interfaceName", "isEnabled": true, "colNum": 1, "name": "opm.interface.summary", "header": false, "id": 10000000081, "snapid": 10000000081, "snapshotData":{ "EE_PROBE_REQ": "true"}, "expandtime": false, "parameters": [], "sizey": 12, "timeSelection": false, "desc": "dashboard.name.nwconfig"}, { "indexCount": 1, "ondemandWidget": false, "refresh": false, "type": "IntfGraphs", "sizex": 10, "expand": false, "apiurl": "/client/api/json/device/getInterfaceGraphs", "rowNum": 13, "parameter": "interfaceName", "isEnabled": true, "colNum": 1, "name": "opm.interface.graphs", "header": true, "id": 10000000082, "snapid": 10000000082, "snapshotData":{ "EE_PROBE_REQ": "true"}, "expandtime": false, "parameters": [ { "param": "graphName", "paramData": [], "value": "totalPackets"}, { "param": "isFluidic", "paramData": [], "value": "true"}, { "paramType": "opmtime", "param": "period", "paramData": [], "value": "Today"} ], "sizey": 13, "timeSelection": true, "desc": "webclient.devices.details.totalbytes"}, { "indexCount": 2, "ondemandWidget": false, "refresh": false, "type": "IntfGraphs", "sizex": 10, "expand": false, "apiurl": "/client/api/json/device/getInterfaceGraphs", "rowNum": 15, "parameter": "interfaceName", "isEnabled": true, "colNum": 1, "name": "opm.interface.graphs", "header": true, "id": 10000000083, "snapid": 10000000083, "snapshotData":{ "EE_PROBE_REQ": "true"}, "expandtime": false, "parameters": [ { "param": "graphName", "paramData": [], "value": "traffic"}, { "param": "isFluidic", "paramData": [], "value": "true"}, { "paramType": "opmtime", "param": "period", "paramData": [], "value": "Today"} ], "sizey": 13, "timeSelection": true, "desc": "webclient.snapshot.name.Interface.Traffic"}, { "indexCount": 3, "ondemandWidget": false, "refresh": false, "type": "IntfGraphs", "sizex": 10, "expand": false, "apiurl": "/client/api/json/device/getInterfaceGraphs", "rowNum": 17, "parameter": "interfaceName", "isEnabled": true, "colNum": 1, "name": "opm.interface.graphs", "header": true, "id": 10000000084, "snapid": 10000000084, "snapshotData":{ "EE_PROBE_REQ": "true"}, "expandtime": false, "parameters": [ { "param": "graphName", "paramData": [], "value": "utilization"}, { "param": "isFluidic", "paramData": [], "value": "true"}, { "paramType": "opmtime", "param": "period", "paramData": [], "value": "Today"} ], "sizey": 13, "timeSelection": true, "desc": "webclient.snapshot.name.Interface.Utilization"}, { "indexCount": 4, "ondemandWidget": false, "refresh": false, "type": "IntfGraphs", "sizex": 10, "expand": false, "apiurl": "/client/api/json/device/getInterfaceGraphs", "rowNum": 19, "parameter": "interfaceName", "isEnabled": true, "colNum": 1, "name": "opm.interface.graphs", "header": true, "id": 10000000085, "snapid": 10000000085, "snapshotData":{ "EE_PROBE_REQ": "true"}, "expandtime": false, "parameters": [ { "param": "graphName", "paramData": [], "value": "errors"}, { "param": "isFluidic", "paramData": [], "value": "true"}, { "paramType": "opmtime", "param": "period", "paramData": [], "value": "Today"} ], "sizey": 13, "timeSelection": true, "desc": "webclient.devices.details.errndiscards"}, { "indexCount": 5, "ondemandWidget": false, "refresh": false, "type": "IntfGraphs", "sizex": 10, "expand": false, "apiurl": "/client/api/json/device/getInterfaceGraphs", "rowNum": 21, "parameter": "interfaceName", "isEnabled": true, "colNum": 1, "name": "opm.interface.graphs", "header": true, "id": 10000000086, "snapid": 10000000086, "snapshotData":{ "EE_PROBE_REQ": "true"}, "expandtime": false, "parameters": [ { "param": "graphName", "paramData": [], "value": "discardRate"}, { "param": "isFluidic", "paramData": [], "value": "true"}, { "paramType": "opmtime", "param": "period", "paramData": [], "value": "Today"} ], "sizey": 13, "timeSelection": true, "desc": "webclient.snapshot.name.Discard.Rate"}, { "indexCount": 6, "ondemandWidget": false, "refresh": false, "type": "IntfGraphs", "sizex": 10, "expand": false, "apiurl": "/client/api/json/device/getInterfaceGraphs", "rowNum": 23, "parameter": "interfaceName", "isEnabled": true, "colNum": 1, "name": "opm.interface.graphs", "header": true, "id": 10000000087, "snapid": 10000000087, "snapshotData":{ "EE_PROBE_REQ": "true"}, "expandtime": false, "parameters": [ { "param": "graphName", "paramData": [], "value": "packets"}, { "param": "isFluidic", "paramData": [], "value": "true"}, { "paramType": "opmtime", "param": "period", "paramData": [], "value": "Today"} ], "sizey": 13, "timeSelection": true, "desc": "opu.views.PACKETS"}, { "indexCount": 7, "ondemandWidget": false, "refresh": false, "type": "IntfGraphs", "sizex": 10, "expand": false, "apiurl": "/client/api/json/device/getInterfaceGraphs", "rowNum": 25, "parameter": "interfaceName", "isEnabled": true, "colNum": 1, "name": "opm.interface.graphs", "header": true, "id": 10000000088, "snapid": 10000000088, "snapshotData":{ "EE_PROBE_REQ": "true"}, "expandtime": false, "parameters": [ { "param": "graphName", "paramData": [], "value": "errorRate"}, { "param": "isFluidic", "paramData": [], "value": "true"}, { "paramType": "opmtime", "param": "period", "paramData": [], "value": "Today"} ], "sizey": 13, "timeSelection": true, "desc": "webclient.snapshot.name.Error.Rate"}, { "indexCount": 8, "ondemandWidget": false, "refresh": false, "type": "Grid", "sizex": 10, "expand": false, "apiurl": "/client/api/json/device/getInterfaceMonitors", "rowNum": 50, "parameter": "interfaceName", "isEnabled": true, "colNum": 1, "name": "opm.interface.monitors", "header": true, "id": 10000000089, "snapid": 10000000089, "snapshotData":{ "colModelList": [ { "name": "monitorName", "index": "monitorName"}, { "name": "interval", "index": "interval"}, { "name": "collectionTime", "index": "collectionTime"}, { "formatter": "intfValuesWithUnits", "name": "value", "index": "value"}, { "hidden": true, "name": "displayName", "index": "displayName"}, { "hidden": true, "name": "unit", "index": "unit"} ], "colNamesList": [ "webclient.devices.details.monitors", "webclient.map.edit.interval", "webclient.devices.details.lastpoll", "webclient.action.currVal", "", "" ], "EE_PROBE_REQ": "true"}, "expandtime": false, "parameters": [], "sizey": 14, "timeSelection": false, "desc": "webclient.admin.url.monitors"}, { "indexCount": 9, "ondemandWidget": false, "refresh": false, "type": "Grid", "sizex": 10, "expand": false, "apiurl": "/client/api/json/device/getInterfaceMonitors", "rowNum": 50, "parameter": "interfaceName", "isEnabled": true, "colNum": 1, "name": "opm.interface.monitors", "header": true, "id": 10000000971, "snapid": 10000000971, "snapshotData":{ "colModelList": [ { "name": "monitorName", "index": "monitorName"}, { "name": "interval", "index": "interval"}, { "name": "collectionTime", "index": "collectionTime"}, { "formatter": "intfValuesWithUnits", "name": "value", "index": "value"}, { "hidden": true, "name": "displayName", "index": "displayName"}, { "hidden": true, "name": "unit", "index": "unit"} ], "colNamesList": [ "webclient.devices.details.monitors", "webclient.map.edit.interval", "webclient.devices.details.lastpoll", "webclient.action.currVal", "", "" ], "EE_PROBE_REQ": "true"}, "expandtime": false, "parameters": [], "sizey": 14, "timeSelection": false, "desc": "webclient.admin.url.monitors"}, { "indexCount": 10, "ondemandWidget": false, "refresh": false, "type": "Grid", "sizex": 10, "expand": false, "apiurl": "/client/api/json/device/getInterfaceNotes", "rowNum": 64, "parameter": "interfaceName", "isEnabled": true, "colNum": 1, "name": "opm.interface.notes", "header": true, "id": 10000000090, "snapid": 10000000090, "snapshotData":{ "colModelList": [ { "hidden": true, "classes": "GridColHidden", "name": "ALIASNAME", "width": "0", "index": "ALIASNAME", "key": true}, { "hidden": true, "classes": "GridColHidden", "name": "DATATYPE", "width": "0", "index": "DATATYPE", "key": true}, { "formatter": "custField_escapeHtmlTags", "name": "FIELDNAME", "index": "FIELDNAME"}, { "formatter": "custField_escapeHtmlTags", "name": "DESCRIPTION", "index": "DESCRIPTION"}, { "formatter": "custField_escapeHtmlTags", "name": "FIELDVALUE", "index": "FIELDVALUE"} ], "actionurls": [ { "name": "Edit", "url": "InterfaceNotes"} ], "colNamesList": [ "", "", "webclient.devices.customfields.fieldname", "webclient.devices.customfields.description", "webclient.widget.value" ]}, "expandtime": false, "parameters": [], "sizey": 14, "timeSelection": false, "desc": "webclient.commontext.customfields"} ], "snapshotID": "10000000005", "snapshotDesc": "snapshot.desc.Interface", "snapshotName": "OPMInterface", "tabs":{ "tabs": [ { "tabid": 10000000026, "name": "webclient.snapshot.testlinks.summary", "order": 1}, { "tabid": 10000000027, "name": "webclient.snapshot.name.Interface.Graphs", "order": 2}, { "tabid": 10000000028, "name": "webclient.admin.url.monitors", "order": 3} ], "tabWidgets":{ "10000000028": [ { "ROW": 50, "ASSOCIATIONID": 10000000089} ], "10000000027": [ { "ROW": 13, "ASSOCIATIONID": 10000000082}, { "ROW": 15, "ASSOCIATIONID": 10000000083}, { "ROW": 17, "ASSOCIATIONID": 10000000084}, { "ROW": 19, "ASSOCIATIONID": 10000000085}, { "ROW": 21, "ASSOCIATIONID": 10000000086}, { "ROW": 23, "ASSOCIATIONID": 10000000087}, { "ROW": 25, "ASSOCIATIONID": 10000000088} ], "10000000026": [ { "ROW": 1, "ASSOCIATIONID": 10000000081}, { "ROW": 64, "ASSOCIATIONID": 10000000090} ]}}, "timeSelectionNeeded": true, "yScale": 25, "maxColumns": 10}, "ifPhysAddr": "20", "adminState": "Up", "transBandwidth": "1", "statusPolledVia": "SNMP", "outSpeedDisplayValue": "1 bps", "rstime": "1 bps", "availabilityTimeLine": [ "ParentDown,1670178610981,1670233674317", "ParentDown,1670234394000,1670234514150", "UP,1670234514150,1670237050981", "UP,1670233674317,1670234394000" ], "rxPackets": "0.005 ", "ifAdminStatus": "1", "rxUtil": "0.89", "ifSpeedIn": "1", "isAddedToNFA": "false", "Discards": "2", "stringStatus": "Down", "txPackets": "0.002 ", "Errors": "2", "ifSpeedOut": "1", "inTraffic": "0.008 ", "operState": "Up", "intfmanaged": "true", "name": "xxx.xxx.x.xx.10000000001", "typeId": "6", "ifOperStatus": "1", "category": "Switch", "adminStateImg": "", "avgInPackets": "200 ", "status": "2", "desc": "GigabitEthernet1/0/1", "trafficCounter": "32 bit"}
Rate limit: 500 requests per minute. Exceeding this limit will block requests for 1 minute

getDeviceCompleteDetails

Lists the basic details and availability of the device

HTTP Method

GET

API URL

https://localhost:8060/api/json/v2/device/getDeviceCompleteDetails?apiKey=***************&name=devicename

Parameters

Param NameDescriptionData TypeAdditional InformationIs Mandatory
apiKeyAPI Key to access your OpManager server.Yes
nameName of the device.StringName of the device - Managed Entity name as seen in the URL of device snapshot page OR 'deviceName' property value in the listDevices API response.Yes

Sample Response

HTTP Code: 200

{ "nfadetails":{ "NFAStatus": "Not Added"}, "statusStr": "Critical", "responseTime": "001ms", "format": "dd-MM-yy HH:mm:ss", "dnsName": "xxx.xxx.xxx.xx", "timeZone": "Asia/Calcutta", "availability": [ "DownTime,1672597848117,1672654248117" ], "todayTimeAvail":{ "todayStartTime": "1672597848132", "endTimeVal": "1672654248132"}, "type": "Cisco 2800 Series", "vendorName": "Cisco", "statusNum": "1", "isStorage": false, "ncmdetails":{ "SUMMARY_NOT_AVAILABLE": true}, "packetLoss": "11", "configBackup":{ "RunningConfig":{}, "StartupConfig":{}}, "opmdetails":{ "Type": "Cisco 2800 Series", "dependentDisplayName": "None", "Category": "Server", "hardwareInfo":{ "HW_MANUFACTURER": "Cisco", "HW_SERIALNUMBER": "FHK1112F402", "IS_ALARM_SUPPRESSED": "false", "ISPDPresent": false, "HW_MODEL": "CISCO2801", "LAST_UPDATED_TIME": "May 10, 2018 05:39 AM", "MOID": 8438, "IS_MONITORED": "true"}, "displayCategory": "Servers", "PollInterval": "7", "IPAddress": "xxx.xxx.xx.xx", "DNSName": "xxx.xxx.xx.xx", "SysDescription": "Cisco IOS Software, 2801 Software (C2801-ADVENTERPRISEK9-M), Version 15.1(3)T1, RELEASE SOFTWARE (fc2)\r\nTechnical Support: http://www.cisco.com/techsupport\r\nCopyright (c) 1986-2011 by Cisco Systems, Inc.\r\nCompiled Sun 27-Mar-11 07:15 by prod_rel_team", "Monitoring": "ICMP", "UpLinkDependency": "None"}, "state": "2", "availdata":{ "Down": 100, "Dependent Unavailable": 0, "On Hold": 0, "Not Monitored": 0, "Parent Down": 0, "On Maintenance": 0, "Up": 0}}
Rate limit: 500 requests per minute. Exceeding this limit will block requests for 1 minute

listVirtualDevices

Lists all virtual devices (VMs, containers) monitored by OpManager

HTTP Method

GET

API URL

https://localhost:8060/api/json/device/listVirtualDevices?apiKey=***************

Parameters

Param NameDescriptionData TypeAdditional InformationIs Mandatory
apiKeyAPI Key to access your OpManager server.Yes
virtualDeviceTypeType of virtual entity which you want to list.StringAny one of the following - VHOST,VDATASTORE,VM,VCENTER,VxRail,HyperV-Host,HyperV-VM,HyperV-Disk,Xen-Host,Xen-VM,Xen-SR,Xen-Pool,Nutanix-Cluster,Nutanix-Host,Nutanix-VM,VMware-Parent,Proxmox-Node,Proxmox-VM,Proxmox-Container,Proxmox-ClusterYes

Sample Response

HTTP Code: 200

{ "VENDOR_NAME": "VMware, Inc.", "BUILD_INFO": "VMware ESXi 6.7.0 build-8169922", "CPU_PACKAGES": 2, "TotalDataStores": 2, "NUM_PNIC": 2, "OS_TYPE": "vmnix-x86", "CPU_MODEL": "Intel(R) Xeon(R) Silver 4114 CPU @ 2.20GHz", "MAINTENANCE_MODE": false, "TotalVms": 11, "VCENTERDISPLAYNAME": "opm-user-vc", "SYSUPTIME": "2021-09-19 21:24:17.745", "CONNECTION_STATUS": "connected", "CPU_THREADS": 40, "CPU_SPEED_MHZ": 2194, "HARDWARE_VENDOR": "Dell Inc.", "NUM_HBA": 3, "CPU_CORES": "20 x 2.20GHz", "LASTUPDATEDTIME": "2023-01-09 17:47:25.159", "MEM_CAPACITY_MB": "127 GB ", "VCENTERNAME": "opm-user-vc.xxx.usercorpin.com", "UUID": "4c4c4544-0047-4b10-8043-c4c04f305432", "HARDWARE_MODEL": "PowerEdge C6420", "ENTITYNAME": "xxx.xx.xxx.xx", "POWER_STATE": "On"}
Rate limit: 500 requests per minute. Exceeding this limit will block requests for 1 minute

Get VMWare Hosts

Retrieves information about VMware ESXi hosts

HTTP Method

GET

API URL

https://localhost:8060/api/json/device/getVMWareHosts?apiKey=***************&deviceName=vcenter-server

Parameters

Param NameDescriptionData TypeAdditional InformationIs Mandatory
apiKeyAPI Key to access your OpManager server.Yes
nameName of the vCenter device - Managed Entity name as seen in the URL of device snapshot page OR 'deviceName' property value in the listDevices API response.String-Yes
typeType of the Entity like VCENTER|VXRAILStringAllowed Values: The input must be exactly one of the following — VCENTER,VXRAILYes

Sample Response

HTTP Code: 200

[ { "DISPLAYNAME": "ESXHost-2", "STATUS_STR": "Critical", "NUM_PNIC": 2, "OS": "ESXServer", "OS_TYPE": "vmnix-x86", "SYSUPTIME": "Apr 22, 2023 21:52 PM", "CONNECTION_STATUS": "connected", "NAME": "ESXHost-2", "VHOST_ID": 23703, "STATUS": "1", "CPU_SPEED_MHZ": 2195, "MEM_CAPACITY_MB": 130698, "POWER_STATE": "On"}, { "DISPLAYNAME": "ESXHost-1", "STATUS_STR": "Clear", "NUM_PNIC": 2, "OS": "ESXServer", "OS_TYPE": "vmnix-x86", "SYSUPTIME": "Apr 23, 2023 01:53 AM", "CONNECTION_STATUS": "connected", "NAME": "ESXHost-1", "VHOST_ID": 22505, "STATUS": "5", "CPU_SPEED_MHZ": 2195, "MEM_CAPACITY_MB": 130698, "POWER_STATE": "On"}
]
Rate limit: 500 requests per minute. Exceeding this limit will block requests for 1 minute

getDataCenterDetails

Lists all the Datacenters present in a particular vCenter

HTTP Method

GET

API URL

http://localhost:8060/api/json/device/getDataCenterDetails?apiKey=***************&moID=13

Parameters

Param NameDescriptionData TypeAdditional InformationIs Mandatory
apiKeyAPI Key to access your OpManager server. Yes
moIDUnique ID for vCenter device - 'moID' property value in the getDeviceSummary API response.long-Yes

Sample Response

HTTP Code: 200

[ { "NO_OF_DATASTORES": 5, "STATUS_STR": "Unknown", "STATUS": "7", "NO_OF_NETWORKS": 3, "ENTITY_NAME": "Datacenter"}, { "NO_OF_DATASTORES": 0, "STATUS_STR": "Unknown", "STATUS": "7", "NO_OF_NETWORKS": 0, "ENTITY_NAME": "Datacenter 2"}, { "NO_OF_DATASTORES": 0, "STATUS_STR": "Unknown", "STATUS": "7", "NO_OF_NETWORKS": 0, "ENTITY_NAME": "Datacenter 1"}
]
Rate limit: 500 requests per minute. Exceeding this limit will block requests for 1 minute

getClusterDetails

Lists all the Clusters present in a particular vCenter

HTTP Method

GET

API URL

http://localhost:8060/api/json/device/getClusterDetails?apiKey=***************&moID=13

Parameters

Param NameDescriptionData TypeAdditional InformationIs Mandatory
apiKeyAPI Key to access your OpManager server. Yes
moIDUnique ID for vCenter device - 'moID' property value in the getDeviceSummary API response.long-Yes

Sample Response

HTTP Code: 200

[ { "NO_OF_DATASTORES": 5, "STATUS_STR": "Clear", "STATUS": "5", "NO_OF_NETWORKS": 2, "EFFECTIVE_CPU": 76780, "NO_OF_HOSTS": 2, "TOTAL_CPU_GHZ": 86, "DRS_ENABLED": false, "DAS_ENABLED": true, "EFFECTIVE_MEMORY": 208229, "ENTITY_NAME": "VSANLab", "TOTAL_MEMORY_GB": 255}
]
Rate limit: 500 requests per minute. Exceeding this limit will block requests for 1 minute

getVMWareVMs

Retrieves information about VMware virtual machines

HTTP Method

GET

API URL

https://localhost:8060/api/json/device/getVMWareVMs?apiKey=***************&deviceName=vcenter-server

Parameters

Param NameDescriptionData TypeAdditional InformationIs Mandatory
apiKeyAPI Key to access your OpManager server.Yes
nameName of the selected entity type - Managed Entity name as seen in the URL of device snapshot page OR 'deviceName' property value in the listDevices API response.String-Yes
typeType of the EntityStringAny one of the values - VCENTER,HOST,DATASTORE,VXRAILNo

Sample Response

HTTP Code: 200

[ { "VM_CONNECTIONSTATE": "connected", "DISPLAYNAME": "VMware-vm1", "VM_ID": 33002, "VIRTUAL_TYPE": "VMware-VM", "NUM_ETHERNET": 1, "VM_POWERSTATE": "Off", "OS_NAME": "CentOS 4/5 or later (32-bit)", "NUM_VDISK": 1, "VHOST_ID": 22505, "MEMORY_MB": 1024, "MOID": -4, "IS_ORPHANED": "false", "NUM_VCPU": 1}, { "VM_CONNECTIONSTATE": "connected", "DISPLAYNAME": "VMware-VM2", "STATUS_STR": "Trouble", "VM_ID": 23716, "VIRTUAL_TYPE": "VMware-VM", "NUM_ETHERNET": 1, "VM_POWERSTATE": "On", "MAX_CPU_MHZ": 17560, "IPADDRESS": "172.24.141.242", "OS_NAME": "Microsoft Windows Server 2016 (64-bit)", "NUM_VDISK": 1, "NAME": "VMware-VM-3", "VHOST_ID": 23703, "MEMORY_MB": 16384, "STATUS": "2", "MOID": 27302, "MAX_MEMORY_MB": 16384, "IS_ORPHANED": "false", "NUM_VCPU": 8}
]
Rate limit: 500 requests per minute. Exceeding this limit will block requests for 1 minute

getVMWareDataStores

Retrieves information about VMware datastores

HTTP Method

GET

API URL

https://localhost:8060/api/json/device/getVMWareDataStores?apiKey=***************&deviceName=vcenter-server

Parameters

Param NameDescriptionData TypeAdditional InformationIs Mandatory
apiKeyAPI Key to access your OpManager server.Yes
nameName of the selected entity type - Managed Entity name as seen in the URL of device snapshot page OR 'deviceName' property value in the listDevices API response.String-Yes
typeType of the Entity like VCENTER|HOST|VM|VXRAILStringAllowed Values: The input must be exactly one of the following — VCENTER,HOST,VM,VXRAILNo

Sample Response

HTTP Code: 200

[ { "HostCount": 1, "DATASTORENAME": "VMDatastorage (1)", "Datastore_ID": 23719, "FILESYSTEM_TYPE": "VMFS", "CAPACITY_MB": 3224, "DATASTORE_URL": "ds:///vmfs/volumes/442ec0fc-67dad2ec-386f-b496913ce490/", "MOID": 48373, "FREESPACE_MB": 615, "deviceName": "device1_com_datastore-1923", "IS_ACCESSIBLE": "5"}, { "HostCount": 1, "DATASTORENAME": "VMFSdatastore (3)", "Datastore_ID": 23718, "FILESYSTEM_TYPE": "VMFS", "CAPACITY_MB": 492, "DATASTORE_URL": "ds:///vmfs/volumes/342ebecc-2b289b6a-dd6e-b496913ce490/", "MOID": 48372, "FREESPACE_MB": 427, "deviceName": "device2_datastore-1922", "IS_ACCESSIBLE": "5"}, { "HostCount": 2, "DATASTORENAME": "VSANDatastore", "Datastore_ID": 32101, "FILESYSTEM_TYPE": "vsan", "CAPACITY_MB": 1862, "DATASTORE_URL": "ds:///vmfs/volumes/vsan:56f4a7b4df993895-66fa8c0ed80efd32/", "MOID": 61801, "FREESPACE_MB": 1840, "deviceName": "device3_datastore-2718", "IS_ACCESSIBLE": "5"}
]
Rate limit: 500 requests per minute. Exceeding this limit will block requests for 1 minute

getNutanixVDisks

Retrieves information about virtual disks in the Nutanix cluster

HTTP Method

GET

API URL

https://localhost:8060/api/json/device/getNutanixVDisks?apiKey=***************&deviceName=nutanix-cluster

Parameters

Param NameDescriptionData TypeAdditional InformationIs Mandatory
apiKeyAPI Key to access your OpManager server.Yes
nameName of the selected entity type - Managed Entity name as seen in the URL of device snapshot page OR 'deviceName' property value in the listDevices API response.String-Yes

Sample Response

HTTP Code: 200

[ { "CAPACITY": "150", "NFSFILEPATH": "/General/.acropolis/vmdisk/343e6469-b11d-e321-b30a-1598371a20f8", "VDISK_ID": 1, "DISKADDRESS": "scsi.0", "UUID": "343e6469-b11d-e321-b30a-1598371a20f8"}
]
Rate limit: 500 requests per minute. Exceeding this limit will block requests for 1 minute

getNutanixDetails

Retrieves detailed information about Nutanix cluster and nodes

HTTP Method

GET

API URL

https://localhost:8060/api/json/device/getNutanixDetails?apiKey=***************&deviceName=nutanix-cluster

Parameters

Param NameDescriptionData TypeAdditional InformationIs Mandatory
apiKeyAPI Key to access your OpManager server.Yes
deviceNameName of the deviceString-Yes
entityTypeName of the selected entity type like Nutanix-Cluster|Nutanix-Host|Nutanix-VMStringAllowed Values: The input must be exactly one of the following — Nutanix-Cluster,Nutanix-Host,Nutanix-VM.Yes

Sample Response

HTTP Code: 200

{ "DISPLAYNAME": "NutanixVM2", "clusterMoName": "Nutanix-Cluster-1", "hostName": "Nutanix-Host-1", "VCPUCOUNT": 2, "VM_ID": 21, "statusStr": "Clear", "TOOLSMOUNTED": false, "TOOLSVERSION": "1.2.0.3", "VM_POWERSTATE": "Powered On", "DISKCAPACITY": "150", "IPADDRESS": "172.24.151.114", "uuid": "3af940cd-b453-485d-89ab-2cab95aba188", "deviceName": "Nutanix-VM-1", "MEMORYCAPACITY": "6", "statusNum": 5, "ISCONTROLLERVM": "False", "STATUS": "\u00a0Clear", "NOOFNETWORKADAPTERS": 1, "clusterName": "Nutanix-Cluster-1", "hostMoName": "Nutanix-Host-1", "MOID": 307, "MEMRESERVEDCAPACITY": "6", "ENTITYNAME": "Nutanix-VM-2"}
Rate limit: 500 requests per minute. Exceeding this limit will block requests for 1 minute

addVxRailTovCenter

Add the VxRail to the vCenter

HTTP Method

POST

API URL

https://localhost:8060/api/json/device/addVxRailTovCenter?apiKey=***************&deviceName=xxx.xxx.xx.x

Parameters

Param NameDescriptionData TypeAdditional InformationIs Mandatory
apiKeyAPI Key to access your OpManager server.Yes
deviceNamevCenter NameStringAllowed characters: one or more of Unicode letters (any language), Unicode numbers, hyphen (-), period (.), underscore (_), plus sign (+), at sign (@), dollar sign ($), and whitespace charactersYes
vxrailDeviceNameVX Rail device NameString-Yes
vxrailCredentialNameCredential of the vx RailString-Yes

Sample Response

HTTP Code: 200

{ "result":{ "message": "VxRail inventory discovery in progress."}}
Rate limit: 500 requests per minute. Exceeding this limit will block requests for 1 minute

EditPerformanceMonitor

Updating the Performance monitor

HTTP Method

POST

API URL

https://localhost:8060/api/json/device/EditPerformanceMonitor?apiKey=***************&name=123&policyName=WMIAvgDiskLatency&pollId=28655&displayName=Average+Disk+Latency&thresholdName=&type=node&timeAvg=&vendor=&sendClear=true&oid=WMI+Average+Disk+Latency&interval=15&yaxisText=MilliSeconds&checkNumeric=true

Parameters

Param NameDescriptionData TypeAdditional InformationIs Mandatory
apiKeyAPI Key to access your OpManager server.Yes
nameName of the deviceString-Yes
policyNamePolicy name of the performance monitorStringGraphAndPolicyName:: value="^([^\*\^<>+,{}])+$"Yes
graphNameGraph name of the performance monitor.StringGraphAndPolicyName:: value="^([^\*\^<>+,{}])+$"Yes
pollIdPollid of the performance monitor.long-No
displayNameDisplayName of the performance monitor.String-No
thresholdNameThreadName of the performance monitor.StringAccepts any character except asterisk (*), caret (^), less-than (<), greater-than (>), plus (+), comma (,), curly braces ({}), with at least one character required.No
typetype of the monitor.String(interface|multiple|multiplenode|node)Allowed Values: Any one of the following - interface, multiple,multiplenode,nodeNo
timeAvgtimeAvg of the monitor.String(true|false)Allowed Values: The input must exactly match either true or false.No
vendorvendor of the monitor.StringAllowed Characters: Unicode letters, numbers, hyphen (-), parentheses (()), dot (.), comma (,), underscore (_), forward slash (/), and whitespace characters.No
sendClearSendClear of the monitor.BooleanAllowed Values: The input must exactly match either true or falseNo
oidoid of the monitor.String-No
intervalinterval of the monitor.intrange 1-1440No
yaxisTextyaxisText of the monitor.StringAllowed Characters: Any characters except less than (<) and greater than (>) symbols.No
failureThresholdConsecutive time of the monitor.int=0No
oidTypeoid type of the monitor.String-No
firstTimeFor Update monitor, it should be falseBooleanfalseNo
thresholdEnabledThreshold should be Enabled or not.BooleanAllowed Values: The input must exactly match either true or falseNo
perfDataStoreTypeData should be stored or notint-No
instanceNameInstance Name of the monitor.String-No
isGraphNeededBooleanAllowed Values: The input must exactly match either true or falseNo
warningThresholdTypeThreshold type of the warning severity of the Integer monitorStringAllowed Values: Any one of - min,max,equal,notEqualNo
warningThresholdTextualTypeThreshold type of the warning severity of the String monitorStringAllowed Values: Any one of - Contains,Equals,Not Contains,Not Equals,RegexNo
warningThresholdTextValueThreshold Value of the warning severity of the String monitorString-No
warningMessageThreshold Value of the warning severity of the int monitorString-No
troubleThresholdTypeThreshold Value of the warning severity of the integer monitorStringAllowed Values: Any one of - min, max, equal,notEqualNo
troubleThresholdTextualTypeThreshold Type of the warning severity of the String monitorStringAllowed Values: Any one of - Contains,Equals,Not Contains,Not Equals,RegexNo
troubleThresholdTextValueThreshold Type of the trouble severity of the String monitorStringAllowed Values: Any one of - Contains,Equals,Not Contains,Not Equals,RegexNo
troubleMessageThreshold Message of the trouble severity of the int monitorString-No
criticalThresholdTypeThreshold Value of the critical severity of the integer monitorStringAllowed Values: Any one of - min, max, equal,notEqualNo
criticalThresholdTextualTypeThreshold condition of the critical severity of the String monitorStringAllowed Values: Any one of - Contains,Equals,Not Contains,Not Equals,RegexNo
criticalThresholdTextValueThreshold Value of the critical severity of the String monitorString-No
criticalMessageThreshold Message of the Critical severity of the int monitorString-No
upperlimitThresholdTypeThreshold Type of the Upper limit of the Adaptive threshold StringAllowed Values: max or minNo
upperlimitThresholdTextualTypeThreshold Type of the Upper limit of the Adaptive thresholdStringAllowed Values: Any one of the following - max,equal,min,notEqual,Contains,Equals,Not Contains,Not Equals,RegexNo
upperlimitThresholdTextValueThreshold Value of the Upper limit of the Adaptive thresholddoubleAllowed Values: Any one of the following - max,equal,min,notEqual,Contains,Equals,Not Contains,Not Equals,RegexNo
upperlimitMessageThreshold Message of the Upper limit of the Adaptive thresholdStringAllowed Characters: Unicode letters, numbers, characters outside the Basic Latin range (supports two-byte characters like Chinese, Japanese, etc.), parentheses (()), hyphen (-), underscore (_), dot (.), exclamation (!), percent (%), colon (:), at (@), dollar ($), and whitespace characters.No
upperlimitSeverityThreshold Severity of the Upper limit of the Adaptive thresholdintrange="1-7"No
lowerlimitThresholdTypeThreshold Type of the lower limit of the Adaptive threshold StringAllowed Values: max or minNo
lowerlimitThresholdTextualTypeThreshold Type of the lower limit of the Adaptive thresholdStringAllowed Values: Any one of the following - max,equal,min,notEqual,Contains,Equals,Not Contains,Not Equals,RegexNo
lowerlimitThresholdTextValueThreshold Value of the lower limit of the Adaptive thresholddoubleAllowed Values: Any one of the following - max,equal,min,notEqual,Contains,Equals,Not Contains,Not Equals,RegexNo
clearThresholdTypeTo clear alert the Threshold TypeStringAllowed Values: Any one of - min, max, equal,notEqualNo
rearmTextualTypeTo clear alert the Threshold Type of StringStringAllowed Values: Any one of - Contains,Equals,Not Contains,Not Equals,RegexNo
rearmTextValueRearm text valueString-No
clrMessageclear message of the monitorString-No
adStoreFilePathad Store file pathStringDoes not allow sequences like ../, ..\, \\, //, <, >, or any value ending with ..No
xchgStoreLocationXchng Store LocationStringAccepts filenames ending with .edb or .stm that do not contain sequences like ../, ..\, \\, //, <, >, and do not end with ..No
minIntervalMin intervalint=0No
isMultipleThresholdis multiple thresholdBoolean/Allowed Values: The input must exactly match either true or falseNo
downSeverityDown Severityint/^(1|2|3|4|6)No
downConsecutiveTimeConsecutive time of the service monitorint/^(1|2|3|4|6)No
warningThresholdValueThreshold value of the warning severity of the monitordouble/-No
troubleThresholdValueThreshold value of the trouble severity of the monitordouble/-No
criticalThresholdValueThreshold value of the critical severity of the monitordouble/-No
lowerlimitThresholdValuelower limit of the Threshold value of the adapative thresholddouble/-No
upperlimitThresholdValueupper limit of the Threshold value of the adapative thresholddouble/-No
rearmValuerearm of the Threshold value of the monitordouble/-No
isAdaptiveThresholdsEnabledadative threshold is enableBoolean/Allowed Values: The input must exactly match either true or falseNo
deviationTypeadaptive threshold is deviation typeint/Allowed Values: The input must be exactly either 1 or 2No

Sample Response

HTTP Code: 200

{"result":{"message":"Successfully modified the graph"}}
Rate limit: 500 requests per minute. Exceeding this limit will block requests for 1 minute

fetchMonitorsList

For getting the monitors of a devices

HTTP Method

POST

API URL

https://localhost:8060/api/json/device/fetchMonitorsList?apiKey=***************&deviceList=xyz,21.21.21.21,yyy

Parameters

Param NameDescriptionData TypeAdditional InformationIs Mandatory
apiKeyAPI Key to access your OpManager server.Yes
deviceListDevice List with comma separatedString- No
groupMOIDVirtual TypelongGroupID for getting the monitors of a groupNo
isAvailabilityViewIf require only Availability, Response Time etc monitorsBooleanAllowed Values: The input must exactly match either true or falseNo

Sample Response

HTTP Code: 200

[ { "policyName": "DevicesAvailability", "monitorName": "Devices Availability"}, { "policyName": "Packet_Loss", "monitorName": "Packet Loss"}, { "policyName": "ResponseTime", "monitorName": "Response Time"}
]
Rate limit: 100 requests per minute. Exceeding this limit will block requests for 1 minute

getAssociatedMonitors

Get the Associated Monitors of the device

HTTP Method

GET

API URL

https://localhost:8060/api/json/device/getAssociatedMonitors?apiKey=***************&name=***

Parameters

Param NameDescriptionData TypeAdditional InformationIs Mandatory
apiKeyAPI Key to access your OpManager server.Yes
nameDevice NameString- Yes
isSiteViewIf it is siteviewBooleanNo

Sample Response

HTTP Code: 200

{ "performanceMonitors":{ "total": 9, "down": 1, "monitors": [ { "DISPLAYNAME": "CPU Utilization", "checkNumeric": "true", "graphType": "multiple", "Instance": "", "policyName": "WMI-CPUUtilization", "THRESHOLDENABLED": "true", "GRAPHID": "203", "active": "false", "thresholdStatus": "Violated", "isMultiple": "true", "type": "multiple", "thresholdImg": "images/thresholdConTrouble.gif", "groupName": "WMI", "DisplayColumn": "", "name": "WMI-CPUUtilization", "interval": "8", "numericType": "1", "id": "22905", "Id": "22905", "Protocol": "WMI"}, { "DISPLAYNAME": "Used Disk Space in GB-C:", "checkNumeric": "true", "graphType": "multiplenode", "Instance": "", "policyName": "WMI-UsedDiskSpaceInGB", "THRESHOLDENABLED": "false", "GRAPHID": "303", "active": "false", "thresholdStatus": "Not Enabled", "isMultiple": "false", "type": "node", "thresholdImg": "images/thresholdNonConfigured.gif", "groupName": "WMI", "DisplayColumn": "", "name": "C:", "interval": "15", "numericType": "1", "id": "22900", "Id": "22900", "Protocol": "WMI"}, { "DISPLAYNAME": "Memory Utilization", "checkNumeric": "true", "graphType": "multiple", "Instance": "", "policyName": "WMI-MemoryUtilization", "THRESHOLDENABLED": "true", "GRAPHID": "204", "active": "false", "thresholdStatus": "Normal", "isMultiple": "true", "type": "multiple", "thresholdImg": "images/thresholdConOK.gif", "groupName": "WMI", "DisplayColumn": "", "name": "WMI-MemoryUtilization", "interval": "15", "numericType": "1", "id": "22906", "Id": "22906", "Protocol": "WMI"}, { "DISPLAYNAME": "Free Disk Space in GB-C:", "checkNumeric": "true", "graphType": "multiplenode", "Instance": "", "policyName": "WMI-FreeDiskSpaceInGB", "THRESHOLDENABLED": "false", "GRAPHID": "301", "active": "false", "thresholdStatus": "Not Enabled", "isMultiple": "false", "type": "node", "thresholdImg": "images/thresholdNonConfigured.gif", "groupName": "WMI", "DisplayColumn": "", "name": "C:", "interval": "15", "numericType": "1", "id": "22899", "Id": "22899", "Protocol": "WMI"}, { "DISPLAYNAME": "System UpTime in minutes", "checkNumeric": "true", "graphType": "node", "Instance": "", "policyName": "WMISystemUpTime", "THRESHOLDENABLED": "false", "GRAPHID": "3654", "active": "false", "thresholdStatus": "Not Enabled", "isMultiple": "false", "type": "node", "thresholdImg": "images/thresholdNonConfigured.gif", "groupName": "WMI", "DisplayColumn": "", "name": "WMISystemUpTime", "interval": "15", "numericType": "1", "id": "22908", "Id": "22908", "Protocol": "WMI"}, { "DISPLAYNAME": "Partition Details of the Device(%)-C:", "checkNumeric": "true", "graphType": "multiplenode", "Instance": "", "policyName": "WMI-PartitionDetails", "THRESHOLDENABLED": "false", "GRAPHID": "304", "active": "false", "thresholdStatus": "Not Enabled", "isMultiple": "false", "type": "node", "thresholdImg": "images/thresholdNonConfigured.gif", "groupName": "WMI", "DisplayColumn": "", "name": "C:", "interval": "15", "numericType": "1", "id": "22904", "Id": "22904", "Protocol": "WMI"}, { "DISPLAYNAME": "Free Megabytes.C:", "checkNumeric": "true", "graphType": "node", "Instance": "", "policyName": "LogicalDisk.FreeMegabytes.C_", "THRESHOLDENABLED": "false", "GRAPHID": "5676", "active": "false", "thresholdStatus": "Not Enabled", "isMultiple": "false", "type": "node", "thresholdImg": "images/thresholdNonConfigured.gif", "groupName": "WMI", "DisplayColumn": "", "name": "LogicalDisk.FreeMegabytes.C_", "interval": "3", "numericType": "1", "id": "22902", "Id": "22902", "Protocol": "WMI"}, { "DISPLAYNAME": "Processes.", "checkNumeric": "true", "graphType": "node", "Instance": "", "policyName": "System.Processes.", "THRESHOLDENABLED": "false", "GRAPHID": "7599", "active": "false", "thresholdStatus": "Not Enabled", "isMultiple": "false", "type": "node", "thresholdImg": "images/thresholdNonConfigured.gif", "groupName": "WMI", "DisplayColumn": "", "name": "System.Processes.", "interval": "2", "numericType": "1", "id": "24341", "Id": "24341", "Protocol": "WMI"}, { "DISPLAYNAME": "IO Read and Write Rate", "checkNumeric": "true", "graphType": "node", "Instance": "", "policyName": "WMIIOReadandWriteRate", "THRESHOLDENABLED": "false", "GRAPHID": "3642", "active": "false", "thresholdStatus": "Not Enabled", "isMultiple": "false", "type": "node", "thresholdImg": "images/thresholdNonConfigured.gif", "groupName": "WMI", "DisplayColumn": "", "name": "WMIIOReadandWriteRate", "interval": "15", "numericType": "1", "id": "22907", "Id": "22907", "Protocol": "WMI"} ]}, "serverMonitors":{ "total": 5, "down": 5, "monitors": [ { "portNo": "25", "failureThreshold": 1, "statusText": "webclient.devices.intftypes.down", "name": "SMTP", "status": "images/servicestatus7.gif"}, { "portNo": "343", "failureThreshold": 1, "statusText": "webclient.devices.intftypes.down", "name": "TestMo", "status": "images/servicestatus7.gif"}, { "portNo": "80", "failureThreshold": 1, "statusText": "webclient.devices.intftypes.down", "name": "Web", "status": "images/servicestatus7.gif"}, { "portNo": "135", "failureThreshold": 1, "statusText": "webclient.devices.intftypes.down", "name": "135", "status": "images/servicestatus7.gif"}, { "portNo": "53", "failureThreshold": 3, "statusText": "webclient.devices.intftypes.down", "name": "DNS", "status": "images/servicestatus7.gif"} ]}, "ntServiceMonitors":{ "total": 4, "down": 4, "monitors": [ { "name": "Device Association Service", "serviceName": "DeviceAssociationService", "moid": "81369", "status": "/images/devices/status7.gif"}, { "name": "ManageEngine OpManager Agent", "serviceName": "ManageEngine OpManager Agent", "moid": "103553", "status": "/images/devices/status7.gif"}, { "name": "Print Spooler", "serviceName": "Spooler", "moid": "89263", "status": "/images/devices/status7.gif"}, { "name": "RPC", "serviceName": "RpcSs", "moid": "81368", "status": "/images/devices/status7.gif"} ]}, "urlMonitors":{ "total": 0, "down": 0, "monitors": [ ]}, "processMonitors":{ "total": 5, "down": 5, "monitors": [ { "isSuppressed": "false", "statusStr": "Unknown", "statusIcon": "/webclient/devices/images/servicestatus7.gif", "trimName": "csrss.exe", "statusNum": "7", "path": "-", "suppressedMessage": "", "cmdLineArgs": "", "name": "csrss.exe", "id": "81371", "proName": "csrss.exe", "state": "7", "status": "7"}, { "isSuppressed": "false", "statusStr": "Unknown", "statusIcon": "/webclient/devices/images/servicestatus7.gif", "trimName": "MonitoringAgent.e...", "statusNum": "7", "path": "C:\\Program Files (x86)\\ManageEngine\\OpManagerAgent\\monitoring\\bin\\", "suppressedMessage": "", "cmdLineArgs": "", "name": "MonitoringAgent.exe SNMP", "id": "103604", "proName": "MonitoringAgent.exe", "state": "7", "status": "7"}, { "isSuppressed": "false", "statusStr": "Unknown", "statusIcon": "/webclient/devices/images/servicestatus7.gif", "trimName": "MonitoringAgent.e...", "statusNum": "7", "path": "C:\\Program Files (x86)\\ManageEngine\\OpManagerAgent\\monitoring\\bin\\MonitoringAgent.exe", "suppressedMessage": "", "cmdLineArgs": "\"C:\\Program Files (x86)\\ManageEngine\\OpManagerAgent\\\\monitoring\\bin\\MonitoringAgent.exe\"", "name": "MonitoringAgent.exe WMI", "id": "103718", "proName": "MonitoringAgent.exe", "state": "7", "status": "7"}, { "isSuppressed": "false", "statusStr": "Unknown", "statusIcon": "/webclient/devices/images/servicestatus7.gif", "trimName": "MSSQL", "statusNum": "7", "path": "C:\\Program Files\\Microsoft SQL Server\\MSSQL\\Binn\\sqlservr.exe", "suppressedMessage": "", "cmdLineArgs": "", "name": "MSSQL", "id": "81370", "proName": "sqlservr.exe", "state": "7", "status": "7"} ]}, "fileMonitors":{ "total": 2, "down": 0, "monitors": [ { "suppressedMessage": "", "filemonitorid": "23069", "monitorname": "sdfghjk", "filepath": "c:/t.txt", "isSuppressed": "false", "statusStr": "Clear", "statusIcon": "/webclient/devices/images/servicestatus5.gif", "state": "4", "status": "5", "statusNum": 5}, { "suppressedMessage": "", "filemonitorid": "23070", "monitorname": "TestFileeTemp", "filepath": "C:\\Test.txt", "isSuppressed": "false", "statusStr": "Clear", "statusIcon": "/webclient/devices/images/servicestatus5.gif", "state": "4", "status": "5", "statusNum": 5} ]}, "eventlogMonitors":{ "period": "300", "total": 3, "isActive": "true", "down": 0, "monitors": [ { "ruleName": "Any windows powershell failure", "id": "58"}, { "ruleName": "Eventlog Service stopped", "id": "29"}, { "ruleName": "DCOM10036", "id": "70"} ]}, "folderMonitors":{ "total": 0, "down": 0, "monitors": [ ]}, "scriptMonitors":{ "total": 1, "down": 1, "monitors": [ { "displayName": "Certificate Expiry Monitor", "pollid": "24728", "thresholdSeverity": "Violated", "statusIcon": "images/servicestatus5.gif", "interval": "15", "thresholdSevFont": "#ff6600", "OID": "33611"} ]}}
,
Rate limit: 500 requests per minute. Exceeding this limit will block requests for 1 minute

getDeviceAssociatedProcessMonitors

Lists the associated Process Monitors for a device

HTTP Method

GET

API URL

https://localhost:8060/api/json/device/getDeviceAssociatedProcessMonitors?apiKey=***************&name=devicename

Parameters

Param NameDescriptionData TypeAdditional InformationIs Mandatory
apiKeyAPI Key to access your OpManager server.String-Yes
nameName of the deviceString-Yes

Sample Response

HTTP Code: 200

[ { "path": "-", "processName": "csrss.exe", "processId": "408", "status": "Running", "cpuUsage": "0.5%", "memoryUsage": "12.3MB"}
]
Rate limit: 500 requests per minute. Exceeding this limit will block requests for 1 minute

getDeviceAssociatedServiceMonitors

Lists the associated Service Monitors for a device

HTTP Method

GET

API URL

https://localhost:8060/api/json/device/getDeviceAssociatedServiceMonitors?apiKey=***************&name=devicename

Parameters

Param NameDescriptionData TypeAdditional InformationIs Mandatory
apiKeyAPI Key to access your OpManager server.String-Yes
nameName of the deviceString-Yes

Sample Response

HTTP Code: 200

[ { "name": "DNS", "portNo": "80", "status": "Clear",}
]
Rate limit: 500 requests per minute. Exceeding this limit will block requests for 1 minute

getGraphData

Retrieves graph data for device performance metrics

HTTP Method

GET

API URL

https://localhost:8060/api/json/device/getGraphData?apiKey=***************&deviceName=devicename&graphName=cpu

Parameters

Param NameDescriptionData TypeAdditional InformationIs Mandatory
apiKeyAPI Key to access your OpManager server.Yes
nameDevice Name/Any other type of the graphString-Yes
parentObjParentObj for the few categoryString-No
policyNamepolicyName of the MonitorString-No
indexindex of the MonitorString-No
periodPeriod to select for the graph StringAllowed Values: Any one of the following - custom,Today,onehour,twohours,fourhours,sixhours,eighthours,twelvehours,twfourhours,before_12_hours,before_24_hours,before_48_hours,Last_7_Days,WEEK,Last_30_Days,MONTH,Last_60_Days,Last_90_Days,Yesterday,thisweek,lastweek,thismonth,Last_Month,Last 12 hours,Last 24 hours,Last 7 days,This week,Last week,This month,Last month,Last 30 days,last_7_days,last_30_days,last_90_days,Last_12_hours,Last_24_hours,This_Week,This_Month,Last_Week,Next_7_days,Next_14_days,Next_30_days,Next_60_days,Next_90_days,Next_12_hours,Next_24_hours,This_Week,This_Quarter,Last_Quarter,Last_3_Months,Last_6_MonthsNo
instanceinstance of the monitorString-No
isHardwareGraphFor Hardware GraphBooleanAllowed Values: The input must exactly match either true or falseNo
parameterNameType of the parameter for HardwareString-No
withMMAIf require the Min, Max,Avg & 95th percentile value in consolidated valuesBooleanAllowed Values: The input must exactly match either true or falseNo
startDateStart Date for the graphStringEx:- 08/10/2025 00:00 Regex dateFormat:: ^([0][1-9]|[1|2]\d|[3][0|1])\/([0][1-9]|[1][0-2])\/\d{4}\s([0-1]\d|[2][0-3])\:[0-5]\d$No
endDateEnd Date for the graphStringEx:- 14/10/2025 19:24 Regex dateFormat:: ^([0][1-9]|[1|2]\d|[3][0|1])\/([0][1-9]|[1][0-2])\/\d{4}\s([0-1]\d|[2][0-3])\:[0-5]\d$No
instanceNameInstance NameString-No
graphFilterTypeType of the data(For Archive Data) for plotting the graphStringAllowed Values: The input must be exactly one of the following — min, max, or avgNo

Sample Response

HTTP Code: 200

{ "graphData":{ "timestamps": ["2025-01-15 10:00", "2025-01-15 11:00"], "values": [45.2, 52.8], "unit": "%", "graphName": "CPU Utilization"}}
Rate limit: 50 requests per minute. Exceeding this limit will block requests for 1 minute

getGraphNames

Lists all available graph names for a device

HTTP Method

GET

API URL

https://localhost:8060/api/json/device/getGraphNames?apiKey=***************&deviceName=devicename

Parameters

Param NameDescriptionData TypeAdditional InformationIs Mandatory
apiKeyAPI Key to access your OpManager server.String-Yes
deviceNameName of the deviceString-Yes

Sample Response

HTTP Code: 200

[ { "protocol": "WMI", "graphType": "multiple", "policyName": "WMI-MemoryUtilization", "displayName": "Memory Utilization", "pollId": "28650", "name": "WMI-MemoryUtilization", "oid": "Memory Utilization"}, { "protocol": "WMI", "graphType": "node", "policyName": "WMIIOReadandWriteRate", "displayName": "IO Read and Write Rate", "pollId": "28654", "name": "WMIIOReadandWriteRate", "oid": "WMI IO Read and Write Rate"}, { "protocol": "WMI", "graphType": "node", "policyName": "WMISystemUpTime", "displayName": "System UpTime in minutes", "pollId": "28656", "name": "WMISystemUpTime", "oid": "WMI System UpTime"}, { "protocol": "WMI", "graphType": "node", "policyName": "WMIAvgDiskLatency", "displayName": "Average Disk Latency", "pollId": "28655", "name": "WMIAvgDiskLatency", "oid": "WMI Average Disk Latency"}, { "protocol": "WMI", "graphType": "multiplenode", "policyName": "WMI-PartitionDetails", "displayName": "Partition Details of the Device(%)-C:", "pollId": "28653", "name": "C:", "oid": "Partition Details of the Device"}, { "protocol": "WMI", "graphType": "multiple", "policyName": "WMI-DiskUtilization", "displayName": "Disk Utilization", "pollId": "28651", "name": "WMI-DiskUtilization", "oid": "Disk Utilization"}, { "protocol": "WMI", "graphType": "multiple", "policyName": "WMI-CPUUtilization", "displayName": "CPU Utilization", "pollId": "28649", "name": "WMI-CPUUtilization", "oid": "CPU Utilization ProcessorInformation"}
]
Rate limit: 500 requests per minute. Exceeding this limit will block requests for 1 minute

Get Nutanix Disks

Retrieves information about disks in the Nutanix cluster

HTTP Method

GET

API URL

https://localhost:8060/api/json/device/getNutanixDisks?apiKey=***************&deviceName=nutanix-cluster

Parameters

Param NameDescriptionData TypeAdditional InformationIs Mandatory
apiKeyAPI Key to access your OpManager server.Yes
nameName of the deviceString-Yes
typeEntity Type like Nutanix-Cluster|Nutanix-HostStringAllowed Values: The input must be exactly one of the following — Nutanix-Cluster, Nutanix-Host",Yes

Sample Response

HTTP Code: 200

[ { "CAPACITY": "3330.52", "STATUS": "NORMAL", "DISK_ID": 36, "SERIALNUMBER": "local123", "USAGE": "741.21", "TIER": "SSD", "MOUNTPATH": "/home/nutanix/data/stargate-storage/disks/local123"}, { "CAPACITY": "3119.15", "STATUS": "NORMAL", "DISK_ID": 37, "SERIALNUMBER": "local124", "USAGE": "721.32", "TIER": "SSD", "MOUNTPATH": "/home/nutanix/data/stargate-storage/disks/local124"}, { "CAPACITY": "3330.52", "STATUS": "NORMAL", "DISK_ID": 38, "SERIALNUMBER": "local125", "USAGE": "743.49", "TIER": "SSD", "MOUNTPATH": "/home/nutanix/data/stargate-storage/disks/local125"}, { "CAPACITY": "3330.52", "STATUS": "NORMAL", "DISK_ID": 39, "SERIALNUMBER": "local126", "USAGE": "741.62", "TIER": "SSD", "MOUNTPATH": "/home/nutanix/data/stargate-storage/disks/local126"}, { "CAPACITY": "3119.15", "STATUS": "NORMAL", "DISK_ID": 40, "SERIALNUMBER": "local126", "USAGE": "721.46", "TIER": "SSD", "BOOTDISK": true, "MOUNTED": true, "VENDOR": "Not Available", "MODEL": "SAMSUNG -00005", "MOUNTPATH": "/home/nutanix/data/stargate-storage/disks/local126"}, { "CAPACITY": "3330.52", "STATUS": "NORMAL", "DISK_ID": 35, "SERIALNUMBER": "local127", "USAGE": "743", "TIER": "SSD", "BOOTDISK": false, "MOUNTED": true, "VENDOR": "Not Available", "MODEL": "SAMSUNG -00005", "MOUNTPATH": "/home/nutanix/data/stargate-storage/disks/local127"}
]
Rate limit: 500 requests per minute. Exceeding this limit will block requests for 1 minute

Get Nutanix Hosts

Retrieves information about hosts in the Nutanix cluster

HTTP Method

GET

API URL

https://localhost:8060/api/json/device/getNutanixHosts?apiKey=***************&deviceName=nutanix-cluster

Parameters

Param NameDescriptionData TypeAdditional InformationIs Mandatory
apiKeyAPI Key to access your OpManager server.String-Yes
deviceNameName of the Nutanix deviceString-Yes

Sample Response

HTTP Code: 200

[ { "DISPLAYNAME": "opm-NutanixHost1", "statusStr": "Critical", "DISKCAPACITY": "19560.36", "IPADDRESS": "172.172.172.172", "HYPERVISORDETAIL": "Nutanix 20170830.265", "CPUMODEL": "Intel(R) Xeon(R) Gold 6138 CPU @ 2.00GHz", "MEMORYCAPACITY": "503.49", "statusNum": 1, "NAME": "opm-dev2.csez.zohocorpin.com", "BOOTTIME": "2019-05-27 20:48:24.153", "SELECTIONSTATE": 1, "NUMCPUCORES": 40, "HOST_ID": 21, "TYPE": "kKvm"}
]
Rate limit: 500 requests per minute. Exceeding this limit will block requests for 1 minute

getNutanixOrphanedVMs

Retrieves information about orphaned virtual machines in the Nutanix cluster

HTTP Method

GET

API URL

https://localhost:8060/api/json/device/getNutanixOrphanedVMs?apiKey=***************&deviceName=nutanix-cluster

Parameters

Param NameDescriptionData TypeAdditional InformationIs Mandatory
apiKeyAPI Key to access your OpManager server.Yes
nameName of the deviceString-Yes
typeEntity Type like Nutanix-Cluster|Nutanix-HostStringAllowed Values: The input must be exactly one of the following — Nutanix-Cluster, Nutanix-Host",Yes

Sample Response

HTTP Code: 200

[ { "NUMNETWORKADAPTERS": 1, "DISPLAYNAME": "opm-Nutanix44VM233", "VCPUCOUNT": 2, "VM_ID": 22, "statusStr": "Critical", "OS": "Windows 2012 R2", "DISKCAPACITY": "150", "IPADDRESS": "99.99.99.99", "MEMORYCAPACITY": "6", "statusNum": 1, "NAME": "99.99.99.99", "ISCONTROLLERVM": false, "SELECTIONSTATE": -5}
] 
Rate limit: 500 requests per minute. Exceeding this limit will block requests for 1 minute

getNutanixStorageContainers

Retrieves information about storage containers in the Nutanix cluster

HTTP Method

GET

API URL

https://localhost:8060/api/json/device/getNutanixStorageContainers?apiKey=***************&deviceName=nutanix-cluster

Parameters

Param NameDescriptionData TypeAdditional InformationIs Mandatory
apiKeyAPI Key to access your OpManager server.String-Yes
deviceNameName of the Nutanix deviceString-Yes

Sample Response

HTTP Code: 200

{ "storageContainers": [ { "containerId": "container001", "containerName": "default-container", "totalCapacity": "10TB", "usedCapacity": "7TB", "status": "Online"} ]}
Rate limit: 500 requests per minute. Exceeding this limit will block requests for 1 minute

getNutanixStoragePools

Retrieves information about storage pools in the Nutanix cluster

HTTP Method

GET

API URL

https://localhost:8060/api/json/device/getNutanixStoragePools?apiKey=***************&deviceName=nutanix-cluster

Parameters

Param NameDescriptionData TypeAdditional InformationIs Mandatory
apiKeyAPI Key to access your OpManager server.String-Yes
deviceNameName of the Nutanix deviceString-Yes

Sample Response

HTTP Code: 200

{ "storagePools": [ { "poolId": "pool001", "poolName": "SP1", "totalCapacity": "25TB", "usedCapacity": "18TB", "diskCount": 12} ]}
Rate limit: 500 requests per minute. Exceeding this limit will block requests for 1 minute

getNutanixVGroups

Retrieves information about volume groups in the Nutanix cluster

HTTP Method

GET

API URL

https://localhost:8060/api/json/device/getNutanixVGroups?apiKey=***************&deviceName=nutanix-cluster

Parameters

Param NameDescriptionData TypeAdditional InformationIs Mandatory
apiKeyAPI Key to access your OpManager server.String-Yes
deviceNameName of the Nutanix deviceString-Yes

Sample Response

HTTP Code: 200

{ "volumeGroups": [ { "vGroupId": "vg001", "vGroupName": "production-vg", "diskCount": 5, "totalSize": "500GB", "usedSize": "350GB"} ]}
Rate limit: 500 requests per minute. Exceeding this limit will block requests for 1 minute

getNutanixVMs

Retrieves information about virtual machines in the Nutanix cluster

HTTP Method

GET

API URL

https://localhost:8060/api/json/device/getNutanixVMs?apiKey=***************&deviceName=nutanix-cluster

Parameters

Param NameDescriptionData TypeAdditional InformationIs Mandatory
apiKeyAPI Key to access your OpManager server.Yes
nameName of the deviceString-Yes
typeEntity Type like Nutanix-Cluster|Nutanix-HostStringAllowed Values: The input must be exactly one of the following — Nutanix-Cluster, Nutanix-Host",Yes

Sample Response

HTTP Code: 200

[ { "NUMNETWORKADAPTERS": 1, "DISPLAYNAME": "opm-Nutanix44VM233", "VCPUCOUNT": 2, "VM_ID": 22, "statusStr": "Critical", "OS": "Windows 2012 R2", "DISKCAPACITY": "150", "IPADDRESS": "99.99.99.99", "MEMORYCAPACITY": "6", "statusNum": 1, "NAME": "99.99.99.99", "ISCONTROLLERVM": false, "SELECTIONSTATE": -5}
] 
Rate limit: 500 requests per minute. Exceeding this limit will block requests for 1 minute

Get URL Summary

Retrieves summary information about URL monitors for a device

HTTP Method

GET

API URL

https://localhost:8060/api/json/device/getURLSummary?apiKey=***************&deviceName=devicename

Parameters

Param NameDescriptionData TypeAdditional InformationIs Mandatory
apiKeyAPI Key to access your OpManager server.Yes
urlNameTo list the Custom monitor, we have to use this parameterStringAllowed Characters: Unicode letters, non-Basic Latin characters (supports international or multi-byte characters), digits, underscore (_), dot (.), hyphen (-), space, and colon (:) Yes
snapTypeMandatory to fill this snapType as MonitoringURLString(MonitoringURL)Allowed Values: MonitoringURLYes

Sample Response

HTTP Code: 200

{ "viewData": "NODATA", "snapDetails":{ "snapList": [ { "indexCount": 0, "ondemandWidget": false, "refresh": false, "type": "URLSummary", "sizex": 10, "expand": false, "apiurl": "/client/api/json/admin/getURLSummary", "rowNum": 1, "parameter": "urlName", "isEnabled": true, "colNum": 1, "name": "opm.url.summary", "header": false, "id": 235, "snapid": 235, "expandtime": false, "parameters": [], "sizey": 12, "timeSelection": false, "desc": "dashboard.name.nwconfig"}, { "indexCount": 1, "ondemandWidget": false, "refresh": false, "type": "Grid", "sizex": 10, "expand": false, "apiurl": "/client/api/json/alarm/listAlarms", "rowNum": 8, "parameter": "urlName", "isEnabled": true, "colNum": 1, "name": "opm.url.alarms", "header": true, "id": 236, "snapid": 236, "snapshotData":{ "sortCol": "modTime", "sortOrder": "desc", "colModelList": [ { "classes": "cursorPointer", "name": "message", "index": "message"}, { "classes": "cursorPointer", "name": "who", "index": "who"}, { "formatter": "severityColorIcon", "classes": "cursorPointer", "name": "statusStr", "index": "statusStr"}, { "sorttype": "convertTimeToLongFormatter", "classes": "cursorPointer", "name": "modTime", "index": "modTime"}, { "hidden": true, "name": "statusNum", "index": "statusNum"}, { "hidden": true, "name": "entity", "index": "entity"}, { "hidden": true, "name": "alarmId", "index": "alarmId"}, { "hidden": true, "name": "modTimeLong", "index": "modTimeLong"} ], "colNamesList": [ "webclient.fault.event.text", "webclient.fault.alarm.operator", "webclient.fault.details.properties.severity", "webclient.fault.details.properties.modttime", "", "webclient.api.ui.event.entity", "webclient.api.ui.event.alarmid", "" ], "onselectfunction": "url_alarmsList"}, "expandtime": false, "parameters": [], "sizey": 14, "timeSelection": false, "desc": "webclient.devices.details.alarm"}, { "indexCount": 2, "ondemandWidget": false, "refresh": false, "type": "Graph", "sizex": 10, "expand": false, "apiurl": "/client/api/json/device/getGraphData", "rowNum": 22, "parameter": "name", "isEnabled": true, "colNum": 1, "name": "opm.url.response", "header": true, "id": 237, "snapid": 237, "expandtime": false, "parameters": [ { "param": "index", "paramData": [], "value": "urlresponseTime"}, { "param": "instance", "paramData": [], "value": "urlresponseTime"}, { "paramType": "urlresponseTime", "param": "withMMA", "paramData": [], "value": "true"}, { "param": "policyName", "paramData": [], "value": "urlresponseTime"}, { "paramType": "opmtime", "param": "period", "paramData": [], "value": "Today"} ], "sizey": 14, "timeSelection": true, "desc": "webclient.home.server.responsetime.column.time"} ], "snapshotID": "18", "snapshotDesc": "snapshot.desc.url", "snapshotName": "OPMURL", "tabs":{ "tabs": [ { "tabid": 55, "name": "webclient.snapshot.testlinks.summary", "order": 1}, { "tabid": 56, "name": "webclient.devices.details.alarm", "order": 2}, { "tabid": 57, "name": "webclient.home.server.responsetime.column.time", "order": 3} ], "tabWidgets":{ "55": [ { "ROW": 1, "ASSOCIATIONID": 235} ], "56": [ { "ROW": 8, "ASSOCIATIONID": 236} ], "57": [ { "ROW": 22, "ASSOCIATIONID": 237} ]}}, "timeSelectionNeeded": true, "yScale": 25, "maxColumns": 10}, "details":{ "alreadyExist": "false", "urlName": "Gooogle", "displayName": "Gooogle", "matchContent": "", "probeID": "0", "tester": "usertest", "isContainer": "false", "type": "URL", "moID": "119432", "timeout": "25", "responseCode": "", "suppressedMessage": "", "failureThreshold": "2", "errorContent": "", "managed": "true", "smartUrl": "http://gooogle.com", "siteID": "0", "state": "1", "statusPollEnabled": "false", "groupMembers": "", "DISPLAYNAME": "-", "lastPolled": "Mon,Oct 13 16:55:13 IST 2025", "method": "G", "isSuppressed": false, "stringstatus": "Clear", "responseTime": "103", "profile": "", "statusChangeTime": "1760294951262", "profileIDs": "", "AvailabilityImagePath":{ "Down": 0.487, "Dependent Unavailable": 0, "Not Monitored": 0, "On Hold": 0, "Parent Down": 0, "On Maintenance": 0, "Up": 99.513}, "userAgent": "", "queryString": "", "userName": "", "acceptCookie": "1", "url": "http://gooogle.com", "groupNames": "", "pollInterval": "5", "childrenKeys": "", "parentKey": "NULL", "nextPoll": "Mon,Oct 13 17:00:13 IST 2025", "name": "Gooogle_URL", "isGroup": "false", "failureCount": "0", "statusUpdateTime": "1760294951262", "status": "5"}}
Rate limit: 500 requests per minute. Exceeding this limit will block requests for 1 minute

listApplicationServices

Lists all application services configured in the system

HTTP Method

GET

API URL

https://localhost:8060/api/json/device/listApplicationServices?apiKey=***************

Parameters

Param NameDescriptionData TypeAdditional InformationIs Mandatory
apiKeyAPI Key to access your OpManager server.Yes
appType of the Application ServicesString(Any value of AD or Exchange or MSSQL)Allowed Values: The input must be exactly one of the following — AD,Exchange,MSSQLYes
versionVersion of the Services StringAllowed Values: The input must be exactly one of the following years — 2003, 2007, 2010, 2013, 2016, or 2019No

Sample Response

HTTP Code: 200

[ { "serviceDesc": "The service synchronizes the time between domain controllers, which prevents time skews from occurring.", "serviceDisplayName": "Windows Time service", "autoAdd": true, "serviceid": 59, "serviceName": "W32Time"}, { "serviceDesc": "This service resolves and caches (Domain Name Server) DNS names.", "serviceDisplayName": "DNS Client Service", "autoAdd": true, "serviceid": 60, "serviceName": "Dnscache"}, { "serviceDesc": "This service maintains file synchronization of file directory contents among multiple servers.", "serviceDisplayName": "File Replication Service", "autoAdd": false, "serviceid": 61, "serviceName": "NtFrs"}, { "serviceDesc": "This service is used for mail-based replication between sites. Active Directory includes support for replication between sites by using SMTP over IP transport.", "serviceDisplayName": "Intersite Messaging Service", "autoAdd": true, "serviceid": 62, "serviceName": "IsmServ"}, { "serviceDesc": "This service enables users to log on to the network using the Kerberos version 5 authentication protocol.", "serviceDisplayName": "Kerberos Key Distribution Center Service", "autoAdd": true, "serviceid": 63, "serviceName": "kdc"}, { "serviceDesc": "This service signals other services that the Security Accounts Manager subsystem is ready to accept requests.", "serviceDisplayName": "Security Accounts Manager Service", "autoAdd": true, "serviceid": 64, "serviceName": "SamSs"}, { "serviceDesc": "This service enables the computer to connect to other computers on the network based on the SMB protocol.", "serviceDisplayName": "Server Service", "autoAdd": true, "serviceid": 65, "serviceName": "lanmanserver"}, { "serviceDesc": "This service provides network connections and communications.", "serviceDisplayName": "Workstation Service", "autoAdd": true, "serviceid": 66, "serviceName": "lanmanworkstation"}, { "serviceDesc": "This service provides the name services for RPC clients.", "serviceDisplayName": "Remote Procedure Call (RPC) Service", "autoAdd": true, "serviceid": 67, "serviceName": "RpcSs"}, { "serviceDesc": "This service supports pass-through authentication of account logon events for computers in a domain. ", "serviceDisplayName": "Net Logon Service", "autoAdd": true, "serviceid": 68, "serviceName": "Netlogon"}, { "serviceDesc": "This service enables synchronizing folders on multiple servers across local or WAN network", "serviceDisplayName": "DFS Replication", "autoAdd": true, "serviceid": 69, "serviceName": "DFSR"}
]
Rate limit: 20 requests per minute. Exceeding this limit will block requests for 1 minute

listPerformanceMonitors

Lists all performance monitors available for devices

HTTP Method

GET

API URL

https://localhost:8060/api/json/device/listPerformanceMonitors?apiKey=***************

Parameters

Param NameDescriptionData TypeAdditional InformationIs Mandatory
apiKeyAPI Key to access your OpManager server.Yes
isCustomMonitorTo list the Custom monitor, we have to use this parameterBooleanAllowed Values: The input must exactly match either true or falseNo
isCustFieldMonitorTo list the Custom field monitor, we have to use this parameterBooleanAllowed Values: The input must exactly match either true or falseNo

Sample Response

HTTP Code: 200

[ { "graphName": "CPUTemperature", "protocol": "SNMP", "custFieldGraph": "false", "Identifier": ".1.3.6.1.4.1.43.2.13.8.4.5.0", "customGraph": "false", "associatedDeviceCount": "2", "monitorName": "CPU Temperature", "displayName": "CPU Temperature", "vendor": "3Com", "description": "Monitors the CPU temperature", "graphId": "331"}, { "graphName": "CPUUtilization", "protocol": "SNMP", "custFieldGraph": "false", "Identifier": ".1.3.6.1.4.1.43.2.13.8.4.0", "customGraph": "false", "associatedDeviceCount": "2", "monitorName": "CPU Utilization", "displayName": "CPU Utilization", "vendor": "3Com", "description": "Monitors the CPU utilization", "graphId": "332"}, { "graphName": "hwCpuCostRatePer5Min", "protocol": "SNMP", "custFieldGraph": "false", "Identifier": ".1.3.6.1.4.1.43.45.1.6.1.1.1.4.65536", "customGraph": "false", "associatedDeviceCount": 0, "monitorName": "CPU Cost Rate (5 min)", "displayName": "CPU Cost Rate (5 min)", "vendor": "3Com", "description": "The overall CPU cost percentage in the last 5 minutes period.", "graphId": "3249"}, { "graphName": "hwMemFree", "protocol": "SNMP", "custFieldGraph": "false", "Identifier": ".1.3.6.1.4.1.43.45.1.6.1.2.1.1.3.65536", "customGraph": "false", "associatedDeviceCount": 0, "monitorName": "Free Memory", "displayName": "Free Memory", "vendor": "3Com", "description": "Indicates the free size of the memory", "graphId": "3250"}, { "graphName": "hwMemRawSliceUsed", "protocol": "SNMP", "custFieldGraph": "false", "Identifier": ".1.3.6.1.4.1.43.45.1.6.1.2.1.1.4.65536", "customGraph": "false", "associatedDeviceCount": 0, "monitorName": "Memory Raw slice used", "displayName": "Memory Raw slice used", "vendor": "3Com", "description": "Indicates the used size of the raw slice memory", "graphId": "3251"}, { "graphName": "hwBufCurrentUsed", "protocol": "SNMP", "custFieldGraph": "false", "Identifier": ".1.3.6.1.4.1.43.45.1.6.1.2.2.1.4.65536", "customGraph": "false", "associatedDeviceCount": 0, "monitorName": "Currently used buffer", "displayName": "Currently used buffer", "vendor": "3Com", "description": "The number of used buffer currently.", "graphId": "3252"}, { "graphName": "hwBufCurrentTotal", "protocol": "SNMP", "custFieldGraph": "false", "Identifier": ".1.3.6.1.4.1.43.45.1.6.1.2.2.1.3.65536", "customGraph": "false", "associatedDeviceCount": 0, "monitorName": "Total current buffer", "displayName": "Total current buffer", "vendor": "3Com", "description": "The total number of buffer currently.", "graphId": "3253"}, { "graphName": "hwBufSize", "protocol": "SNMP", "custFieldGraph": "false", "Identifier": ".1.3.6.1.4.1.43.45.1.6.1.2.2.1.2.65536", "customGraph": "false", "associatedDeviceCount": 0, "monitorName": "Buffer size", "displayName": "Buffer size", "vendor": "3Com", "description": "The size of buffer,unit is byte.", "graphId": "3254"}, { "graphName": "hwCpuCostRatePer1Min", "protocol": "SNMP", "custFieldGraph": "false", "Identifier": ".1.3.6.1.4.1.43.45.1.6.1.1.1.3.0", "customGraph": "false", "associatedDeviceCount": 0, "monitorName": "CPU Cost Rate (1 min)", "displayName": "CPU Cost Rate (1 min)", "vendor": "3Com", "description": "1 Minute CPU AVG", "graphId": "3255"}, { "graphName": "hwCpuCostRate5sec", "protocol": "SNMP", "custFieldGraph": "false", "Identifier": ".1.3.6.1.4.1.43.45.1.6.1.1.1.2.0", "customGraph": "false", "associatedDeviceCount": 0, "monitorName": "CPU Cost Rate (5 sec)", "displayName": "CPU Cost Rate (5 sec)", "vendor": "3Com", "description": "The overall CPU busy percentage in the last 5 second period.", "graphId": "3256"}, { "graphName": "A10CPUUtilization", "protocol": "SNMP", "custFieldGraph": "false", "Identifier": ".1.3.6.1.4.1.22610.2.4.1.3.3.0", "customGraph": "false", "associatedDeviceCount": 0, "monitorName": "CPU Utilization", "displayName": "CPU Utilization", "vendor": "A10 Networks", "description": "Monitors the average CPU usage in last 5 seconds.", "graphId": "526"}, { "graphName": "A10MemoryUtilization", "protocol": "SNMP", "custFieldGraph": "false", "Identifier": ".1.3.6.1.4.1.22610.2.4.1.2.2.0*100/.1.3.6.1.4.1.22610.2.4.1.2.1.0", "customGraph": "false", "associatedDeviceCount": 0, "monitorName": "Memory Utilization", "displayName": "Memory Utilization", "vendor": "A10 Networks", "description": "Monitors the memory utilization(%).", "graphId": "527"}, { "graphName": "A10GlobalConnections", "protocol": "SNMP", "custFieldGraph": "false", "Identifier": ".1.3.6.1.4.1.22610.2.4.3.19.1.10.0", "customGraph": "false", "associatedDeviceCount": 0, "monitorName": "Active Connections", "displayName": "Active Connections", "vendor": "A10 Networks", "description": "Monitors the count of current connections.", "graphId": "528"}, { "graphName": "A10SystemTemperature", "protocol": "SNMP", "custFieldGraph": "false", "Identifier": ".1.3.6.1.4.1.22610.2.4.1.5.1.0", "customGraph": "false", "associatedDeviceCount": 0, "monitorName": "System Temperature", "displayName": "System Temperature", "vendor": "A10 Networks", "description": "Monitors the physical system temperature in Celsius.", "graphId": "529"}, { "graphName": "A10FanStatus", "protocol": "SNMP", "custFieldGraph": "false", "Identifier": " .1.3.6.1.4.1.22610.2.4.1.5.9.1.3.0", "customGraph": "false", "associatedDeviceCount": 0, "monitorName": "Fan Status", "displayName": "Fan Status", "vendor": "A10 Networks", "description": "Monitors the fan status: 0: Failed, 4: OK-fixed/high, 5: OK-low/med, 6: OK-med/med, 7: OK-med/high, -2: not ready, 1: unknown.", "graphId": "530"}, { "graphName": "A10LowerPowerSupplyStatus", "protocol": "SNMP", "custFieldGraph": "false", "Identifier": ".1.3.6.1.4.1.22610.2.4.1.5.7.0", "customGraph": "false", "associatedDeviceCount": 0, "monitorName": "Lower Power Supply Status", "displayName": "Lower Power Supply Status", "vendor": "A10 Networks", "description": "Monitors the lower power supply status. Power supply status : off(0),on(1),unknown(-1).", "graphId": "531"}, { "graphName": "A10UpperPowerSupplyStatus", "protocol": "SNMP", "custFieldGraph": "false", "Identifier": ".1.3.6.1.4.1.22610.2.4.1.5.8.0", "customGraph": "false", "associatedDeviceCount": 0, "monitorName": "Upper Power Supply Status", "displayName": "Upper Power Supply Status", "vendor": "A10 Networks", "description": "Monitors the Upper power supply status. Power Supply status: off(0),on(1),unknown(-1).", "graphId": "532"}, { "graphName": "A10DiskFreeSpace", "protocol": "SNMP", "custFieldGraph": "false", "Identifier": ".1.3.6.1.4.1.22610.2.4.1.4.2.0", "customGraph": "false", "associatedDeviceCount": 0, "monitorName": "Free disk Space", "displayName": "Free disk Space", "vendor": "A10 Networks", "description": "Monitors the Free space of the disk in MB.", "graphId": "533"}, { "graphName": "A10DiskUtilization", "protocol": "SNMP", "custFieldGraph": "false", "Identifier": "(.1.3.6.1.4.1.22610.2.4.1.4.1.0-.1.3.6.1.4.1.22610.2.4.1.4.2.0)*100/.1.3.6.1.4.1.22610.2.4.1.4.1.0", "customGraph": "false", "associatedDeviceCount": 0, "monitorName": "Disk Utilization", "displayName": "Disk Utilization", "vendor": "A10 Networks", "description": "Monitors the usage of the disk in MB.", "graphId": "534"}
]
Rate limit: 500 requests per minute. Exceeding this limit will block requests for 1 minute

Map Entity

Maps an entity to a device for monitoring purposes

HTTP Method

POST

API URL

https://localhost:8060/api/json/device/mapEntity?apiKey=***************

Parameters

Param NameDescriptionData TypeAdditional InformationIs Mandatory
apiKeyAPI Key to access your OpManager server.Yes
entityIDVirtual Machine entity idlong- Yes
virtualTypeVirtual TypeStringAllowed Values: The input must be exactly one of the following — VMware-Datastore,VMware-Host,VMware-VM,HyperV-VM, Xen-VM,Nutanix-Host,Nutanix-VM,IPMI,Proxmox-Node,Proxmox-VM,Proxmox-ContainerYes
ipAddressIp Address/device name of the device to mapBooleanNo
credentialIDsCredential ids of the new device to discover for mappingJSONArrayRegex :: Array of the Long ["30604"]No

Sample Response

HTTP Code: 200

{ "result": "true", "status": "Started monitoring the VM New Virtual Machine with ipAddress test-2k16.corporation.com"}
Rate limit: 500 requests per minute. Exceeding this limit will block requests for 1 minute

suppressVSANDiskAlarm

Suppresses alarm notifications for VSAN disk issues

HTTP Method

POST

API URL

https://localhost:8060/api/json/device/suppressVSANDiskAlarm?apiKey=***************

Parameters

Param NameDescriptionData TypeAdditional InformationIs Mandatory
apiKeyAPI Key to access your OpManager server.Yes
diskIDDisk ID long-Yes
enableenable/disable Boolean-Yes

Sample Response

HTTP Code: 200

{ "result":{ "message": "Alert suppression has been enabled successfully for vSAN Disk VsanDisk0"}} 
Rate limit: 500 requests per minute. Exceeding this limit will block requests for 1 minute

Unmap Entity

Removes the mapping of an entity from a device

HTTP Method

POST

API URL

https://localhost:8060/api/json/device/unMapEntity?apiKey=***************

Parameters

Param NameDescriptionData TypeAdditional InformationIs Mandatory
apiKeyAPI Key to access your OpManager server.Yes
entityIDVirtual Machine entity idlong- Yes
virtualTypeVirtual TypeStringAllowed Values: The input must be exactly one of the following — VMware-Host, VMware-VM, HyperV-VM, Xen-VM, Nutanix-VM, Nutanix-Host, IPMI, Proxmox-VM, or Proxmox-ContainerYes

Sample Response

HTTP Code: 200

{ "result": "true", "status": "Stopped monitoring server as Virtual Server"}
Rate limit:500 requests per minute. Exceeding this limit will block requests for 1 minute

Discovery

addDevice

Allows you to add individual devices to OpManager for monitoring.

HTTP Method

POST

API URL

https://localhost:8060/api/json/discovery/addDevice?apiKey=***************&deviceName=opmserver.mydomain.com

Parameters

Param NameDescriptionData TypeAdditional InformationIs Mandatory
apiKeyAPI Key to access your OpManager server.String-Yes
deviceNameName of the device to addString-Yes
netmasksubnet mask of the device networkStringAllowed characters: 0–255 for each octet, dot(.) as separatorNo
networkAddressnetwork address for discoveryStringAllowed characters: A–Z, a–z, all Unicode letters, 0–9, space( ), dot(.), exclamation(!), colon(:), at(@), hash(#), dollar($), greater than(>), equal(=), less than(<), ampersand(&), plus(+), asterisk(*), hyphen(-), backslash(\), slash(/), single quote('), comma(,), underscore(_), parenthesis(())No
credentialNamecredential profile to use for discovery (SNMP, WMI, etc.)String-No
addDeviceToNCMadds the device to Network Configuration ManagerBoolean-No
addDeviceToIPAMadds the device to IP Address ManagerBoolean-No
addTypeType of additionStringAllowed values: addVMwareVC, addVMwareESX, addXen, addHyperv, addNutanix, addVxRail, addProxmox (case-insensitive)No
addDeviceTypespecifies device categoryStringAllowed values: UCSNo
isOpUSPMflag for OpUtils/Storage Performance Monitor integrationBoolean-No
displayNameDisplay Name of the deviceString-No
typedevice typeStringAllowed characters: A–Z, a–z, all Unicode letters, 0–9, space( ), comma(,), dot(.), hyphen(-), underscore(_), parenthesis(()), slash(/), plus(+), exclamation(!), at(@), hash(#), dollar($), square brackets([ ]), caret(^), colon(:), semicolon(;), equals(=), ampersand(&), single quote(')No
isNonSNMPindicates if SNMP discovery is usedBoolean-No
DEVICE_BEHAVIOURdefines monitoring behavior or role of deviceString-No
SERIESdevice series lineString-No
MODELspecific model name of the deviceString-No
COLUMNNAME1optional custom attributesString-No
COLUMNNAME2optional custom attributesString-No
newgroupnamename of new device group to createString-No
addGroupNameIDID of existing group to add the device toString-No
snmpPingSweepEnableenables SNMP ping during discoveryInteger-No
sysDetailsincludes system details in device dataInteger-No
arpDetailsincludes ARP table details during additionInteger-No
parentIDID of parent deviceLong-No
pollerIDPoller ID handling the deviceLong-No
vxrailCredentialNamecredential for VxRail device discoveryStringAllowed characters: A–Z, a–z, all Unicode letters, 0–9, hyphen(-), dot(.), underscore(_), plus(+), at(@), dollar($), space( )No
vxrailDeviceNamename of the VxRail deviceString-No
availabilityNodespecifies the node used to track the device’s availability statusBoolean-No
autoVmDiscoveryenables automatic discovery of VMs on the deviceBoolean-No

Sample Response

HTTP Code: 200

{ "result":{ "deviceIp": "10.10.10.1", "message": "Device added successfully", "deviceName": "10.10.10.1", "moid": 3125}}
Rate limit: 10 requests per minute. Exceeding this limit will block requests for NO_TIME_LIMIT minute

Enterprise

listProbes

This API is to list all the probes, and the probe's details configured in the central.(Note: This API is applicable only for central server)

HTTP Method

GET

API URL

https://localhost:8060/api/json/admin/listProbes?apiKey=***************

Parameters

Param NameDescriptionData TypeAdditional InformationIs Mandatory
apiKeyAPI Key to access your OpManager server.Yes

Sample Response

HTTP Code: 200

{ "severityVsCount":{ "Trouble": 1, "Critical": 2, "Attention": 3}, "List": [ { "modTimeLong": "1666786290075", "statusStr": "Attention", "prettyTime": "5 minutes ago", "displayname": "opm-server1", "text": "CPU Utilization is 12%, threshold value for this monitor is 2%: Top 3 Processes:-WmiPrvSE#4 - 1.467%;CynetMS - 1.381%;Code#4 - 0.69%", "category": "Desktop", "statusNum": "3"}, { "modTimeLong": "1666785470844", "statusStr": "Critical", "prettyTime": "19 minutes ago", "displayname": "opm-server1", "text": "Disk Utilization is 44%, threshold value for this monitor is 5%", "category": "Desktop", "statusNum": "1"}, { "modTimeLong": "1666785450689", "statusStr": "Trouble", "prettyTime": "19 minutes ago", "displayname": "opm-server1", "text": "Memory Utilization is 75%, threshold value for this monitor is 4%: Top 3 Processes:-java.exe - 7.247%;CynetMS.exe - 3.791%;explorer.exe - 3.216%", "category": "Desktop", "statusNum": "2"}, { "modTimeLong": "1666785429095", "statusStr": "Attention", "prettyTime": "20 minutes ago", "displayname": "opm-server1", "text": "CPU Utilization is 21%, threshold value for this monitor is 2%: Top 3 Processes:-svchost#25 - 12.362%;MEARWService - 6.266%;msedge#7 - 2.371%", "category": "Desktop", "statusNum": "3"}, { "modTimeLong": "1666091221235", "statusStr": "Critical", "prettyTime": "8 days ago", "displayname": "System", "text": "File Integrity : New files were found during the last scan.", "category": "Security settings", "statusNum": "1"}, { "modTimeLong": "1666090716359", "statusStr": "Attention", "prettyTime": "8 days ago", "displayname": "opm-server1", "text": "CPU Utilization is 9%, threshold value for this monitor is 2%: Top 3 Processes:-java - 6.377%;svchost#21 - 6.207%;msedge#6 - 1.616%", "category": "Desktop", "statusNum": "3"} ], "Details":{ "Desktop": [ { "value": 3, "status": 3, "label": "Attention"}, { "value": 1, "status": 2, "label": "Trouble"}, { "value": 1, "status": 1, "label": "Critical"} ], "Security settings": [ { "value": 1, "status": 1, "label": "Critical"} ]}}
Rate limit: 25 requests per minute. Exceeding this limit will block requests for 1 minute

Events

listEvents

This API is used to list all the events generated in OpManager.

HTTP Method

GET

API URL

https://localhost:8060/api/json/events/listEvents?apiKey=***************

Parameters

Param NameDescriptionData TypeAdditional InformationIs Mandatory
apiKeyAPI Key to access your OpManager server.Yes
deviceNameName of the device for which the events should be listed. This can be retrieved using the listDevices API.StringAllowed values: Any valid device nameNo
entityEntity of the event for which the events should be listed.StringAny valid entity name.
Allowed Characters: Any letters, numbers, spaces, and these symbols: . ! & : @ # $ - _ ' , /
No
periodTime period for which events should be listed.Allowed values: custom, Today, onehour, twohours, fourhours, sixhours, eighthours, twelvehours, twfourhours, before_12_hours, before_24_hours, before_48_hours, Last_7_Days, WEEK, Last_30_Days, MONTH, Last_60_Days, Last_90_Days, Yesterday, thisweek, lastweek, thismonth, Last_Month, Last 12 hours, Last 24 hours, Last 7 days, This week, Last week, This month, Last month, Last 30 days

(e.g., period=Last_7_Days)
No
severitySeverity of the alarmAllowed values: Attention, Trouble, Critical, Info.
(e.g., severity=Critical)
No
categoryDevice category of the alarmA valid category name.
Allowed Characters: Any letters, numbers and these symbols: . , space ~ ` : \ / - _
No

Sample Response

HTTP Code: 200

[ { "severity": "Critical", "eventMessage": "Device is down", "source": "192.168.1.1", "eventType": "System", "entity": "Device_Poll", "timeStamp": "2022-10-26 14:30:00"}
]
Rate limit: 50 requests per minute. Exceeding this limit will block requests for 1 minute

addEvent

This API is used to add a new event in OpManager.

HTTP Method

POST

API URL

https://localhost:8060/api/json/events/addEvent?apiKey=***************&source=sample_source&severity=1&eventMessage=sample_message&alarmCode=sample_code&entity=sample_entity&eventType=sample_type

Parameters

Param NameDescriptionData TypeAdditional InformationIs Mandatory
apiKeyAPI Key to access your OpManager server.StringYes
sourceName of the device for which the events should be added. This can be retrieved using the listDevices API.A valid device name.
Allowed: Any combination of letters, numbers, dots (.), spaces, dashes (-), and underscores (_).
Yes
severitySeverity of the eventintAllowed values: 1 (Critical), 2 (Warning), 3 (Attention), 4 (Service Down)
(e.g., severity=1)
Yes
eventMessageMessage for the eventAllowed: Any combination of letters, numbers, spaces, and these symbols: . ! : @ # $ - _ \ / ' ,Yes

Sample Response

HTTP Code: 200

{ "result":{ "message": "Event added successfully"}}
Rate limit: 500 requests per minute. Exceeding this limit will block requests for 1 minute

Groups

listAllLogicalGroups

Lists all the groups available in OpManager. Also provides basic group information such as members count and group health.

HTTP Method

GET

API URL

https://localhost:8060/api/json/admin/listAllLogicalGroups?apiKey=***************

Parameters

Param NameDescriptionData TypeAdditional InformationIs Mandatory
apiKeyAPI Key to access your OpManager server.String-Yes
isFluidicindicates if the new (fluidic) UI layout is usedBoolean-No
pagecurrent page number for paginationInteger-No
rowsnumber of records per pageIntegerAllowed values: 1-1000, 2000No
sortByTypesort order (asc/desc)StringAllowed values: asc, desc, ASC, DESCNo
sortByColumncolumn name used for sortingStringAllowed values: groupDisplayName, description, groupType, displayGroupType, status, count, DISPLAYNAME, availability, isSuppressed, memberAvailabilityNo
_searchflag to indicate if it's a search queryBoolean-No
ndrequest timestampLong-No
isGroupPagespecifies if the request is from the group view pageBoolean-No
filtersapplies filtering conditions to group resultsJSONObject** groupOp - String - Allowed values: AND
** rules - JSONArray -
--> field - String - Allowed values: groupDisplayName, description, groupType, displayGroupType, status, count, DISPLAYNAME, availability, isSuppressed, memberAvailability
--> op - String - Allowed values: cn, eq
--> data - String - Allowed characters: A-Z, a-z, all Unicode letters, 0-9, space( ), dot(.), exclamation(!), colon(:), at(@), hash(#), percent(%), dollar($), equal(=), greater than(>), less than(<), ampersand(&), plus(+), asterisk(*), hyphen(-), backslash(), slash(/), single quote('), comma(,), underscore(_), parenthesis(()), tilde(~), backtick(`), square brackets([ ]), curly braces({}), caret(^), semicolon(;), pipe(|), question mark(?), double quote("), all non-Basic Latin characters
No

Sample Response

HTTP Code: 200

[ { "groupType": "Interface", "isSuppressed": false, "groupID": "3127", "count": "4", "description": "No Description", "statusImg": "/images/devices/status2.gif", "availability": "NA", "statusLabel": "Trouble", "groupDisplayName": "DevParent", "groupName": "devparent-3127", "suppressedMessage": "", "displayGroupType": "Interface", "status": "2"}, { "groupType": "Device", "isSuppressed": false, "groupID": "3128", "count": "4", "description": "Testing", "statusImg": "/images/devices/status5.gif", "availability": "NA", "statusLabel": "Clear", "groupDisplayName": "DevCrir", "groupName": "devcrir-3128", "suppressedMessage": "", "displayGroupType": "Device", "status": "5"}
]
Rate limit: 100 requests per minute. Exceeding this limit will block requests for 1 minute

getLogicalGroupInfo

Provides details (such as members count, group status, etc.) of the given group.

HTTP Method

GET

API URL

https://localhost:8060/api/json/admin/getLogicalGroupInfo?apiKey=***************&groupName=NorthBayRegion-4201&period=3&snapType=LogicalDeviceGroup

Parameters

Param NameDescriptionData TypeAdditional InformationIs Mandatory
apiKeyAPI Key to access your OpManager server.String-Yes
groupNameName of the group with MOID appended in the suffix.StringAllowed characters: A-Z, a-z, all Unicode letters, 0-9, space( ), dot(.), exclamation(!), colon(:), at(@), hash(#), dollar($), hyphen(-), underscore(_), backslash(\), slash(/), single quote('), comma(,)Yes
periodTime for which the availability data is to be fetched.[Example: twfourhours(3)]IntegerAllowed values: 3Yes
snapTypeGroup Snapshot type.StringAllowed values: LogicalDeviceGroup, LogicalIntfGroup, LogicalGroup, LogicalIPSLAGroupNo
expandspecifies whether to include detailed device information within the logical groupBoolean-No

Sample Response

HTTP Code: 200

{ "GroupDetails":{ "groupType": "Interface", "groupID": "3127", "count": "4", "description": "No Description", "statusImg": "/images/devices/status2.gif", "statusLabel": "Trouble", "groupDisplayName": "DevParent", "groupName": "devparent-3127", "interfaceInterface_Count": "4", "alertCount": 7, "statusChangeCount": 3, "displayGroupType": "Interface", "status": "2"}, "DashBoardDetails":{ "Distribution":{ "data":{ "chartData": [ { "seriesname": "99.99 - 100", "data": [ [ 1759818600000, 100 ], [ 1759822200000, 100 ], [ 1759825800000, 100 ] ], "yaxiscolumnorder": [ 0 ]}, { "seriesname": "99 - 99.99", "data": [ [ 1759818600000, 0 ], [ 1759822200000, 0 ], [ 1759825800000, 0 ] ], "yaxiscolumnorder": [ 0 ]}, { "seriesname": "90 - 99", "data": [ [ 1759818600000, 0 ], [ 1759822200000, 0 ], [ 1759825800000, 0 ] ], "yaxiscolumnorder": [ 0 ]}, { "seriesname": "50 - 90", "data": [ [ 1759818600000, 0 ], [ 1759822200000, 0 ], [ 1759825800000, 0 ] ], "yaxiscolumnorder": [ 0 ]}, { "seriesname": "10 - 50", "data": [ [ 1759818600000, 0 ], [ 1759822200000, 0 ], [ 1759825800000, 0 ] ], "yaxiscolumnorder": [ 0 ]}, { "seriesname": "0 - 10", "data": [ [ 1759818600000, 0 ], [ 1759822200000, 0 ], [ 1759825800000, 0 ] ], "yaxiscolumnorder": [ 0 ]}, { "seriesname": "Not Monitored", "data": [ [ 1759818600000, 0 ], [ 1759822200000, 0 ], [ 1759825800000, 0 ] ], "yaxiscolumnorder": [ 0 ]} ], "xyTitles": [ "Time", "Distribution (%)" ]}, "displayName": "Availability Distribution"}}, "alarmProfileDetails": []}
Rate limit: 50 requests per minute. Exceeding this limit will block requests for 1 minute

getLogicalGroupAlerts

Fetches the alarms generated from the members (devices/interfaces) of the given group.

HTTP Method

GET

API URL

https://localhost:8060/api/json/admin/getLogicalGroupAlerts?apiKey=***************&groupName=bvgcty-4201

Parameters

Param NameDescriptionData TypeAdditional InformationIs Mandatory
apiKeyAPI Key to access your OpManager server.String-Yes
groupNameName of the groupStringAllowed characters: A-Z, a-z, all Unicode letters, 0-9, space( ), dot(.), exclamation(!), colon(:), at(@), hash(#), dollar($), hyphen(-), underscore(_), backslash(\), slash(/), single quote('), comma(,)No
expandspecifies whether to include detailed device information within the logical groupBoolean-No

Sample Response

HTTP Code: 200

[ { "severity": "Critical", "groupType": "device", "severityString": "/images/devices/status1.gif", "modTime": "25 Nov 2022 02:27:11 PM IST", "displayName": "Pradh", "name": "opm-server", "alarmId": 1, "type": "device", "message": "Device Down: No response from device for last 5 polls", "entity": "opm-server_Poll", "status": 1}, { "severity": "Attention", "groupType": "device", "severityString": "/images/devices/status3.gif", "modTime": "25 Nov 2022 07:17:49 PM IST", "displayName": "HPswitch9", "name": "10.5.5.1", "alarmId": 33, "type": "device", "message": "Device not responding: Probably down or busy", "entity": "10.5.5.1_Poll", "status": 3}, { "severity": "Attention", "groupType": "device", "severityString": "/images/devices/status3.gif", "modTime": "25 Nov 2022 02:50:59 PM IST", "displayName": "HPswitch9", "name": "10.5.5.1", "alarmId": 26, "type": "device", "message": "Response Time is 21 ms, threshold value for this device is 10 ms", "entity": "154_Device", "status": 3}
]
Rate limit: 50 requests per minute. Exceeding this limit will block requests for 1 minute

listLogicalGroupMembers

Provides information on the members available in the given group.

HTTP Method

GET

API URL

https://localhost:8060/api/json/admin/listLogicalGroupMembers?apiKey=***************&groupName=NorthBayRegion-4201

Parameters

Param NameDescriptionData TypeAdditional InformationIs Mandatory
apiKeyAPI Key to access your OpManager server.String-Yes
groupNameName of the Device/Interface Group having suffix as '- '. [Example: Demo-123 ]StringAllowed characters: A-Z, a-z, all Unicode letters, 0-9, space( ), dot(.), exclamation(!), colon(:), at(@), hash(#), dollar($), hyphen(-), underscore(_), backslash(\), slash(/), single quote('), comma(,)Yes
expandspecifies whether to include detailed device information within the logical groupBoolean-No

Sample Response

HTTP Code: 200

[ { "groupType": "Device", "statusStr": "Clear", "displayname": "10.5.5.1", "name": "10.5.5.1", "ipAddress": "10.5.5.1", "type": "Device", "elemRedir": "device", "moid": "304", "statusNum": "5"}, { "groupType": "Device", "statusStr": "Clear", "displayname": "10.5.5.2", "name": "10.5.5.2", "ipAddress": "10.5.5.2", "type": "Device", "elemRedir": "device", "moid": "324", "statusNum": "5"}, { "groupType": "Device", "statusStr": "Attention", "displayname": "10.5.5.3", "name": "10.5.5.3", "ipAddress": "10.5.5.3", "type": "Device", "elemRedir": "device", "moid": "3125", "statusNum": "3"}
]
Rate limit: 100 requests per minute. Exceeding this limit will block requests for 1 minute

addToGroup

Allows you to add device(s) to the specified Group.

HTTP Method

POST

API URL

https://localhost:8060/api/json/device/addToGroup?apiKey=***************&groupName=DemoGroup&groupType=device&selectedMembers=10.5.5.20,10.5.5.30

Parameters

Param NameDescriptionData TypeAdditional InformationIs Mandatory
apiKeyAPI Key to access your OpManager server.String-Yes
groupNameName of the group to add devices toStringAllowed characters: A-Z, a-z, all Unicode letters, 0-9, space( ), dot(.), exclamation(!), colon(:), at(@), hash(#), dollar($), hyphen(-), underscore(_), backslash(\), slash(/), single quote('), comma(,)Yes
groupTypeType of the groupStringAllowed values: device, interfaceYes
selectedMemberslist of devices or members to be added to the groupString-Yes

Sample Response

HTTP Code: 200

{ "result":{ "message": "The Device(s) have been associated to the group successfully."}}
Rate limit: 50 requests per minute. Exceeding this limit will block requests for 1 minute

Interfaces

List Interfaces

Lists all the interfaces monitored in OpManager

HTTP Method

GET

API URL

https://localhost:8060/api/json/device/listInterfaces?apiKey=***************&isFluidic=true&rows=100&page=1&sortByColumn=statusNum&sortByType=desc

Parameters

Param NameDescriptionData TypeAdditional InformationIs Mandatory
apiKeyAPI Key to access your OpManager server.String-Yes
filterscustom conditions to filter interface resultsJSONObject** groupOp - String - Allowed values: AND
** rules - JSONArray -
-->field - String - Allowed values: interfaceDisplayName, displayName, adminStatus, operStatus, ipAddress, type, statusNum, isSuppressed, probeName, UDF followed by one or more digits (e.g., UDF1, UDF12)
-->op - String - Allowed values: cn, eq
-->data - String - No regex
No
pageTo fetch interface list in batches. This should be combinedly used with 'rows' parameter [Example: page=1, rows=200, page=2, rows=200]IntegerAllowed values: 1-5000No
sortByTypeDefining ascending or descending sort of interfaces list [Example, sortByType=asc Or sortByType=desc]StringAllowed values: asc, descNo
sortByColumnSorting interfaces list with columns [Example: inSpeed, displayName, ipaddress, outSpeed, statusNum, severity - 1 (Critical), 2 (Trouble), 3 (Attention), 4 (service down), 5 (Clear), 7 (Unmanaged)]StringAllowed values: statusNum, interfaceDisplayName, displayName, adminStatus, operStatus, ipAddress, type, inSpeed, outSpeed, inTraffic, outTraffic, isSuppressed, probeName, UDF followed by one or more digits (e.g., UDF1, UDF12)No
rowsTo fetch interface list in batches. This should be combinedly used with 'page' parameter [Example: page=1, rows=200, page=2, rows=200]IntegerAllowed values: 1-20000Yes
_searchindicates if the request is a search queryBoolean-No
ndrequest timestampLong-No
isFluidicSet value as 'true' by default (for internal purpose)Boolean-No
classificationClassification of DeviceStringAllowed values: Network, Router, Switch, Printer, Server, PhysicalServer, Windows, Linux, MSSQL, Exchange, DomainController, Wireless, Firewall, IPMI, MonitoringAgentNo
severityFilter interfaces with severity. [Example: 1 (Critical), 2 (Trouble), 3 (Attention), 4 (service down), 5 (Clear), 7 (Unmanaged)]StringAllowed values: 1–11, comma(,)No
typeFilter interface with interface type. [Example: Ethernet,Software Loopback, etc]StringAllowed characters: A–Z, a–z, all Unicode letters, 0–9, space( ), comma(,), dot(.), hyphen(-), underscore(_), parenthesis(()), slash(/), plus(+), exclamation(!), at(@), hash(#), dollar($), square brackets([ ]), caret(^), colon(:), semicolon(;), equals(=), ampersand(&), single quote('), all non-Basic Latin charactersNo
isIdleInterfacefilters only idle or inactive interfacesBoolean-No
intfPropsTo fetch additional interface properties such as ifName (Interface ifName), moid (internal managed object identifier used for interface/device), physAddressBoolean-No
intfGroupIDfilters interfaces belonging to a specific interface groupLong-No
customFieldsfilter by custom fieldsStringAllowed characters: A–Z, a–z, all Unicode letters, 0–9, space( ), dot(.), exclamation(!), colon(:), at(@), hyphen(-), underscore(_), backslash(\), slash(/), single quote('), comma(,)No
isAPlusflag related to advanced interface monitoringBoolean-No

Sample Response

HTTP Code: 200

{ "total": "0", "records": "0", "page": "1", "rows": [ { "interfaceDisplayName": "Switch loopback interface-lo0", "isSuppressed": false, "statusStr": "Trouble", "adminStatusImg": "", "displayName": "10.5.5.1", "operStatusImg": "", "ipAddress": "", "outSpeed": "0 bps", "inSpeed": "0 bps", "type": "Software Loopback", "deviceName": "10.5.5.1", "interfaceStatus": 2, "outTraffic": "72.513 M (0.0%)", "statusNum": 2, "suppressedMessage": "", "inTraffic": "67.446 M (0.0%)", "adminStatus": "Up", "operStatus": "Up", "id": "494", "interfaceName": "IF-10.5.5.1-494", "iconPath": "images/intfTypes/anonIfType.gif"}, { "interfaceDisplayName": "VLAN3853-NWT-MGMT", "isSuppressed": false, "statusStr": "Trouble", "adminStatusImg": "", "displayName": "10.5.5.1", "operStatusImg": "", "ipAddress": "10.5.5.12", "outSpeed": "0 bps", "inSpeed": "0 bps", "type": "Proprietary Virtual", "deviceName": "10.5.5.1", "interfaceStatus": 2, "outTraffic": "93.811 M (0.0%)", "statusNum": 2, "suppressedMessage": "", "inTraffic": "69.148 M (0.0%)", "adminStatus": "Up", "operStatus": "Up", "id": "493", "interfaceName": "IF-10.5.5.1-493", "iconPath": "images/intfTypes/anonIfType.gif"} ]}
Rate limit: 500 requests per minute. Exceeding this limit will block requests for 1 minute

getInterfaceSummary

Provides basic details of the interface such as ifIndex, ifName, ifDesc, ifAlias, parent device, Rx/Tx Traffic, etc.

HTTP Method

GET

API URL

https://localhost:8060/api/json/device/getInterfaceSummary?apiKey=***************&interfaceName=IF-10.5.5.5-4429

Parameters

Param NameDescriptionData TypeAdditional InformationIs Mandatory
apiKeyAPI Key to access your OpManager server.String-Yes
interfaceNameManagedObject name of the interface as seen in the URL of interface snapshot page OR 'interfaceName' property value in the listInterfaces API response..String-Yes
snapTypeSpecifies the type of snapshot data to fetchStringAllowed values: MonitoringInterfaceNo

Sample Response

HTTP Code: 200

{ "IntfIpaddress": "10.5.5.5", "recBandwidth": "0", "NFA_ID": "", "instance": "4504", "Util": "5", "avgOutPackets": "4.949 M", "outTraffic": "63.247 M", "moID": "493", "isIPAvailable": true, "intfDisplayName": "VLAN3853-NWT-MGMT", "txUtil": "0.0", "operStateImg": "", "rstime": "0 bps", "statusPollEnabled": "true", "ifAdminStatus": "1", "isAgentMonitoring": false, "ifSpeedIn": "0", "rxUtil": "0.0", "ifName": "VLAN3853", "stringStatus": "Down", "Discards": "2", "Errors": "2", "pollInterval": "900", "operState": "Up", "intfmanaged": "true", "name": "10.5.5.1", "typeId": "53", "adminStateImg": "", "desc": "VLAN3853", "status": "2", "trafficCounter": "32 bit", "displayName": "10.5.5.1", "availability":{ "Down": 0, "Dependent Unavailable": 0, "Not Monitored": 0, "On Hold": 0, "Parent Down": 0, "On Maintenance": 0, "Up": 100}, "inSpeedDisplayValue": "0 bps", "typeIdDescr": "Proprietary Virtual (53)", "isSubInterface": "false", "managed": "true", "ifPhysAddr": "90 20 c2 20 28 40", "adminState": "Up", "transBandwidth": "0", "statusPolledVia": "SNMP", "outSpeedDisplayValue": "0 bps", "availabilityTimeLine": [ "UP,1759861803159,1759906863159,Up" ], "rxPackets": "2.154 K", "isAddedToNFA": "false", "txPackets": "1.597 K", "pollingStatus": "0", "ifAlias": "NWT-MGMT", "ifSpeedOut": "0", "inTraffic": "79.976 M", "intfMoName": "IF-10.5.5.1-493", "ifOperStatus": "1", "category": "Switch", "avgInPackets": "4.64 M"}
Rate limit: 50 requests per minute. Exceeding this limit will block requests for 1 minute

getIntfAtAGlanceReportDetails

Provides a consolidated availability and performance monitoring health report data for the given interface.

HTTP Method

GET

API URL

https://localhost:8060/api/json/v2/device/getIntfAtAGlanceReportDetails?apiKey=***************&InterfaceName=IF-xxx.xxx.xx.4-3820&period=Today

Parameters

Param NameDescriptionData TypeAdditional InformationIs Mandatory
apiKeyAPI Key to access your OpManager server.String-Yes
InterfaceNameName of the interface - Managed Entity name as seen in the URL of interface snapshot page OR 'interfaceName' property value in the listInterfaces API response.String-Yes
periodPeriod for which the interface data is required.StringAllowed values: custom, Today, onehour, twohours, fourhours, sixhours, eighthours, twelvehours, twfourhours, before_12_hours, before_24_hours, before_48_hours, Last_7_Days, WEEK, Last_30_Days, MONTH, Last_60_Days, Last_90_Days, Yesterday, thisweek, lastweek, thismonth, Last_Month, Last 12 hours, Last 24 hours, Last 7 days, This week, Last week, This month, Last month, Last 30 days, last_7_days, last_30_days, last_90_days, Last_12_hours, Last_24_hours, This_Week, This_Month, Last_Week, Next_7_days, Next_14_days, Next_30_days, Next_60_days, Next_90_days, Next_12_hours, Next_24_hours, This_Week, This_Quarter, Last_Quarter, Last_3_Months, Last_6_MonthsYes
startDateFrom Date. This parameter is applicable only if 'custom' time is opted in period param valueStringAllowed values: day/month/year hours:minutes
Allowed characters: day: 01–31, month: 01–12, year: any 4 digits, hours: 00–23, minutes: 00–59, slash(/), space( ), colon(:)
No
endDateTo Date. This parameter is applicable only if 'custom' time is opted in period param valueStringAllowed values: day/month/year hours:minutes
Allowed characters: day: 01–31, month: 01–12, year: any 4 digits, hours: 00–23, minutes: 00–59, slash(/), space( ), colon(:)
No

Sample Response

HTTP Code: 200

{ "intfDisplayName": "VLAN555-VLAN555", "InterfaceCategory": "LAN", "Details":{ "Parent Name": "HPswitch9", "IfDescr": "VLAN555", "IfAlias": "VLAN555", "IfIndex": "1132", "Receive Bandwidth": "0 bps", "IfName": "VLAN555", "Transmit Bandwidth": "0 bps", "Circuit ID": "-"}, "repType": 7, "graphData":{ "Errors": [ { "seriesname": "inErrors", "data": [ [ 1669619780249, 0, "0 " ], [ 1669620680708, 0, "0 " ] ], "xyTitles": [ "Time", "Errors/sec" ], "yaxiscolumnorder": [ 0 ], "suffix": ""}, { "seriesname": "outErrors", "data": [ [ 1669619780249, 0, "0 " ], [ 1669620680708, 0, "0 " ] ], "xyTitles": [ "Time", "Errors/sec" ], "yaxiscolumnorder": [ 0 ], "suffix": ""} ], "Unicast": [ { "seriesname": "broadcast", "data": [ [ 1669619780249, 0, "0 " ], [ 1669620680708, 0, "0 " ] ], "xyTitles": [ "Time", "%" ], "yaxiscolumnorder": [ 0 ], "suffix": ""}, { "seriesname": "unicast", "data": [ [ 1669619780249, 0, "0 " ], [ 1669620680708, 0, "0 " ] ], "xyTitles": [ "Time", "%" ], "yaxiscolumnorder": [ 0 ], "suffix": ""} ], "outBytes": [ { "seriesname": "outBytes", "data": [ [ 1669619780249, 0, "0 " ], [ 1669620680708, 0, "0 " ] ], "xyTitles": [ "Time", "" ], "yaxiscolumnorder": [ 0 ], "suffix": ""} ], "inTraffic": [ { "seriesname": "inTraffic", "data": [ [ 1669619780249, 0, "0 " ], [ 1669620680708, 0, "0 " ] ], "xyTitles": [ "Time", "bps" ], "yaxiscolumnorder": [ 0 ], "suffix": ""} ], "inBytes": [ { "seriesname": "inBytes", "data": [ [ 1669619780249, 0, "0 " ], [ 1669620680708, 0, "0 " ] ], "xyTitles": [ "Time", "Bytes/sec" ], "yaxiscolumnorder": [ 0 ], "suffix": ""} ], "inUtilization": [ { "seriesname": "inUtilization", "data": [ [ 1669619780249, 0, "0 " ], [ 1669620680708, 0, "0 " ] ], "xyTitles": [ "Time", "Percentage" ], "yaxiscolumnorder": [ 0 ], "suffix": ""} ], "outUtilization": [ { "seriesname": "outUtilization", "data": [ [ 1669619780249, 0, "0 " ], [ 1669620680708, 0, "0 " ] ], "xyTitles": [ "Time", "Percentage" ], "yaxiscolumnorder": [ 0 ], "suffix": ""} ], "Discards": [ { "seriesname": "inDiscards", "data": [ [ 1669619780249, 0, "0 " ], [ 1669620680708, 0, "0 " ] ], "xyTitles": [ "Time", "Discards/sec" ], "yaxiscolumnorder": [ 0 ], "suffix": ""}, { "seriesname": "outDiscards", "data": [ [ 1669619780249, 0, "0 " ], [ 1669620680708, 0, "0 " ] ], "xyTitles": [ "Time", "Discards/sec" ], "yaxiscolumnorder": [ 0 ], "suffix": ""} ], "totalUtilization": [ { "seriesname": "totalUtilization", "data": [ [ 1669619780249, 0, "0 " ], [ 1669620680708, 0, "0 " ] ], "xyTitles": [ "Time", "Percentage" ], "yaxiscolumnorder": [ 0 ], "suffix": ""} ], "inFrames": [ { "seriesname": "inFrames", "data": [ [ 1669619780249, 0, "0 " ], [ 1669620680708, 0, "0 " ] ], "xyTitles": [ "Time", "Frames/sec" ], "yaxiscolumnorder": [ 0 ], "suffix": ""} ], "outFrames": [ { "seriesname": "outFrames", "data": [ [ 1669619780249, 0, "0 " ], [ 1669620680708, 0, "0 " ] ], "xyTitles": [ "Time", "Frames/sec" ], "yaxiscolumnorder": [ 0 ], "suffix": ""} ], "outTraffic": [ { "seriesname": "outTraffic", "data": [ [ 1669619780249, 0, "0 " ], [ 1669620680708, 0, "0 " ] ], "xyTitles": [ "Time", "bps" ], "yaxiscolumnorder": [ 0 ], "suffix": ""} ]}}
Rate limit: 100 requests per minute. Exceeding this limit will block requests for 1 minute

getIntfBWOutageReportDetails

Provides data for consolidated Bandwidth report (Rx/Tx Traffic) for the given interface.

HTTP Method

GET

API URL

https://localhost:8060/api/json/v2/device/getIntfBWOutageReportDetails?apiKey=***************&interfaceName=IF-xxx.xxx.xx.x-3836&period=Today

Parameters

Param NameDescriptionData TypeAdditional InformationIs Mandatory
apiKeyAPI Key to access your OpManager server.String-Yes
interfaceNameName of the interface - Managed Entity name as seen in the URL of interface snapshot page OR 'interfaceName' property value in the listInterfaces API responseString-Yes
periodPeriod for which the interface graph is required.StringAllowed values: custom, Today, onehour, twohours, fourhours, sixhours, eighthours, twelvehours, twfourhours, before_12_hours, before_24_hours, before_48_hours, Last_7_Days, WEEK, Last_30_Days, MONTH, Last_60_Days, Last_90_Days, Yesterday, thisweek, lastweek, thismonth, Last_MonthYes
startDateFrom Date. This parameter is applicable only if 'custom' time is opted in period param valueStringAllowed values: day/month/year hours:minutesNo
endDateTo Date. This param is applicable only if 'custom' time is opted in period param valueStringAllowed values: day/month/year hours:minutesNo

Sample Response

HTTP Code: 200

{ "InSpeed": "0 bps", "IfDesc": "Switch loopback interface", "repType": 9, "consolidatedValues": [ { "minCollectionTime": "1760677410060", "currVal": "1.309 K ( 0.0 % )", "seriesName": "InTraffic", "exactMaxVal": 14.45119, "maxCollectionTime": "1760679211506", "95thpercVal": "1.0659", "legendType": "intfGraph", "95thpercentileValue": "14.451 K ( 0.0 % )", "exactMinVal": 0.75889, "maxVal": "14.451 K ( 0.0 % )", "minVal": "758.89 ( 0.0 % )", "95thpercRawVal": "1065.9", "avgVal": "3.742 K ( 0.0 % )", "95thperc": "1.065 K ( 0.0 % )"}, { "minCollectionTime": "1760677410060", "currVal": "1.202 K ( 0.0 % )", "seriesName": "OutTraffic", "exactMaxVal": 13.241100000000001, "maxCollectionTime": "1760679211506", "95thpercVal": "0.9796275000000001", "legendType": "intfGraph", "95thpercentileValue": "13.241 K ( 0.0 % )", "exactMinVal": 0.69837, "maxVal": "13.241 K ( 0.0 % )", "minVal": "698.37 ( 0.0 % )", "95thpercRawVal": "979.6275", "avgVal": "3.431 K ( 0.0 % )", "95thperc": "979.627 ( 0.0 % )"}, { "95thpercentileValue": "27.692 K ( 0.0 % )", "minCollectionTime": "1760677410060", "maxVal": "27.692 K ( 0.0 % )", "currVal": "2.512 K ( 0.0 % )", "minVal": "1.457 K ( 0.0 % )", "seriesName": "Total", "95thpercRawVal": "2045.5324999999993", "avgVal": "7.174 K ( 0.0 % )", "95thperc": "2.045 K ( 0.0 % )", "maxCollectionTime": "1760679211506", "95thpercVal": "2.0455324999999993", "legendType": "intfGraph"} ], "seriesNames": [ "InTraffic", "OutTraffic", "Total", "InTraffic-95th", "OutTraffic-95th", "Total-95th" ], "bwChartData": [ { "seriesname": "InTraffic", "isRaw": true, "data": [ [ 1760677410060, 0.75889, "758.89 " ], [ 1760678311494, 1.30847, "1.308 K" ], [ 1760679211506, 14.45119, "14.451 K" ], [ 1760680111518, 0.88658, "886.58 " ], [ 1760681011535, 1.30966, "1.309 K" ] ], "xyTitles": [ "Time", "Bits per Second" ]}, { "seriesname": "OutTraffic", "isRaw": true, "data": [ [ 1760677410060, 0.69837, "698.37 " ], [ 1760678311494, 1.20186, "1.201 K" ], [ 1760679211506, 13.241100000000001, "13.241 K" ], [ 1760680111518, 0.8154, "815.4 " ], [ 1760681011535, 1.2028800000000002, "1.202 K" ] ], "xyTitles": [ "Time", "Bits per Second" ]}, { "seriesname": "Total", "isRaw": true, "data": [ [ 1760677410060, 1.45727, "1.457 K" ], [ 1760678311494, 2.5103299999999997, "2.51 K" ], [ 1760679211506, 27.69229, "27.692 K" ], [ 1760680111518, 1.7019900000000001, "1.701 K" ], [ 1760681011535, 2.51254, "2.512 K" ] ], "xyTitles": [ "Time", "Bits per Second" ]}, { "seriesname": "InTraffic-95th", "data": [ [ 1760677410060, 1.0659, "1.065 K" ], [ 1760681011535, 1.0659, "1.065 K" ] ], "xyTitles": [ "Time", "Bits per Second" ]}, { "seriesname": "OutTraffic-95th", "data": [ [ 1760677410060, 0.9796275000000001, "979.627 " ], [ 1760681011535, 0.9796275000000001, "979.627 " ] ], "xyTitles": [ "Time", "Bits per Second" ]}, { "seriesname": "Total-95th", "data": [ [ 1760677410060, 2.0455324999999993, "2.045 K" ], [ 1760681011535, 2.0455324999999993, "2.045 K" ] ], "xyTitles": [ "Time", "Bits per Second" ]} ], "InterfaceDisplayName": "Switch loopback interface-lo0", "IfAlias": "lo0", "suffix": "K", "availData":{ "Down": 0, "Dependent Unavailable": 0, "Not Monitored": 0, "On Hold": 0, "Parent Down": 0, "On Maintenance": 0, "Up": 100}, "deviceName": "IF-10.5.5.1-13767", "interfaceDetails":{ "Parent Name": "10.5.5.1", "IfDescr": "Switch loopback interface", "IfIndex": "4875", "IfAlias": "lo0", "IfName": "lo0", "Circuit ID": "-"}, "OutSpeed": "0 bps", "name": "10.5.5.1", "CircuitID": "-", "IfIndex": "4875", "InterfaceName": "IF-10.5.5.1-13767", "IfName": "lo0"}
Rate limit: 100 requests per minute. Exceeding this limit will block requests for 1 minute

getInterfaces

Provides the list of interfaces monitored in a device.

HTTP Method

GET

API URL

https://localhost:8060/api/json/device/getInterfaces?apiKey=***************&name=10.5.5.1

Parameters

Param NameDescriptionData TypeAdditional InformationIs Mandatory
apiKeyAPI Key to access your OpManager server.String-Yes
nameName of the parent device - Managed Entity name of the parent device as seen in the URL of device snapshot page OR 'deviceName' property value in the listDevices API responseString-Yes

Sample Response

HTTP Code: 200

{ "isSNMP": true, "downCount": "2", "interfaces": [ { "ifIndex": "1", "statusStr": "Unknown", "ifType": "Ethernet", "imagePath": "/apiclient/ember/images/intfTypes/ifType6.gif", "displayName": "Ethernet0-ifAlias", "RouterPortType": "Eth", "outSpeed": "10 M", "inSpeed": "10 M", "type": "Interface", "nfEnabled": "false", "outTraffic": "NA", "moid": "1808", "suppressedMessage": "", "bgColor": "808080", "isSubInterface": "true", "connected-device": "", "ifAdminStatus": "1", "ifIndexNum": 1, "inUtil": "NA", "isSuppressed": false, "trimmedDispName": "Ethernet0-ifAlias", "ipAddress": "10.5.5.1", "pollingStatus": "15", "statusNum": "7", "inTraffic": "NA", "outUtil": "NA", "statusString": "Unknown", "name": "IF-10.5.5.1-1808", "ifOperStatus": "1", "errors": "NA", "status": "7"}, { "ifIndex": "1", "statusStr": "Trouble", "ifType": "Ethernet", "imagePath": "/apiclient/ember/images/intfTypes/ifType6.gif", "displayName": "Ethernet0-ifAlias", "RouterPortType": "Eth", "outSpeed": "10 M", "inSpeed": "10 M", "type": "Interface", "nfEnabled": "false", "outTraffic": "103.081 Mbps", "moid": "1807", "suppressedMessage": "", "bgColor": "ff8000", "isSubInterface": "false", "connected-device": "", "ifAdminStatus": "1", "ifIndexNum": 1, "inUtil": "100.0", "isSuppressed": false, "trimmedDispName": "Ethernet0-ifAlias", "ipAddress": "10.5.5.2", "pollingStatus": "0", "statusNum": "2", "inTraffic": "75.785 Mbps", "outUtil": "100.0", "statusString": "Trouble", "name": "IF-10.5.5.2-1807", "ifOperStatus": "1", "errors": "13011", "status": "2"} ], "showPollingStatusColumn": true, "interfaceCount": "2"}
Rate limit: 20 requests per minute. Exceeding this limit will block requests for 1 minute

getInterfaceNotes

Fetches the custom field values associated to the given interface.

HTTP Method

GET

API URL

https://localhost:8060/api/json/device/getInterfaceNotes?apiKey=************&interfaceName=IF-10.5.5.1-4505

Parameters

Param NameDescriptionData TypeAdditional InformationIs Mandatory
apiKeyAPI Key to access your OpManager server.String-Yes
interfaceNameName of the interface - Managed Entity name as seen in the URL of interface snapshot page OR 'interfaceName' property value in the listInterfaces API responseString-Yes
actionSpecifies the action to be performedStringAllowed values: editNo

Sample Response

HTTP Code: 200

[ { "CUSTOMFIELDID": "16", "FIELDVALUE": "123", "DATATYPE": "Text", "DESCRIPTION": "Circuit ID", "FIELDNAME": "Circuit ID", "ALIASNAME": "UDF1", "UDF1": "123", "FIELDLENGTH": 250}, { "CUSTOMFIELDID": "21", "FIELDVALUE": "Dhaya", "DATATYPE": "Text", "DESCRIPTION": "Contact person", "FIELDNAME": "Contact Name", "ALIASNAME": "UDF3", "UDF3": "Dhaya", "FIELDLENGTH": 100}
]
Rate limit: 50 requests per minute. Exceeding this limit will block requests for 1 minute

getInterfaceGraphs

Fetches the collected data (such as traffic, errors & discards, etc.) for the given interface.

HTTP Method

GET

API URL

https://localhost:8060/api/json/device/getInterfaceGraphs?apiKey=***************&interfaceName=IF-xxx.xxx.xx.xxx-329&graphName=rxutilization

Parameters

Param NameDescriptionData TypeAdditional InformationIs Mandatory
apiKeyAPI Key to access your OpManager server.String-Yes
interfaceNameName of the interface - Managed Entity name as seen in the URL of interface snapshot page OR 'interfaceName' property value in the listInterfaces API responseString-Yes
periodPeriod for which the interface graph is required.StringAllowed values: custom, Today, onehour, twohours, fourhours, sixhours, eighthours, twelvehours, twfourhours, before_12_hours, before_24_hours, before_48_hours, Last_7_Days, WEEK, Last_30_Days, MONTH, Last_60_Days, Last_90_Days, Yesterday, thisweek, lastweek, thismonth, Last_Month, Last 12 hours, Last 24 hours, Last 7 days, This week, Last week, This month, Last month, Last 30 days, last_7_days, last_30_days, last_90_days, Last_12_hours, Last_24_hours, This_Week, This_Month, Last_Week, Next_7_days, Next_14_days, Next_30_days, Next_60_days, Next_90_days, Next_12_hours, Next_24_hours, This_Week, This_Quarter, Last_Quarter, Last_3_Months, Last_6_MonthsNo
graphNameName of the interface graph [Example: totalPackets, traffic, utilization, errors, discardRate, packets, errorRate]String-Yes
startDateFrom Date. This parameter is applicable only if 'custom' time is opted in period param valueStringAllowed values: day/month/year hours:minutes
Allowed characters: day: 01–31, month: 01–12, year: any 4 digits, hours: 00–23, minutes: 00–59, slash(/), space( ), colon(:)
No
endDateTo Date. This parameter is applicable only if 'custom' time is opted in period param valueStringAllowed values: day/month/year hours:minutes
Allowed characters: day: 01–31, month: 01–12, year: any 4 digits, hours: 00–23, minutes: 00–59, slash(/), space( ), colon(:)
No
isFluidicSet as 'true' by default (for internal purpose) - To get Interface details along with Interface graph valuesBoolean-No
exportXLSIf true, exports the graph data in XLS (Excel) formatBoolean-No
graphFilterTypeSpecifies the aggregation type for the graph data (min, max, avg)StringAllowed values: min, max, avgNo

Sample Response

HTTP Code: 200

{ "interfaceDetails":{ "Parent Name": "Demo_Router1", "IfDescr": "GigabitEthernet0/2", "IfIndex": "4", "IfAlias": "-", "IfName": "Gi0/2", "Circuit ID": "-"}, "displayName": "Total Bytes Transfered", "consolidatedValues":{ "Total Bytes":{ "95thpercentileValue": "61.616 M", "minCollectionTime": "1669383479403", "maxVal": "61.616 M", "currVal": "21.658 M", "minVal": "21.658 M", "seriesName": "Total Bytes", "95thpercRawVal": "5.02440515E7", "avgVal": "51.868 M", "95thperc": "50.244 M", "maxCollectionTime": "1669371779404", "95thpercVal": "50.2440515"}, "Rx Bytes":{ "95thpercentileValue": "14.783 M", "minCollectionTime": "1669383479403", "maxVal": "14.783 M", "currVal": "3.626 M", "minVal": "3.626 M", "seriesName": "Rx Bytes", "95thpercRawVal": "1.1226045333333334E7", "avgVal": "11.734 M", "95thperc": "11.226 M", "maxCollectionTime": "1669364579398", "95thpercVal": "11.226045333333333"}, "Tx Bytes":{ "95thpercentileValue": "48.097 M", "minCollectionTime": "1669383479403", "maxVal": "48.097 M", "currVal": "18.031 M", "minVal": "18.031 M", "seriesName": "Tx Bytes", "95thpercRawVal": "3.8807332333333336E7", "avgVal": "40.134 M", "95thperc": "38.807 M", "maxCollectionTime": "1669371779404", "95thpercVal": "38.807332333333335"}}, "seriesNames": [ "Rx Bytes", "Tx Bytes", "Total Bytes" ], "xyTitles": [ "Time", "Bytes" ], "graphData": [ { "seriesname": "Rx Bytes", "data": [ [ 1669364579398, 14.783359, "14.783 M" ], [ 1669368179398, 11.846604, "11.846 M" ], [ 1669371779404, 13.519316, "13.519 M" ] ]}, { "seriesname": "Tx Bytes", "data": [ [ 1669364579398, 46.577838, "46.577 M" ], [ 1669368179398, 38.532922, "38.532 M" ], [ 1669371779404, 48.097261, "48.097 M" ] ]}, { "seriesname": "Total Bytes", "data": [ [ 1669364579398, 61.361197, "61.361 M" ], [ 1669368179398, 50.379526, "50.379 M" ], [ 1669371779404, 61.616577, "61.616 M" ] ]} ], "suffix": "M"}
Rate limit:100 requests per minute. Exceeding this limit will block requests for 1 minute

Monitoring

getDeviceAssociatedMonitors

Lists all the monitors associated to the device

HTTP Method

GET

API URL

https://localhost:8060/api/json/device/getDeviceAssociatedMonitors?apiKey=***************&name=devicename

Parameters

Param NameDescriptionData TypeAdditional InformationIs Mandatory
apiKeyAPI Key to access your OpManager server.String-Yes
nameName of the device - Managed Entity name as seen in the URL of device snapshot page.String-Yes
isSiteViewindicates whether to fetch monitor data grouped by site viewBoolean-No

Sample Response

HTTP Code: 200

{ "performanceMonitors":{ "total": 5, "statusIcon": "images/servicestatus5.gif", "down": 0, "monitors": [ { "YAXISTEXT": "%", "checkNumeric": "true", "data": [ { "instance": "-1", "value": 0} ], "Instance": "", "THRESHOLDENABLED": "false", "GRAPHID": "1159", "type": "multiple", "thresholdImg": "images/thresholdNonConfigured.gif", "suppressedMessage": "", "pollId": "522", "Protocol": "NCM", "DISPLAYNAME": "Config Change Count", "graphType": "node", "isSuppressed": "false", "policyName": "ChangesMonitor", "active": "true", "thresholdStatus": "Not Enabled", "isMultiple": "true", "sSave": "true", "pollingStatus": "0", "lastCollectedTime": "8 Oct 2025 10:47:43 AM IST", "groupName": "default", "DisplayColumn": "", "name": "ChangesMonitor", "interval": "60", "numericType": "1", "Id": "522"}, { "YAXISTEXT": "%", "checkNumeric": "true", "data": [ { "instance": "-1", "value": 47} ], "Instance": "", "THRESHOLDENABLED": "true", "GRAPHID": "10", "type": "node", "thresholdImg": "images/thresholdConOK.gif", "suppressedMessage": "", "pollId": "455", "Protocol": "SNMP", "DISPLAYNAME": "Memory Utilization", "graphType": "interface", "isSuppressed": "false", "policyName": "ProCurveMemoryUtilization", "active": "true", "thresholdStatus": "Normal", "isMultiple": "false", "sSave": "true", "pollingStatus": "0", "lastCollectedTime": "8 Oct 2025 11:17:12 AM IST", "groupName": "default", "DisplayColumn": "", "name": "ProCurveMemoryUtilization", "interval": "15", "numericType": "1", "Id": "455"}, { "YAXISTEXT": "%", "checkNumeric": "true", "data": [ { "instance": "-1", "value": 0} ], "Instance": "", "THRESHOLDENABLED": "true", "GRAPHID": "4766", "type": "node", "thresholdImg": "images/thresholdConOK.gif", "suppressedMessage": "", "pollId": "451", "Protocol": "SNMP", "DISPLAYNAME": "CPU Utilization", "graphType": "node", "isSuppressed": "false", "policyName": "hpSwitchCPUUtilization", "active": "true", "thresholdStatus": "Normal", "isMultiple": "false", "sSave": "true", "pollingStatus": "0", "lastCollectedTime": "8 Oct 2025 11:19:15 AM IST", "groupName": "default", "DisplayColumn": "", "name": "hpSwitchCPUUtilization", "interval": "5", "numericType": "1", "Id": "451"}, { "YAXISTEXT": "%", "checkNumeric": "true", "data": [ { "instance": "-1", "value": 0} ], "Instance": "", "THRESHOLDENABLED": "true", "GRAPHID": "373", "type": "node", "thresholdImg": "images/thresholdConOK.gif", "suppressedMessage": "", "pollId": "446", "Protocol": "SNMP", "DISPLAYNAME": "CPU Utilization", "graphType": "node", "isSuppressed": "false", "policyName": "ProCurveCPUUtilization", "active": "true", "thresholdStatus": "Normal", "isMultiple": "false", "sSave": "true", "pollingStatus": "0", "lastCollectedTime": "8 Oct 2025 11:17:12 AM IST", "groupName": "default", "DisplayColumn": "", "name": "ProCurveCPUUtilization", "interval": "15", "numericType": "1", "Id": "446"}, { "YAXISTEXT": "Hours", "checkNumeric": "true", "data": [ { "instance": "-1", "value": 6959} ], "Instance": "", "THRESHOLDENABLED": "false", "GRAPHID": "1166", "type": "node", "thresholdImg": "images/thresholdNonConfigured.gif", "suppressedMessage": "", "pollId": "443", "Protocol": "SNMP", "DISPLAYNAME": "SysUpTime", "graphType": "node", "isSuppressed": "false", "policyName": "SysUpTime", "active": "true", "thresholdStatus": "Not Enabled", "isMultiple": "false", "sSave": "true", "pollingStatus": "0", "lastCollectedTime": "8 Oct 2025 11:17:12 AM IST", "groupName": "default", "DisplayColumn": "", "name": "SysUpTime", "interval": "15", "numericType": "1", "Id": "443"} ]}, "deviceProtocol": "SNMP", "serverMonitors":{ "total": 0, "down": 0, "monitors": []}, "urlMonitors":{ "total": 0, "statusIcon": "images/servicestatus5.gif", "down": 0, "monitors": []}, "showPollingStatusColumn": true, "eventlogMonitors":{ "period": "300", "total": 0, "statusIcon": "images/servicestatus5.gif", "isActive": "false", "down": 0, "monitors": []}, "isDCMEnabled": true, "scriptMonitors":{ "total": 0, "statusIcon": "images/servicestatus5.gif", "down": 0, "monitors": []}}
Rate limit: 500 requests per minute. Exceeding this limit will block requests for 1 minute

getPerformanceMonitors

Lists all the available performance monitors for a particular device (based on the device's category and type)

HTTP Method

GET

API URL

https://localhost:8060/api/json/device/getPerformanceMonitors?apiKey=***************

Parameters

Param NameDescriptionData TypeAdditional InformationIs Mandatory
apiKeyAPI Key to access your OpManager server.Yes
deviceNameName of the deviceString-Yes
categoryCategory of the device like Server, Desktop etcString Allowed Characters: Any characters except the following special symbols — ^ @ * & ! + ` % ( ) {}=\ < >$ [ ] ' " : , ;Yes
typeType of the device like Windows 2019String-Yes

Sample Response

HTTP Code: 200

{ "performanceMonitors": [ { "monitorId": "1", "monitorName": "CPU Utilization", "category": "System Performance"}, { "monitorId": "2", "monitorName": "Memory Utilization", "category": "System Performance"} ]}
Rate limit: 500 requests per minute. Exceeding this limit will block requests for 1 minute

getLastCollectedValues

Lists the last collected values of performance, application (AD, Exchange, and MSSQL) monitors, and script monitors for multiple devices.

HTTP Method

GET

API URL

https://localhost:8060/api/json/device/getLastCollectedValues?apiKey=***************&deviceMOIDList=1802,1804

Parameters

Param NameDescriptionData TypeAdditional InformationIs Mandatory
apiKeyAPI Key to access your OpManager server.Yes
deviceMOIDListMOID is the value of the 'moid' property in the listDevices API response. For multiple MOIDs, use comma-separated values. It is recommended to pass up to 500 device MOIDs.numbernumberWithCommaYes

Sample Response

HTTP Code: 200

{ "1802": [ { "NumericType": 1, "deviceName": "10.63.17.246", "ProtocolName": "WMI", "Description": "Monitors the Memory Utilization using WMI", "GraphName": "WMI-MemoryUtilization", "GraphTypeName": "multiple", "data": [ { "instance": "-1", "value": 32} ], "GraphId": 204, "PollId": 405, "OID": "Memory Utilization", "previousSeverity": 5, "YAxisText": "%", "lastCollectedTime": "23 Jan 2025 06:21:46 PM IST", "failureThreshold": 1, "PolicyName": "WMI-MemoryUtilization", "lastPolledCounterValue": 0, "DataType": "1", "failureCount": 0}, { "NumericType": 1, "deviceName": "10.63.17.246", "ProtocolName": "WMI", "Description": "Monitors the Disk Utilization using WMI", "GraphName": "WMI-DiskUtilization", "GraphTypeName": "multiple", "data": [ { "instance": "-1", "value": 93} ], "GraphId": 205, "PollId": 406, "OID": "Disk Utilization", "previousSeverity": 5, "YAxisText": "%", "lastCollectedTime": "23 Jan 2025 06:21:46 PM IST", "failureThreshold": 1, "PolicyName": "WMI-DiskUtilization", "lastPolledCounterValue": 0, "DataType": "1", "failureCount": 0}, { "NumericType": 1, "deviceName": "10.63.17.246", "ProtocolName": "WMI", "Description": "Monitoring the usage in each partition of the Device using WMI.", "GraphName": "WMI-PartitionDetails", "GraphTypeName": "multiplenode", "data": [ { "instance": "-1", "value": 93} ], "GraphId": 304, "PollId": 407, "OID": "Partition Details of the Device", "previousSeverity": 5, "YAxisText": "Percentage", "lastCollectedTime": "23 Jan 2025 06:21:46 PM IST", "failureThreshold": 1, "PolicyName": "WMI-PartitionDetails", "lastPolledCounterValue": 0, "DataType": "1", "failureCount": 0}, { "NumericType": 1, "deviceName": "10.63.17.246", "ProtocolName": "WMI", "Description": "The rate of IO Read and Write operations performed on the server", "GraphName": "WMIIOReadandWriteRate", "GraphTypeName": "node", "data": [ { "instance": "-1", "value": 11} ], "GraphId": 2233, "PollId": 408, "OID": "WMI IO Read and Write Rate", "previousSeverity": 5, "YAxisText": "Operations/Sec", "lastCollectedTime": "23 Jan 2025 06:21:46 PM IST", "failureThreshold": 1, "PolicyName": "WMIIOReadandWriteRate", "lastPolledCounterValue": 0, "DataType": "1", "failureCount": 0}, { "NumericType": 1, "deviceName": "10.63.17.246", "ProtocolName": "WMI", "Description": "Average time taken in milliseconds for a complete disk (read + write + transfer) operaton", "GraphName": "WMIAvgDiskLatency", "GraphTypeName": "node", "GraphId": 2227, "PollId": 409, "OID": "WMI Average Disk Latency", "previousSeverity": 5, "YAxisText": "MilliSeconds", "failureThreshold": 1, "PolicyName": "WMIAvgDiskLatency", "lastPolledCounterValue": 0, "DataType": "1", "failureCount": 0}, { "NumericType": 1, "deviceName": "10.63.17.246", "ProtocolName": "WMI", "Description": "Number of minutes the computer has been running after it was last started", "GraphName": "WMISystemUpTime", "GraphTypeName": "node", "data": [ { "instance": "-1", "value": 251982} ], "GraphId": 2245, "PollId": 410, "OID": "WMI System UpTime", "previousSeverity": 5, "YAxisText": "Minutes", "lastCollectedTime": "23 Jan 2025 06:21:53 PM IST", "failureThreshold": 1, "PolicyName": "WMISystemUpTime", "lastPolledCounterValue": 0, "DataType": "1", "failureCount": 0}, { "NumericType": 1, "deviceName": "10.63.17.246", "ProtocolName": "WMI", "Description": "Monitors the CPU Utilization using WMI", "GraphName": "WMI-CPUUtilization", "GraphTypeName": "multiple", "data": [ { "instance": "-1", "value": 2} ], "GraphId": 203, "PollId": 411, "OID": "CPU Utilization ProcessorInformation", "previousSeverity": 5, "YAxisText": "%", "lastCollectedTime": "23 Jan 2025 06:22:13 PM IST", "failureThreshold": 1, "PolicyName": "WMI-CPUUtilization", "lastPolledCounterValue": 0, "DataType": "1", "failureCount": 0} ], "1804": [ { "NumericType": 1, "deviceName": "server1.test.com", "ProtocolName": "WMI", "Description": "Monitors the Memory Utilization using WMI", "GraphName": "WMI-MemoryUtilization", "GraphTypeName": "multiple", "data": [ { "instance": "-1", "value": 81} ], "GraphId": 204, "PollId": 416, "OID": "Memory Utilization", "previousSeverity": 5, "YAxisText": "%", "lastCollectedTime": "23 Jan 2025 06:22:48 PM IST", "failureThreshold": 1, "PolicyName": "WMI-MemoryUtilization", "lastPolledCounterValue": 0, "DataType": "1", "failureCount": 0}, { "NumericType": 1, "deviceName": "server1.test.com", "ProtocolName": "WMI", "Description": "Monitoring the usage in each partition of the Device using WMI.", "GraphName": "WMI-PartitionDetails", "GraphTypeName": "multiplenode", "data": [ { "instance": "-1", "value": 92} ], "GraphId": 304, "PollId": 417, "OID": "Partition Details of the Device", "previousSeverity": 5, "YAxisText": "Percentage", "lastCollectedTime": "23 Jan 2025 06:22:48 PM IST", "failureThreshold": 1, "PolicyName": "WMI-PartitionDetails", "lastPolledCounterValue": 0, "DataType": "1", "failureCount": 0}, { "NumericType": 1, "deviceName": "server1.test.com", "ProtocolName": "WMI", "Description": "Monitoring the usage in each partition of the Device using WMI.", "GraphName": "WMI-PartitionDetails", "GraphTypeName": "multiplenode", "data": [ { "instance": "-1", "value": 22} ], "GraphId": 304, "PollId": 418, "OID": "Partition Details of the Device", "previousSeverity": 5, "YAxisText": "Percentage", "lastCollectedTime": "23 Jan 2025 06:22:48 PM IST", "failureThreshold": 1, "PolicyName": "WMI-PartitionDetails", "lastPolledCounterValue": 0, "DataType": "1", "failureCount": 0}, { "NumericType": 1, "deviceName": "server1.test.com", "ProtocolName": "WMI", "Description": "Monitoring the usage in each partition of the Device using WMI.", "GraphName": "WMI-PartitionDetails", "GraphTypeName": "multiplenode", "data": [ { "instance": "-1", "value": 87} ], "GraphId": 304, "PollId": 419, "OID": "Partition Details of the Device", "previousSeverity": 5, "YAxisText": "Percentage", "lastCollectedTime": "23 Jan 2025 06:22:48 PM IST", "failureThreshold": 1, "PolicyName": "WMI-PartitionDetails", "lastPolledCounterValue": 0, "DataType": "1", "failureCount": 0}, { "NumericType": 1, "deviceName": "server1.test.com", "ProtocolName": "WMI", "Description": "The rate of IO Read and Write operations performed on the server", "GraphName": "WMIIOReadandWriteRate", "GraphTypeName": "node", "data": [ { "instance": "-1", "value": 199974} ], "GraphId": 2233, "PollId": 420, "OID": "WMI IO Read and Write Rate", "previousSeverity": 5, "YAxisText": "Operations/Sec", "lastCollectedTime": "23 Jan 2025 06:22:49 PM IST", "failureThreshold": 1, "PolicyName": "WMIIOReadandWriteRate", "lastPolledCounterValue": 0, "DataType": "1", "failureCount": 0}, { "NumericType": 1, "deviceName": "server1.test.com", "ProtocolName": "WMI", "Description": "Average time taken in milliseconds for a complete disk (read + write + transfer) operaton", "GraphName": "WMIAvgDiskLatency", "GraphTypeName": "node", "GraphId": 2227, "PollId": 421, "OID": "WMI Average Disk Latency", "previousSeverity": 5, "YAxisText": "MilliSeconds", "failureThreshold": 1, "PolicyName": "WMIAvgDiskLatency", "lastPolledCounterValue": 0, "DataType": "1", "failureCount": 0}, { "NumericType": 1, "deviceName": "server1.test.com", "ProtocolName": "WMI", "Description": "Monitors the CPU Utilization using WMI", "GraphName": "WMI-CPUUtilization", "GraphTypeName": "multiple", "data": [ { "instance": "-1", "value": 6} ], "GraphId": 203, "PollId": 422, "OID": "CPU Utilization ProcessorInformation", "previousSeverity": 5, "YAxisText": "%", "lastCollectedTime": "23 Jan 2025 06:22:49 PM IST", "failureThreshold": 1, "PolicyName": "WMI-CPUUtilization", "lastPolledCounterValue": 0, "DataType": "1", "failureCount": 0}, { "NumericType": 1, "deviceName": "server1.test.com", "ProtocolName": "WMI", "Description": "Description", "GraphName": "Processor.PercentUserTime._Total", "GraphTypeName": "node", "GraphId": 5177, "PollId": 413, "OID": "Processor.PercentUserTime._Total", "previousSeverity": 5, "YAxisText": "Units", "failureThreshold": 1, "PolicyName": "Processor.PercentUserTime._Total", "lastPolledCounterValue": 0, "DataType": "1", "failureCount": 0}, { "NumericType": 1, "deviceName": "server1.test.com", "ProtocolName": "WMI", "Description": "Number of minutes the computer has been running after it was last started", "GraphName": "WMISystemUpTime", "GraphTypeName": "node", "data": [ { "instance": "-1", "value": 8505} ], "GraphId": 2245, "PollId": 414, "OID": "WMI System UpTime", "previousSeverity": 5, "YAxisText": "Minutes", "lastCollectedTime": "23 Jan 2025 06:22:49 PM IST", "failureThreshold": 1, "PolicyName": "WMISystemUpTime", "lastPolledCounterValue": 0, "DataType": "1", "failureCount": 0}, { "NumericType": 1, "deviceName": "server1.test.com", "ProtocolName": "WMI", "Description": "Monitors the Disk Utilization using WMI", "GraphName": "WMI-DiskUtilization", "GraphTypeName": "multiple", "data": [ { "instance": "-1", "value": 71} ], "GraphId": 205, "PollId": 415, "OID": "Disk Utilization", "previousSeverity": 5, "YAxisText": "%", "lastCollectedTime": "23 Jan 2025 06:22:48 PM IST", "failureThreshold": 1, "PolicyName": "WMI-DiskUtilization", "lastPolledCounterValue": 0, "DataType": "1", "failureCount": 0} ]}
Rate limit: 300 requests per minute. Exceeding this limit will block requests for 1 minute

getPerformanceMonitorDetails

Fetches detailed information about performance monitors for a specific device

HTTP Method

GET

API URL

https://localhost:8060/api/json/device/getPerformanceMonitorDetails?apiKey=***************&deviceName=devicename

Parameters

Param NameDescriptionData TypeAdditional InformationIs Mandatory
apiKeyAPI Key to access your OpManager server.Yes
nameName of the deviceString-Yes
policyNamePolicy name of the performance monitorStringGraphAndPolicyName:: value="^([^\*\^<>+,{}])+$"Yes
graphNameGraph name of the performance monitor.StringGraphAndPolicyName:: value="^([^\*\^<>+,{}])+$"No
pollIdPoll Id of the performance monitor.(We can use this pollId instead of graphName when its contains special characters)long-No
checkNumericType of monitor if it is Numeric Type it is should be true else falseBooleanYes
instanceNameWhen selected the MSSQL monitors, we have to give the instanceNameStringinstanceName :: Value=^([\p{L}\p{N}#$\_&]+)$No
instanceThis parameter is used for the Packet Loss(Packet_Loss) Monitor, Response Time(Device) Monitor and URL(Url) MonitorStringAllowed Values: The input must contain one of the following — Url,Device,Packet_LossNo
oidoid of the monitorString-No

Sample Response

HTTP Code: 200

{ "statsList": [ { "minimumValue": "84", "averageValue": "85", "instance": "PhysicalMemUtilization", "percentile": "85", "lastPolledValue": "86", "maximumValue": "86"} ], "monitors":{ "YAXISTEXT": "Percentage", "checkNumeric": "true", "Description": "Monitors the Memory Utilization using WMI", "Instance": "", "THRESHOLDENABLED": "true", "GRAPHID": "204", "oid": "Memory Utilization", "type": "multiple", "PREVIOUSSEVERITY": "5", "defaultMessage_AT": "$MONITOR is $CURRENTVALUE $UNITS,Expected value for this monitor is $EXPECTEDVALUE $UNITS, current adaptive threshold is $THRESHOLDVALUE $UNITS", "defaultMessage": "$MONITOR is $CURRENTVALUE%, threshold value for this monitor is $THRESHOLDVALUE%", "id": "125", "Protocol": "WMI", "FAILURETHRESHOLD": "1", "DISPLAYNAME": "Memory Utilization", "thresholdSet": [ { "severity": "2", "clrMessage": "$MONITOR is now back to normal, current value is $CURRENTVALUE $UNITS", "troubleThresholdType": "max", "troubleThresholdName": "1668514350868814042", "troubleMessage": "$MONITOR is $CURRENTVALUE $UNITS,Expected value for this monitor is $EXPECTEDVALUE $UNITS, current adaptive threshold is $THRESHOLDVALUE $UNITS", "oidType": "", "rearmValue": "0", "troubleThresholdValue": "15"}, { "severity": "1", "clrMessage": "$MONITOR is now back to normal, current value is $CURRENTVALUE $UNITS", "criticalThresholdName": "1668514350869567781", "criticalMessage": "$MONITOR is $CURRENTVALUE $UNITS,Expected value for this monitor is $EXPECTEDVALUE $UNITS, current adaptive threshold is $THRESHOLDVALUE $UNITS", "criticalThresholdValue": "20", "oidType": "", "rearmValue": "0", "isAtEnabled": true, "criticalThresholdType": "max"}, { "severity": "3", "clrMessage": "$MONITOR is now back to normal, current value is $CURRENTVALUE $UNITS", "warningThresholdName": "1668514350867431743", "warningMessage": "$MONITOR is $CURRENTVALUE $UNITS,Expected value for this monitor is $EXPECTEDVALUE $UNITS, current adaptive threshold is $THRESHOLDVALUE $UNITS", "warningThresholdType": "max", "oidType": "", "warningThresholdValue": "10", "rearmValue": "0", "isAtEnabled": true} ], "graphType": "multiple", "policyName": "WMI-MemoryUtilization", "agentName": "localhost", "isMultiple": "true", "sSave": "true", "defaultClrMessage": "$MONITOR is now back to normal, current value is $CURRENTVALUE%", "DisplayColumn": "", "name": "WMI-MemoryUtilization", "numericType": "1", "interval": "15", "Id": "125", "isAtEnabled": true}}
Rate limit: 500 requests per minute. Exceeding this limit will block requests for 1 minute

addPerformanceMonitors

Adds a new performance monitor (or multiple performance monitors) to the device

HTTP Method

POST

API URL

https://localhost:8060/api/json/device/addPerformanceMonitors?apiKey=***************&name=devicename&selectedMonitors=1166,3337,304,204,205,203,3327

Parameters

Param NameDescriptionData TypeAdditional InformationIs Mandatory
apiKeyAPI Key to access your OpManager server.String-Yes
nameName of the deviceString-Yes
selectedMonitorsGraphID of the performance monitor(s) to be added (multiple values separated by commas).String-Yes
processExistingPartitionMonitorsThis is required for processing the existing partition monitors. true(Existing partition monitors will be Process) false(Existing partition monitors will not be Process)Boolean-No
selectedPartitionsThis is required for adding the required PartitionsJSONObjectselectedPartitionsJSON ::{"GraphID":["Partition1","Partition2"]} Ex:-{"297":["C:","D:"],"298":["D:","E:"]}No

Sample Response

HTTP Code: 200

{ "result":{ "message": "Monitor added successfully"}}
Rate limit: 500 requests per minute. Exceeding this limit will block requests for 1 minute

deletePerformanceMonitors

Deletes performance monitor(s) from the device

HTTP Method

POST

API URL

https://localhost:8060/api/json/device/deletePerformanceMonitors?apiKey=***************&name=devicename&pollId=332,213

Parameters

Param NameDescriptionData TypeAdditional InformationIs Mandatory
apiKeyAPI Key to access your OpManager server.String-Yes
nameName of the deviceString-Yes
pollIdpollId of the performance monitor (multiple values separated by commas).NumbernumberWithCommaYes

Sample Response

HTTP Code: 200

{ "result":{ "message": "The monitor(s) will be deleted. Please check after sometime."}}
Rate limit: 500 requests per minute. Exceeding this limit will block requests for 1 minute

TestMonitor

Tests the connectivity and functionality of a specific monitor

HTTP Method

POST

API URL

https://localhost:8060/api/json/device/TestMonitor?apiKey=***************

Parameters

Param NameDescriptionData TypeAdditional InformationIs Mandatory
apiKeyAPI Key to access your OpManager server.Yes
nameName of the DeviceString-Yes
policyNameThe policy name for the performance monitor can be obtained from the graphName field in the response of the listPerformanceMonitors API StringAccepts any character except asterisk (*), caret (^), less-than (<), greater-than (>), plus (+), comma (,), curly braces ({}), with at least one character required. Yes
graphNameGraph name of the performance monitor. StringAccepts any character except asterisk (*), caret (^), less-than (<), greater-than (>), plus (+), comma (,), curly braces ({}), with at least one character required. No
pollIdPoll Id of the performance monitor.(We can use this pollId instead of graphName when its contains special characters) long- No
instanceNameWhen selected the MSSQL monitors, we have to give the instanceNameStringAllowed Characters: Unicode letters, numbers, hash (#), dollar ($), underscore (_), and ampersand (&) No
isPreTest(Internal Usage)Before addition of the monitor, if we want to test it, use this variableBoolean-No
preTestPollId(Internal Usage)Before addition of the monitor, if we want to test it, use this variable as temporary poll idlong-No
isAdditionalInfoNeeded(Internal Usage)To get the WMI/CLI commands corresponding to the monitorBoolean-No

Sample Response

HTTP Code: 200

{ "protocol": "SNMP", "checkNumeric": "true", "reasons": [], "monitorname": "Win-MemoryUtilization", "data": [ 89 ], "displayName": "Memory Utilization", "isMultiple": "false", "oid": ".1.3.6.1.2.1.25.5.1.1.2", "units": "Percentage", "deviceName": "localhost"}
Rate limit: 100 requests per minute. Exceeding this limit will block requests for 30 seconds

getAssociatedProcessMonitors

Fetches the list of process monitors that have been associated to a device

HTTP Method

GET

API URL

https://localhost:8060/api/json/device/getAssociatedProcessMonitors?apiKey=***************&deviceName=devicename

Parameters

Param NameDescriptionData TypeAdditional InformationIs Mandatory
apiKeyAPI Key to access your OpManager server.String-Yes
deviceNameName of the deviceString-Yes

Sample Response

HTTP Code: 200

{ "protocol": "WMI", "Templates": [ { "protocol": "CLI", "associatedDeviceCount": "0", "templateName": "httpd", "displayName": "httpd", "description": "Process Template for httpd", "templateId": "2"}, { "protocol": "WMI", "associatedDeviceCount": "2", "templateName": "sqlservr.exe", "displayName": "MSSQL", "description": "Process Template for MSSQL", "templateId": "1"} ], "AssignedMonitors": [ { "path": "C:\\Program Files\\Microsoft SQL Server\\MSSQL\\Binn\\sqlservr.exe", "statusStr": "Clear", "cmdLineArgs": "", "statusIcon": "/webclient/devices/images/servicestatus5.gif", "name": "MSSQL", "state": "1", "id": "611", "proName": "sqlservr.exe", "trimName": "MSSQL", "status": "5", "statusNum": "5"} ], "ActiveProcesses":{ "7244":{ "path": "C:\\Windows\\System32\\msdtc.exe", "trimArgs": "", "trimPath": "C:\\Windows\\System32\\msdtc.exe", "cmdLineArgs": "", "name": "msdtc.exe", "trimName": "msdtc.exe"}, "3680":{ "path": "C:\\Windows\\system32\\SearchIndexer.exe", "trimArgs": "/Embedding", "trimPath": "C:\\Windows\\system32\\SearchIndexer.exe", "cmdLineArgs": "/Embedding", "name": "SearchIndexer.exe", "trimName": "SearchIndexer.exe"}, "4692":{ "path": "-", "trimArgs": "", "trimPath": "-", "cmdLineArgs": "", "name": "csrss.exe", "trimName": "csrss.exe"}, "1473196":{ "path": "C:\\Program Files (x86)\\DesktopCentral_Agent\\appctrl\\bin\\DriverCtrl.exe", "trimArgs": " ", "trimPath": "C:\\Program Files (x86)\\DesktopCentral_Ag...", "cmdLineArgs": " ", "name": "DriverCtrl.exe", "trimName": "DriverCtrl.exe"}, "4652":{ "path": "C:\\Windows\\system32\\winlogon.exe", "trimArgs": "winlogon.exe", "trimPath": "C:\\Windows\\system32\\winlogon.exe", "cmdLineArgs": "winlogon.exe", "name": "winlogon.exe", "trimName": "winlogon.exe"}}, "deviceName": "localhost"}
Rate limit: 500 requests per minute. Exceeding this limit will block requests for 1 minute

associateProcessMonitor

Associates process monitor(s) to a device

HTTP Method

POST

API URL

https://localhost:8060/api/json/device/associateProcessMonitor?apiKey=***************&deviceName=devicename&processId=408,8,68&protocol=WMI

Parameters

Param NameDescriptionData TypeAdditional InformationIs Mandatory
apiKeyAPI Key to access your OpManager server.String-Yes
deviceNameName of the device.String-Yes
protocolProtocol of the device to associate for monitoringString of values WMI, CLI or SNMPAllowed Values: The input must contain one of the following — WMI, CLI,SNMPYes
processIdID of the processes that need to be associated (multiple values separated by commas)NumbernumberWithCommaYes

Sample Response

HTTP Code: 200

{ "result":{ "message": "Process monitor(s) associated successfully."}}
Rate limit: 500 requests per minute. Exceeding this limit will block requests for 1 minute

getAssociatedServiceMonitors

Fetches the list of service monitors that have been associated to a device

HTTP Method

GET

API URL

https://localhost:8060/api/json/device/getAssociatedServiceMonitors?apiKey=***************&name=devicename

Parameters

Param NameDescriptionData TypeAdditional InformationIs Mandatory
apiKeyAPI Key to access your OpManager server.String-Yes
nameName of the deviceString-Yes

Sample Response

HTTP Code: 200

{ "remainingServices": [ "DNS(53)", "Echo(7)", "FTP(21)" ], "selectedServices": [ "SMTP(25)", "Telnet(23)" ]}
Rate limit: 500 requests per minute. Exceeding this limit will block requests for 1 minute

associateServiceMonitor

Associates service monitor(s) to a device

HTTP Method

POST

API URL

https://localhost:8060/api/json/admin/associateServiceMonitor?apiKey=***************&deviceName=devicename&serviceName=DNS,FTP,Echo

Parameters

Param NameDescriptionData TypeAdditional InformationIs Mandatory
apiKeyAPI Key to access your OpManager server.String-Yes
deviceNameName of the device for which the service to be associated. Give the names by comma separated for bulk associationStringstringWithCommaYes
serviceNameName of the service(s) (multiple values separated by commas).StringstringWithCommaYes

Sample Response

HTTP Code: 200

{ "result":{ "message": "Service Monitor associated successfully"}}
Rate limit: 500 requests per minute. Exceeding this limit will block requests for 1 minute

getDeviceAssociatedWindowsServiceMonitors

Fetches the list of Windows service monitors associated to a device

HTTP Method

GET

API URL

https://localhost:8060/api/json/device/getDeviceAssociatedWindowsServiceMonitors?apiKey=***************&deviceName=devicename

Parameters

Param NameDescriptionData TypeAdditional InformationIs Mandatory
apiKeyAPI Key to access your OpManager server.String-Yes
deviceNameName of the deviceString-Yes

Sample Response

HTTP Code: 200

{ "windowsServiceMonitors": [ { "serviceName": "Spooler", "displayName": "Print Spooler", "status": "Running", "startupType": "Automatic"} ]}
Rate limit: 500 requests per minute. Exceeding this limit will block requests for 1 minute

listURLMonitors

Lists all URL monitors configured in the system

HTTP Method

GET

API URL

https://localhost:8060/api/json/device/listURLMonitors?apiKey=***************

Parameters

Param NameDescriptionData TypeAdditional InformationIs Mandatory
apiKeyAPI Key to access your OpManager server.String-Yes

Sample Response

HTTP Code: 200

{ "List": [ { "availPercentage": 0, "urlName": "Google", "statusStr": "Service Down", "name": "Google_URL", "RESPONSETIME": "No Response", "url": "http://www.google.com", "moID": 961, "statusNum": 4}, { "availPercentage": 0, "urlName": "HTTP Url", "statusStr": "Service Down", "name": "HTTP Url_URL", "RESPONSETIME": "No Response", "url": "http://localhost:8060", "moID": 996, "statusNum": 4}, { "availPercentage": 0, "urlName": "HTTPS Url", "statusStr": "Service Down", "name": "HTTPS Url_URL", "RESPONSETIME": "No Response", "url": "https://www.zoho.com", "moID": 997, "statusNum": 4} ], "Details":{ "00-10%": [ { "Status": 4, "Label": "Service Down", "Count": 6} ]}, "DialCounter": [ { "title": "Service Down", "value": 6, "status": 4} ]}
Rate limit: 500 requests per minute. Exceeding this limit will block requests for 1 minute

listAllDevicesSpecificURLs

Lists all URL monitors configured for specific devices

HTTP Method

GET

API URL

https://localhost:8060/api/json/device/listAllDevicesSpecificURLs?apiKey=***************

Parameters

Param NameDescriptionData TypeAdditional InformationIs Mandatory
apiKeyAPI Key to access your OpManager server.String-Yes

Sample Response

HTTP Code: 200

{ "List": [ { "parentName": "localhost", "urlName": "URL_1", "stringstatus": "Clear", "parentDispName": "localhost", "name": "URL_1_URL", "url": "https://google.com", "status": "5", "statusNum": "5"}, { "parentName": "localhost", "urlName": "URL_2", "stringstatus": "Clear", "parentDispName": "localhost", "name": "URL_2_URL", "url": "https://google.com", "status": "5", "statusNum": "5"} ]}
Rate limit: 500 requests per minute. Exceeding this limit will block requests for 1 minute

listScriptMonitors

Lists all script monitors configured in the system

HTTP Method

GET

API URL

https://localhost:8060/api/json/device/listScriptMonitors?apiKey=***************

Parameters

Param NameDescriptionData TypeAdditional InformationIs Mandatory
apiKeyAPI Key to access your OpManager server.String-Yes

Sample Response

HTTP Code: 200

[ { "graphName": "Cache Memory", "scriptID": "102", "executeFrom": "1", "graphDesc": "Perl Script to get cache memory of a linux system", "graphID": "1207"}, { "graphName": "File Size", "scriptID": "103", "executeFrom": "1", "graphDesc": "Shell script to get memory size of a file in linux system", "graphID": "1208"}, { "graphName": "Instance Count", "scriptID": "101", "executeFrom": "0", "graphDesc": "VBScript to get number of instances running for a given process", "graphID": "1206"}, { "graphName": "Thread Count", "scriptID": "104", "executeFrom": "0", "graphDesc": "Powershell script to get thread count of a process", "graphID": "1209"}
]
Rate limit: 40 requests per minute. Exceeding this limit will block requests for 1 minute

Network Path Analysis

getAvailabilityGraph

Retrieves the availability graph of a network path

HTTP Method

GET

API URL

http://localhost:8060/api/json/v2/pathanalysis/getAvailabilityGraph?apiKey=**************************&moID=901&period=Last 24 hours

Parameters

Param NameDescriptionData TypeAdditional InformationIs Mandatory
apiKeyAPI Key to access your OpManager server.String-Yes
moIDMOID of the Network pathLong-Yes
periodDefines the time range for which the availability graph data is requestedStringAllowed values: customDate, customTime, Today, Last 24 hours, YesterdayYes
datespecifies the specific date for the graph dataStringAllowed values: year-month-date
Allowed characters: year: any 4 digits, month: 01-12, date: 01-31, hyphen(-)
No

Sample Response

HTTP Code: 200

{ "availability": [ "UP,1760877460629,1760963860629,Up" ]}
Rate limit: 50 requests per minute. Exceeding this limit will block requests for 1 minute

getLatencyPacketLossGraph

Retrieves a graph showing latency and packet loss metrics for a network path

HTTP Method

GET

API URL

http://localhost:8060/api/json/v2/pathanalysis/getLatencyPacketLossGraph?apiKey=*******************&moID=901&period=Last 24 hours&instance=packetLoss

Parameters

Param NameDescriptionData TypeAdditional InformationIs Mandatory
apiKeyAPI Key to access your OpManager server.String-Yes
moIDMOID of the Network pathLong-Yes
perioddefines the time range for which the latency packet loss graph data is requestedStringAllowed values: customDate, customTime, Today, Last 24 hours, YesterdayYes
instanceInstance of Network path graphStringAllowed values: packetLoss, latencyYes
datespecifies the specific date for the graph dataStringAllowed values: year-month-date
Allowed characters: year: any 4 digits, month: 01-12, date: 01-31, hyphen(-)
No

Sample Response

HTTP Code: 200

{ "data":{ "chartData": [ { "seriesname": "Clear", "data": [ [ 1760963873115, 91.304 ], [ 1760964143707, 88.235 ] ]}, { "seriesname": "Attention", "data": []}, { "seriesname": "Trouble", "data": []}, { "seriesname": "Critical", "data": []} ], "xyTitles": [ "Time", "Packet Loss" ]}, "displayName": "Packet Loss"}
Rate limit: 100 requests per minute. Exceeding this limit will block requests for 1 minute

getPathwayGraph

Retrieves the graphical representation of a network path

HTTP Method

GET

API URL

https://localhost:8060/api/json/v2/pathanalysis/getPathwayGraph?apiKey=******************************&moID=901&period=Last 24 hours

Parameters

Param NameDescriptionData TypeAdditional InformationIs Mandatory
apiKeyAPI Key to access your OpManager server.String-Yes
moIDMOID of the Network PathLong-No
periodDefines the time range for which the pathway graph data is requestedStringAllowed values: customDate, customTime, Today, Last 24 hours, YesterdayYes
datespecifies the specific date for the graph dataStringAllowed values: year-month-date
Allowed characters: year: any 4 digits, month: 01-12, date: 01-31, hyphen(-)
No
timespecifies the exact timestamp for the graph data within the selected date or periodLong-No

Sample Response

HTTP Code: 200

{ "pathGraphTime": 1760701250092, "nodeDetails": [ { "nodeName": "10.6.6.132", "maxRTT": "4 ms", "avgRTT": "3.4 ms", "level": 9, "nodeDisplayName": "10.6.6.132", "minRTT": "3 ms", "geoLoaded": false, "ASName": "GOOGLE", "packetLossPercent": 13.636, "nodeLocation": "end", "destinationReachable": true, "status": "5"}, { "nodeName": "10.5.5.10", "maxRTT": "3 ms", "avgRTT": "1.6 ms", "level": 3, "nodeDisplayName": "10.5.5.10", "minRTT": "1 ms", "geoLoaded": false, "ASName": "Reserved AS", "packetLossPercent": 0, "nodeLocation": "intermediate", "status": "5"} ], "thresholdDetails":{}, "destinationUnreachablePaths": [], "paths":{ "1": [ "127.0.0.1:TimedOut_1", "TimedOut_1:10.5.5.10", "10.5.5.10:10.9.9.129", "10.9.9.129:10.4.4.182", "10.4.4.182:10.8.8.130", "10.8.8.130:10.7.7.135", "10.7.7.135:10.5.5.29", "10.5.5.29:10.6.6.132" ], "2": [ "127.0.0.1:TimedOut_1", "TimedOut_1:10.5.5.10", "10.5.5.10:10.9.9.129", "10.9.9.129:10.4.4.182", "10.4.4.182:10.8.8.130", "10.8.8.130:10.7.7.137", "10.7.7.137:10.5.5.35", "10.5.5.35:10.6.6.132" ]}, "networkPathDetails":{ "pathName": "networkpath-901", "pathDestinationPort": 443, "pathStatus": 5, "pathSource": "127.0.0.1", "pathSourceDisplayName": "localhost", "pathDestination": "www.google.com", "moID": 901, "pathDisplayName": "DemoNWPath"}, "hopVsPaths":{ "10.6.6.132": [ 1, 2, 3, 4, 5 ], "10.7.7.137": [ 2, 3 ]}, "pathDetails": [ { "maxRTT": "0 ms", "timeOutHopCount": "0", "avgRTT": "0.333 ms", "destination": "10.5.5.35", "source": "10.7.7.137", "minRTT": "1 ms", "geoLoaded": false, "ASName": "GOOGLE", "packetLossPercent": 0, "likelyPathCount": 40}, { "maxRTT": "2 ms", "timeOutHopCount": "0", "avgRTT": "0.556 ms", "destination": "10.5.5.35", "source": "10.6.6.135", "minRTT": "1 ms", "geoLoaded": false, "ASName": "GOOGLE", "packetLossPercent": 0, "likelyPathCount": 20} ]}
Rate limit: 50 requests per minute. Exceeding this limit will block requests for 1 minute

listNetworkPaths

Retrieves the list of configured network paths between devices

HTTP Method

GET

API URL

https://localhost:8060/api/json/v2/pathanalysis/listNetworkPaths?apiKey=*****************************

Parameters

Param NameDescriptionData TypeAdditional InformationIs Mandatory
apiKeyAPI Key to access your OpManager server.String-Yes
probeIDFilters Network Path by Probe IDLong-No

Sample Response

HTTP Code: 200

[ { "pathName": "DemoNWPath", "destinationPort": "443", "sourceDisplayName": "localhost", "managed": "true", "name": "networkpath-901", "source": "10.5.5.1", "destinationHost": "www.google.com", "moID": "901", "status": "5", "sourceManaged": ""}
]
Rate limit: 60 requests per minute. Exceeding this limit will block requests for 1 minute

Notifications

listNotificationProfiles

This API is used to list all the Notification Profiles created in OpManager.

HTTP Method

GET

API URL

https://localhost:8060/api/json/admin/listNotificationProfiles?apiKey=***************&isGlobal=true&profileFilter=All&deviceName=devicename

Parameters

Param NameDescriptionData TypeAllowed Values / RegexIs Mandatory
apiKeyAPI key used to authenticate and access your OpManager server.String-Yes
isGlobalBoolean flag indicating whether to fetch only global profiles.
true- Lists only global profiles.
false- Lists all device-specific profiles.
BooleanAllowed values: trueor falseNo
profileFilterSpecifies the filter used to list profiles based on the action type. StringAllowed values: All, Send Email, Send SMS, Run Program, Webhook, Log a Ticket, Chat, Send Trap, SyslogNo
deviceNameSpecifies the name of the device to check which global profiles are associated with it.
Can be retrieved using the API: listDevices.
If a profile is associated, the hasAssociatedfield in the response will be true.
String-No
groupNameSpecifies the name of the device group, if profiles are queried based on a specific group.
Can be retrieved using the API: listDeviceGroups.
StringAllowed values: Any valid device group name (supports alphanumeric text and symbols).No
profileAssociationTypeDefines the type of association between profiles and devices or groups.
Can be verified from the API response of listNotificationProfiles.
StringAllowed values: MANUAL, BY_DEVICE_GROUP, BY_INTERFACE_GROUPNo

Sample Response

HTTP Code: 200

[ { "profileName": "Play Sound", "hasSubProfiles": false, "profileType": "Run Program", "profileLabel": "Run Program", "profileID": "1", "hasCriteria": false, "isDevice": false, "status": "true"}, { "profileName": "testProfile", "hasSubProfiles": false, "profileType": "Send Email", "profileLabel": "Send Email", "profileID": "301", "isDevice": false, "hasAssociated": true, "status": "true"}
]
Rate limit: 50 requests per minute. Exceeding this limit will block requests for 5 minutes

associateNotificationProfiles

This API is used to associate notification profiles to devices.

HTTP Method

POST

API URL

https://localhost:8060/api/json/admin/associateNotificationProfiles?apiKey=***************&deviceName=devicename&profiles=501

Parameters

Param NameDescriptionData TypeAllowed Values / RegexIs Mandatory
apiKeyAPI Key to access your OpManager server.Yes
deviceNameName of the device(s) to which the notification profiles should be associated.
Can be retrieved using the API: listDevices.
StringAllowed values: Any valid device name as shown in the OpManager UI.Yes
groupNameSpecifies the name of the device group, if profiles are queried based on a specific group.
Can be retrieved using the API: listDeviceGroups.
StringAllowed values: Any valid device group name (supports alphanumeric text and symbols).No
profilesComma-separated list of Profile IDs to be associated.
Can be retrieved from the API: listNotificationProfiles.
StringAllowed values: Comma-separated numeric Profile IDs (e.g., 501,502,503).Yes

Sample Response

HTTP Code: 200

{ "result":{ "message": "Notification Profile has been associated successfully"}}
Rate limit: 50 requests per minute. Exceeding this limit will block requests for 5 minutes

updateNotificationProfileStatus

This API is used to enable/disable notification profiles. This API will be available from OpManager version 127189

HTTP Method

POST

API URL

https://localhost:8060/api/json/admin/updateNotificationProfileStatus?apiKey=***************&profileName=testprofile&profileId=301&status=disable

Parameters

Param NameDescriptionData TypeAllowed Values / RegexIs Mandatory
apiKeyAPI Key to access your OpManager server.Yes
profileNameName of the notification profile to be enabled or disabled.
Can be retrieved from the API: listNotificationProfiles.
String-Yes
profileIdID of the notification profile that needs to be enabled or disabled.
Can be retrieved from the API: listNotificationProfiles.
Long-Yes
statusAction to perform on the profile.StringAllowed values: enable or disableYes
deviceNameName of the device if the profile update is intended for a specific device.
Can be retrieved using the API: listDevices.
String-No
isTemplateBoolean flag indicating if the profile is a template-based configuration. BooleanAllowed values: true or false.No

Sample Response

HTTP Code: 200

{"message":"Notification Profile(s) enabled successfully"} or{"message":"Notification Profile(s) disabled successfully"}
Rate limit: 500requests per minute. Exceeding this limit will block requests for 5 minutes

getNotificationProfiles

This API is used to list notification profiles specific to the device.

HTTP Method

GET

API URL

https://localhost:8060/api/json/device/getNotificationProfiles?apiKey=***************&name=devicename

Parameters

Param NameDescriptionData TypeAllowed Values / RegexIs Mandatory
apiKeyAPI Key to access your OpManager server.Yes
nameName of the device for which the notification profiles need to be listed.
Can be retrieved using the API: listDevices.
StringAllowed values: Any valid device name as shown in the OpManager UI.Yes
groupNameSpecifies the name of the device group, if profiles are queried based on a specific group.
Can be retrieved using the API: listDeviceGroups.
StringAllowed values: Any valid device group name (supports alphanumeric text and symbols).No

Sample Response

HTTP Code: 200

[ { "profileName": "Default Notification Profile", "actionDisplayName": "Send Email", "profileLabel": "Send Email", "criteriaId": "301", "profileId": "601", "isGlobal": true, "actionName": "Send Email", "status": "true"}
]
Rate limit: 500 requests per minute. Exceeding this limit will block requests for 5 minutes

Reports

getAdvancedReportData

getAdvancedReportData functions based on lazy loading. When the first API call is made, it will give the count of the rows present in the report as a response. The subsequent API calls will bring the appropriate response based on the specified params.

HTTP Method

GET

API URL

https://<Host>:<port>/api/json/reports/getAdvancedReportData?getColumnDetails=true&reportID=901&apiKey=***********************************

Parameters

Param NameDescriptionData TypeAdditional InformationIs Mandatory
apiKeyAn apiKey enables you to access OpManager server.-apikeyYes
getColumnDetailsSpecify either true or false. booleanIf set to true, the response will include Report MetaData. If set to false, the response will return Report Data, based on the fetchFromRowNumber and rowsToFetch parameters.Yes
rowsToFetchNumber of Rows to Fetch -- range is from 1 to 1000int1-1000Yes if getColumnDetails is false
fetchFromRowNumberSpecifies the starting number of rows to fetch the data.int1-100000Yes if getColumnDetails is false
reportIdUnique and varies for each report, This ID can be fetched from listAdvancedReports APIlong-Yes
reportRequestIdIf this value is returned in the response of the first API call, it is recommended to use it for subsequent API calls related to the same report.long-No

Full Usage Example

  1. Make a call to listAllAdvancedReports API to get the reportId of the report you want to fetch.
  2. Make a call to getAdvancedReportData API to feth the report meta data - number of rows and the headers as shown below
  3. Fetch the report data in batches if the records are more than 1000. You can retrieve up to 1,000 records per API call.

API to fetch report metadata

https://<Host>:<port>/api/json/reports/getAdvancedReportData?getColumnDetails=true&reportID=901&apiKey=***********************************
Response
{ deviceNameIndex: 0 groupByCount: 0 groupHeader: [] headers: ["Device Name", "Status", "Availability (%)"] moduleId: "1" records: 4289 total: 86 totalColumns: 3}

API to fetch report data

As this report has 4289 records, 5 API calls should be made to fetch all the records as shown below

  1. https://<Host>:<port>/api/json/reports/getAdvancedReportData?fetchFromRowNumber=1&rowsToFetch=1000&reportId=901&apiKey=***********************************
  2. https://<Host>:<port>/api/json/reports/getAdvancedReportData?fetchFromRowNumber=1001&rowsToFetch=1000&reportId=901&apiKey=***********************************
  3. https://<Host>:<port>/api/json/reports/getAdvancedReportData?fetchFromRowNumber2001&rowsToFetch=1000&reportId=901&apiKey=***********************************
  4. https://<Host>:<port>/api/json/reports/getAdvancedReportData?fetchFromRowNumber=3001&rowsToFetch=1000&reportId=901&apiKey=***********************************
  5. https://<Host>:<port>/api/json/reports/getAdvancedReportData?fetchFromRowNumber=4001&rowsToFetch=1000&reportId=901&apiKey=***********************************

Sample Response

HTTP Code: 200

{"rows": [ { "Status": "Clear", "Availability (%)": "100", "name": "Desktop-3", "moName": "Desktop-3", "Device Name": "Desktop-3", "moid": 67802}, { "Status": "Clear", "Availability (%)": "85.574", "name": "Desktop-2", "moName": "Desktop-2", "Device Name": "Desktop-2", "moid": 69039}, { "Status": "Clear", "Availability (%)": "0", "name": "Desktop-1", "moName": "Desktop-1", "Device Name": "Desktop-1", "moid": 69046}, { "Status": "Clear", "Availability (%)": "85.576", "name": "Server-7", "moName": "Server-7", "Device Name": "Server-7", "moid": 69049}, { "Status": "Clear", "Availability (%)": "85.573", "name": "Server-6", "moName": "Server-6", "Device Name": "Server-6", "moid": 69047}, { "Status": "Clear", "Availability (%)": "85.573", "name": "Server-5", "moName": "Server-5", "Device Name": "Server-5", "moid": 69048}, { "Status": "Clear", "Availability (%)": "85.571", "name": "Server-4", "moName": "Server-4", "Device Name": "Server-4", "moid": 69041}, { "Status": "Clear", "Availability (%)": "85.575", "name": "Server-3", "moName": "Server-3", "Device Name": "Server-3", "moid": 69040}, { "Status": "Clear", "Availability (%)": "100", "name": "Server-2", "moName": "Server-2", "Device Name": "Server-2", "moid": 69022}, { "Status": "Clear", "Availability (%)": "100", "name": "Server-1", "moName": "Server-1", "Device Name": "Server-1", "moid": 69026} ], "headerKeyVsTypeMap":{ "Status": -9, "Availability (%)": 2, "name": 12, "Device Name": 12, "moid": -5}}
Rate limit: 60 requests per minute. Exceeding this limit will block requests for 1 minute

getReportsList

This API is to list all the reports

HTTP Method

GET

API URL

https://localhost:8060/api/json/reports/getReportsList?apiKey=***************&isFavouriteNeeded=true&hideintegratedReports=true&hideHardwareReport=true

Parameters

Param NameDescriptionData TypeAdditional InformationIs Mandatory
apiKeyAPI Key to access your OpManager server.StringapiKeyYes
isFavouriteNeededBoolean value to show favourites reports or not.boolean-No
hideintegratedReportsBoolean value to show integrated reports or not.boolean-No
hideHardwareReportBoolean value to show hardware report or not.boolean-No
isScheduleBoolean value to show Schedule report or not.boolean-No

Sample Response

HTTP Code: 200

"list": [
{
"customStatus": "False",
"displayName": "Notification Profiles Triggered",
"isCustom": "false",
"id": 6,
"url": "/reports/GenerateReports.do?firstTime=true&reportID=6",
"Name": "Notification Profiles Triggered",
"desc": "Get report of notification profiles triggered"},
{
"customStatus": "False",
"displayName": "Downtime Scheduler Log",
"isCustom": "false",
"id": 7,
"url": "/reports/GenerateReports.do?firstTime=true&reportID=7",
"Name": "Downtime Scheduler Log",
"desc": "Get report of downtime scheduler log"},
{
"customStatus": "False",
"displayName": "Schedule Reports Log",
"isCustom": "false",
"id": 8,
"url": "/reports/GenerateReports.do?firstTime=true&reportID=8",
"Name": "Schedule Reports Log",
"desc": "Get report of schedule reports log"},
{
"customStatus": "False",
"displayName": "All Down Events",
"isCustom": "false",
"id": 2,
"url": "/reports/GenerateReports.do?firstTime=true&reportID=2",
"Name": "All Down Events",
"desc": "Get report for all down events"},
{
"customStatus": "False",
"displayName": "All Alerts",
"isCustom": "false",
"id": 84,
"isFavourite": "True",
"url": "/reports/GenerateReports.do?firstTime=true&reportID=84",
"Name": "All Alerts",
"desc": "Get report for all alerts"},
{
"customStatus": "False",
"displayName": "All Events",
"isCustom": "false",
"id": 1,
"isFavourite": "True",
"url": "/reports/GenerateReports.do?firstTime=true&reportID=1",
"Name": "All Events",
"desc": "Get report for all events"},
{
"customStatus": "False",
"displayName": "All Down Alerts",
"isCustom": "false",
"id": 85,
"url": "/reports/GenerateReports.do?firstTime=true&reportID=85",
"Name": "All Down Alerts",
"desc": "Get report for all down alerts"},
{
"customStatus": "False",
"displayName": "SNMP Trap Log",
"isCustom": "false",
"id": 3,
"url": "/reports/GenerateReports.do?firstTime=true&reportID=3",
"Name": "SNMP Trap Log",
"desc": "Get SNMP trap log report"},
{
"customStatus": "False",
"displayName": "Windows Event Log",
"isCustom": "false",
"id": 4,
"url": "/reports/GenerateReports.do?firstTime=true&reportID=4",
"Name": "Windows Event Log",
"desc": "Get windows event log report"},
{
"customStatus": "False",
"displayName": "Performance Monitor Error Log",
"isCustom": "false",
"id": 5,
"url": "/reports/GenerateReports.do?firstTime=true&reportID=5",
"Name": "Performance Monitor Error Log",
"desc": "Get performance monitor error log report"},
{
"customStatus": "False",
"displayName": "All Alerts with Notes",
"isCustom": "false",
"id": 721,
"url": "/reports/GenerateReports.do?firstTime=true&reportID=721",
"Name": "All Alerts with Notes",
"desc": "Get report for all alerts with Notes"},
{
"customStatus": "False",
"displayName": "Top SysLog Count by Source",
"isCustom": "false",
"id": 95,
"url": "/reports/GenerateReports.do?firstTime=true&reportID=95",
"Name": "webclient.top.syslog.reports",
"desc": "Top N devices with most number of SysLogs"},
{
"customStatus": "False",
"displayName": "Top EventLog Count by Source",
"isCustom": "false",
"id": 94,
"url": "/reports/GenerateReports.do?firstTime=true&reportID=94",
"Name": "webclient.top.eventlog.reports",
"desc": "Top N devices with most number of EventLogs"},
{
"customStatus": "False",
"displayName": "Top Trap Count by Source",
"isCustom": "false",
"id": 93,
"url": "/reports/GenerateReports.do?firstTime=true&reportID=93",
"Name": "webclient.top.trap.reports",
"desc": "Top N devices with most number of Traps"},
{
"customStatus": "False",
"displayName": "Suppressed Devices",
"isCustom": "false",
"id": 92,
"url": "/reports/GenerateReports.do?firstTime=true&reportID=92",
"Name": "webclient.suppress.devices.reports",
"desc": "Get report for suppressed devices"},
{
"customStatus": "False",
"displayName": "DataCollection Error Logs",
"isCustom": "false",
"id": 151,
"url": "/reports/GenerateReports.do?firstTime=true&reportID=151",
"Name": "widget.name.dataCollectionLog",
"desc": "Get datacollection failure details"},
{
"customStatus": "False",
"displayName": "Active Alerts",
"isCustom": "false",
"id": 149,
"url": "/reports/GenerateReports.do?firstTime=true&reportID=149",
"Name": "webclient.report.name.activealarms",
"desc": "Get report for active alerts"},
{
"customStatus": "False",
"displayName": "Workflow Logs",
"isCustom": "false",
"id": 90,
"url": "/reports/GenerateReports.do?firstTime=true&reportID=90",
"Name": "Workflow Logs",
"desc": "Workflow logs report"},
{
"customStatus": "False",
"displayName": "Syslog Events",
"isCustom": "false",
"id": 88,
"url": "/reports/GenerateReports.do?firstTime=true&reportID=88",
"Name": "Syslog Events",
"desc": "Get Syslog events report "},
{
"displayName": "DataCollection Error Logs for N Consecutive Time(s)",
"id": "ServerHealthReport",
"desc": "Get datacollection failure details for N consecutive times"},
{
"displayName": "Audit Report",
"id": "Audit",
"url": "/reports/AuditReport.do",
"desc": "Audit Report"}
],
"title": ""}
],
"Name": "System"},
{
"displayName": "Health and Performance",
"list": [
{
"list": [
{
"customStatus": "True",
"displayName": "Servers by Rx Utilization",
"isCustom": "true",
"id": 28,
"url": "/reports/GenerateReports.do?firstTime=true&reportID=28",
"Name": "Servers by Rx Utilization",
"desc": "Identify servers with heavy incoming traffic utilization"},
{
"customStatus": "True",
"displayName": "Servers by Tx Utilization",
"isCustom": "true",
"id": 29,
"url": "/reports/GenerateReports.do?firstTime=true&reportID=29",
"Name": "Servers by Tx Utilization",
"desc": "Identify servers with heavy outgoing traffic utilization"},
{
"customStatus": "True",
"displayName": "Volumes with Least Free Space",
"isCustom": "true",
"id": 30,
"url": "/reports/GenerateReports.do?firstTime=true&reportID=30",
"Name": "Volumes with Least Free Space",
"desc": "Identify disk partitions with least free space"},
{
"customStatus": "True",
"displayName": "Volumes with Most Free Space",
"isCustom": "true",
"id": 31,
"url": "/reports/GenerateReports.do?firstTime=true&reportID=31",
"Name": "Volumes with Most Free Space",
"desc": "Identify disk partitions with most free space"},
{
"customStatus": "True",
"displayName": "All Servers Disk Usage Report",
"isCustom": "true",
"id": 32,
"url": "/reports/GenerateReports.do?firstTime=true&reportID=32",
"Name": "All Servers Disk Usage Report",
"desc": "Get partition wise disk usage report for all servers"},
{
"customStatus": "True",
"displayName": "Routers Health Report",
"isCustom": "true",
"id": 33,
"url": "/reports/GenerateReports.do?firstTime=true&reportID=33",
"Name": "Routers Health Report",
"desc": "Get health report of routers"},
{
"customStatus": "True",
"displayName": "Routers by CPU Utilization",
"isCustom": "true",
"id": 34,
"url": "/reports/GenerateReports.do?firstTime=true&reportID=34",
"Name": "Routers by CPU Utilization",
"desc": "Identify busy routers with high CPU Utilization"},
{
"customStatus": "True",
"displayName": "Routers by Memory Utilization",
"isCustom": "true",
"id": 35,
"url": "/reports/GenerateReports.do?firstTime=true&reportID=35",
"Name": "Routers by Memory Utilization",
"desc": "Identify overloaded routers with high Memory Utilization"},
{
"customStatus": "True",
"displayName": "Router Interfaces by Rx Traffic",
"isCustom": "true",
"id": 36,
"url": "/reports/GenerateReports.do?firstTime=true&reportID=36",
"Name": "Router Interfaces by Rx Traffic",
"desc": "Identify interfaces with heavy incoming traffic"},
{
"customStatus": "True",
"displayName": "Router Interfaces by Tx Traffic",
"isCustom": "true",
"id": 37,
"url": "/reports/GenerateReports.do?firstTime=true&reportID=37",
"Name": "Router Interfaces by Tx Traffic",
"desc": "Identify interfaces with heavy outgoing traffic"},
{
"customStatus": "True",
"displayName": "Router Interfaces by Rx Errors",
"isCustom": "true",
"id": 38,
"url": "/reports/GenerateReports.do?firstTime=true&reportID=38",
"Name": "Router Interfaces by Rx Errors",
"desc": "Identify interfaces with high incoming errors"},
{
"customStatus": "True",
"displayName": "Router Interfaces by Tx Errors",
"isCustom": "true",
"id": 39,
"url": "/reports/GenerateReports.do?firstTime=true&reportID=39",
"Name": "Router Interfaces by Tx Errors",
"desc": "Identify interfaces with high incoming errors"},
{
"customStatus": "True",
"displayName": "Router Interfaces by Rx Utilization",
"isCustom": "true",
"id": 40,
"url": "/reports/GenerateReports.do?firstTime=true&reportID=40",
"Name": "Router Interfaces by Rx Utilization",
"desc": "Identify interfaces with high % Receive utilization"},
{
"customStatus": "True",
"displayName": "Router Interfaces by Tx Utilization",
"isCustom": "true",
"id": 41,
"url": "/reports/GenerateReports.do?firstTime=true&reportID=41",
"Name": "Router Interfaces by Tx Utilization",
"desc": "Identify interfaces with high % Transmit utilization"},
{
"customStatus": "True",
"displayName": "Switches Health Report",
"isCustom": "true",
"id": 42,
"url": "/reports/GenerateReports.do?firstTime=true&reportID=42",
"Name": "Switches Health Report",
"desc": "Get health report of switches"},
{
"customStatus": "True",
"displayName": "Ports by Rx Traffic",
"isCustom": "true",
"id": 43,
"url": "/reports/GenerateReports.do?firstTime=true&reportID=43",
"Name": "Ports by Rx Traffic",
"desc": "Identify ports with heavy incoming traffic"},
{
"customStatus": "True",
"displayName": "Ports by Tx Traffic",
"isCustom": "true",
"id": 44,
"url": "/reports/GenerateReports.do?firstTime=true&reportID=44",
"Name": "Ports by Tx Traffic",
"desc": "Identify ports with heavy outgoing traffic"},
{
"customStatus": "True",
"displayName": "Ports by Rx Errors",
"isCustom": "true",
"id": 45,
"url": "/reports/GenerateReports.do?firstTime=true&reportID=45",
"Name": "Ports by Rx Errors",
"desc": "Identify ports with most Receive errors"},
{
"customStatus": "True",
"displayName": "Ports by Tx Errors",
"isCustom": "true",
"id": 46,
"url": "/reports/GenerateReports.do?firstTime=true&reportID=46",
"Name": "Ports by Tx Errors",
"desc": "Identify ports with most Transmit errors"},
{
"customStatus": "True",
"displayName": "Ports by Tx Utilization",
"isCustom": "true",
"id": 48,
"url": "/reports/GenerateReports.do?firstTime=true&reportID=48",
"Name": "Ports by Tx Utilization",
"desc": "Identify ports with high % Transmit utilization"},
{
"customStatus": "True",
"displayName": "DCs by CPU Utilization",
"isCustom": "true",
"id": 49,
"url": "/reports/GenerateReports.do?firstTime=true&reportID=49",
"Name": "DCs by CPU Utilization",
"desc": "Identify busy DCs with high CPU Utilization"},
{
"customStatus": "True",
"displayName": "DCs by Memory Utilization",
"isCustom": "true",
"id": 50,
"url": "/reports/GenerateReports.do?firstTime=true&reportID=50",
"Name": "DCs by Memory Utilization",
"desc": "Identify overloaded DCs with high Memory Utilization"},
{
"customStatus": "True",
"displayName": "DCs by Disk Utilization",
"isCustom": "true",
"id": 51,
"url": "/reports/GenerateReports.do?firstTime=true&reportID=51",
"Name": "DCs by Disk Utilization",
"desc": "Identify overloaded DCs with high Disk Utilization"},
{
"customStatus": "True",
"displayName": "Ports by Rx Utilization",
"isCustom": "true",
"id": 47,
"url": "/reports/GenerateReports.do?firstTime=true&reportID=47",
"Name": "Ports by Rx Utilization",
"desc": "Identify ports with high % Receive utilization"},
{
"customStatus": "False",
"displayName": "Health Report",
"isCustom": "false",
"id": 9,
"url": "/reports/GenerateReports.do?firstTime=true&reportID=9",
"Name": "Health Report",
"desc": "Get health report of all devices"},
{
"customStatus": "False",
"displayName": "Devices by CPU Utilization",
"isCustom": "false",
"id": 10,
"url": "/reports/GenerateReports.do?firstTime=true&reportID=10",
"Name": "Devices by CPU Utilization",
"desc": "Identify overloaded devices with high CPU Utilization"},
{
"customStatus": "False",
"displayName": "Devices by Memory Utilization",
"isCustom": "false",
"id": 11,
"url": "/reports/GenerateReports.do?firstTime=true&reportID=11",
"Name": "Devices by Memory Utilization",
"desc": "Identify overloaded devices with high Memory Utilization"},
{
"customStatus": "False",
"displayName": "Devices by Disk Utilization",
"isCustom": "false",
"id": 12,
"url": "/reports/GenerateReports.do?firstTime=true&reportID=12",
"Name": "Devices by Disk Utilization",
"desc": "Identify overloaded devices with high Disk Utilization"},
{
"customStatus": "False",
"displayName": "Disk Usage by Drives",
"isCustom": "false",
"id": 13,
"url": "/reports/GenerateReports.do?firstTime=true&reportID=13",
"Name": "Disk Usage by Drives",
"desc": "Identify overloaded devices with high Disk Utilization by drives"},
{
"customStatus": "False",
"displayName": "All Interfaces by Utilization",
"isCustom": "false",
"id": 14,
"url": "/reports/GenerateReports.do?firstTime=true&reportID=14",
"Name": "All Interfaces by Utilization",
"desc": "Identify devices with heavy traffic utilization"},
{
"customStatus": "False",
"displayName": "WAN Links by Utilization",
"isCustom": "false",
"id": 15,
"isFavourite": "True",
"url": "/reports/GenerateReports.do?firstTime=true&reportID=15",
"Name": "WAN Links by Utilization",
"desc": "Identify WAN links with heavy traffic utilization"},
{
"customStatus": "False",
"displayName": "Interfaces by Rx Traffic",
"isCustom": "false",
"id": 16,
"url": "/reports/GenerateReports.do?firstTime=true&reportID=16",
"Name": "Interfaces by Rx Traffic",
"desc": "Identify devices with heavy incoming traffic"},
{
"customStatus": "False",
"displayName": "Interfaces by Tx Traffic",
"isCustom": "false",
"id": 17,
"url": "/reports/GenerateReports.do?firstTime=true&reportID=17",
"Name": "Interfaces by Tx Traffic",
"desc": "Identify devices with heavy outgoing traffic"},
{
"customStatus": "False",
"displayName": "Interfaces by Rx Utilization",
"isCustom": "false",
"id": 18,
"url": "/reports/GenerateReports.do?firstTime=true&reportID=18",
"Name": "Interfaces by Rx Utilization",
"desc": "Identify devices with heavy incoming traffic utilization"},
{
"customStatus": "False",
"displayName": "Interfaces by Tx Utilization",
"isCustom": "false",
"id": 19,
"url": "/reports/GenerateReports.do?firstTime=true&reportID=19",
"Name": "Interfaces by Tx Utilization",
"desc": "Identify devices with heavy outgoing traffic utilization"},
{
"customStatus": "False",
"displayName": "Interfaces by Rx Errors",
"isCustom": "false",
"id": 20,
"url": "/reports/GenerateReports.do?firstTime=true&reportID=20",
"Name": "Interfaces by Rx Errors",
"desc": "Identify interfaces with high incoming errors"},
{
"customStatus": "False",
"displayName": "Interfaces by Tx Errors",
"isCustom": "false",
"id": 21,
"url": "/reports/GenerateReports.do?firstTime=true&reportID=21",
"Name": "Interfaces by Tx Errors",
"desc": "Identify interfaces with high outgoing errors"},
{
"customStatus": "True",
"displayName": "Servers Health Report",
"isCustom": "true",
"id": 22,
"isFavourite": "True",
"url": "/reports/GenerateReports.do?firstTime=true&reportID=22",
"Name": "Servers Health Report",
"desc": "Get health report of servers"},
{
"customStatus": "True",
"displayName": "Servers by CPU Utilization",
"isCustom": "true",
"id": 23,
"url": "/reports/GenerateReports.do?firstTime=true&reportID=23",
"Name": "Servers by CPU Utilization",
"desc": "Identify busy servers with high CPU Utilization"},
{
"customStatus": "True",
"displayName": "Servers by Memory Utilization",
"isCustom": "true",
"id": 24,
"url": "/reports/GenerateReports.do?firstTime=true&reportID=24",
"Name": "Servers by Memory Utilization",
"desc": "Identify overloaded servers with high Memory Utilization"},
{
"customStatus": "True",
"displayName": "Servers by Disk Utilization",
"isCustom": "true",
"id": 25,
"url": "/reports/GenerateReports.do?firstTime=true&reportID=25",
"Name": "Servers by Disk Utilization",
"desc": "Identify overloaded servers with high Disk Utilization"},
{
"customStatus": "True",
"displayName": "Servers by Rx Traffic",
"isCustom": "true",
"id": 26,
"url": "/reports/GenerateReports.do?firstTime=true&reportID=26",
"Name": "Servers by Rx Traffic",
"desc": "Identify servers with heavy incoming traffic"},
{
"customStatus": "True",
"displayName": "Servers by Tx Traffic",
"isCustom": "true",
"id": 27,
"url": "/reports/GenerateReports.do?firstTime=true&reportID=27",
"Name": "Servers by Tx Traffic",
"desc": "Identify servers with heavy outgoing traffic"},
{
"customStatus": "True",
"displayName": "All Interfaces By Traffic",
"isCustom": "true",
"id": 81,
"url": "/reports/GenerateReports.do?firstTime=true&reportID=81",
"Name": "All Interfaces By Traffic",
"desc": "Get traffic report of all interfaces"},
{
"customStatus": "True",
"displayName": "Volumes With Low Disk Utilization",
"isCustom": "true",
"id": 82,
"url": "/reports/GenerateReports.do?firstTime=true&reportID=82",
"Name": "Volumes With Low Disk Utilization",
"desc": "Identify volumes with low disk utilization"},
{
"customStatus": "True",
"displayName": "Volumes With High Disk Utilization",
"isCustom": "true",
"id": 83,
"url": "/reports/GenerateReports.do?firstTime=true&reportID=83",
"Name": "Volumes With High Disk Utilization",
"desc": "Identify volumes with high disk utilization"},
{
"customStatus": "False",
"displayName": "Top N Errors And Discards",
"isCustom": "false",
"id": 86,
"url": "/reports/GenerateReports.do?firstTime=true&reportID=86",
"Name": "Top N Errors And Discards",
"desc": "Identify interfaces with high errors and discards"},
{
"customStatus": "False",
"displayName": "Interfaces By TotalBytes Transfered",
"isCustom": "false",
"id": 89,
"url": "/reports/GenerateReports.do?firstTime=true&reportID=89",
"Name": "Interfaces By TotalBytes Transfered",
"desc": "Identify interfaces with high total bytes transfered"},
{
"customStatus": "False",
"displayName": "Hardware Health Report",
"isCustom": "false",
"id": 142,
"url": "/reports/GenerateReports.do?firstTime=true&reportID=142",
"Name": "webclient.reports.hardware.title",
"desc": "Get Hardware Health Report"},
{
"customStatus": "True",
"displayName": "Processes by CPU Utilization",
"isCustom": "true",
"id": 144,
"url": "/reports/GenerateReports.do?firstTime=true&reportID=144",
"Name": "Processes by CPU Utilization",
"desc": "Identify processes with high CPU Utilization"},
{
"customStatus": "True",
"displayName": "Processes by Memory Utilization",
"isCustom": "true",
"id": 145,
"url": "/reports/GenerateReports.do?firstTime=true&reportID=145",
"Name": "Processes by Memory Utilization",
"desc": "Identify processes with high Memory Utilization"},
{
"customStatus": "True",
"displayName": "Processes by Absolute Memory",
"isCustom": "true",
"id": 148,
"url": "/reports/GenerateReports.do?firstTime=true&reportID=148",
"Name": "Processes by Absolute Memory",
"desc": "Identify absolute memory value of the Process"},
{
"customStatus": "False",
"displayName": "Flap Count Summary",
"isCustom": "false",
"id": 768,
"url": "/reports/GenerateReports.do?firstTime=true&reportID=768",
"Name": "webclient.bgp.title.flapCount",
"desc": "Get Flap Count Summary for BGP Peers"},
{
"customStatus": "False",
"displayName": "Flap Summary",
"isCustom": "false",
"id": 769,
"url": "/reports/GenerateReports.do?firstTime=true&reportID=769",
"Name": "webclient.bgp.title.flapSummary",
"desc": "Flap Summary for each BGP Peers"},
{
"customStatus": "False",
"displayName": "Devices with Performance Monitors",
"isCustom": "false",
"id": 772,
"url": "/reports/GenerateReports.do?firstTime=true&reportID=772",
"Name": "webclient.perf.monitors.report",
"desc": "Get report for devices with Perforamance monitors"},
{
"customStatus": "False",
"displayName": "Devices with File Monitors",
"isCustom": "false",
"id": 773,
"url": "/reports/GenerateReports.do?firstTime=true&reportID=773",
"Name": "webclient.file.monitors.report",
"desc": "Get report for devices with File monitors"},
{
"customStatus": "False",
"displayName": "Devices with Folder Monitors",
"isCustom": "false",
"id": 774,
"url": "/reports/GenerateReports.do?firstTime=true&reportID=774",
"Name": "webclient.folder.monitors.report",
"desc": "Get report for devices with Folder monitors"},
{
"customStatus": "False",
"displayName": "Devices with Process Monitors",
"isCustom": "false",
"id": 775,
"url": "/reports/GenerateReports.do?firstTime=true&reportID=775",
"Name": "webclient.process.monitors.report",
"desc": "Get report for devices with Process monitors"},
{
"customStatus": "False",
"displayName": "Devices with AD Monitors",
"isCustom": "false",
"id": 776,
"url": "/reports/GenerateReports.do?firstTime=true&reportID=776",
"Name": "webclient.AD.monitors.report",
"desc": "Get report for devices with AD monitors"},
{
"customStatus": "False",
"displayName": "Devices with Exchange Monitors",
"isCustom": "false",
"id": 777,
"url": "/reports/GenerateReports.do?firstTime=true&reportID=777",
"Name": "webclient.exchange.monitors.report",
"desc": "Get report for devices with Exchange monitors"},
{
"customStatus": "False",
"displayName": "Devices with MSSQL Monitors",
"isCustom": "false",
"id": 778,
"url": "/reports/GenerateReports.do?firstTime=true&reportID=778",
"Name": "webclient.mssql.monitors.report",
"desc": "Get report for devices with MSSQL monitors"},
{
"customStatus": "False",
"displayName": "Devices with AD Service Monitors",
"isCustom": "false",
"id": 779,
"url": "/reports/GenerateReports.do?firstTime=true&reportID=779",
"Name": "webclient.ADService.monitors.report",
"desc": "Get report for devices with AD Service monitors"},
{
"customStatus": "False",
"displayName": "Devices with MSSQL Service Monitors",
"isCustom": "false",
"id": 780,
"url": "/reports/GenerateReports.do?firstTime=true&reportID=780",
"Name": "webclient.mssqlservice.monitors.report",
"desc": "Get report for devices with MSSQL Service monitors"},
{
"customStatus": "False",
"displayName": "Devices with Exchange Service Monitors",
"isCustom": "false",
"id": 781,
"url": "/reports/GenerateReports.do?firstTime=true&reportID=781",
"Name": "webclient.exchangeservice.monitors.report",
"desc": "Get report for devices with Exchange Service monitors"},
{
"customStatus": "False",
"displayName": "Devices with NT Service Monitors",
"isCustom": "false",
"id": 782,
"url": "/reports/GenerateReports.do?firstTime=true&reportID=782",
"Name": "webclient.ntservice.monitors.report",
"desc": "Get report for devices with NT Service monitors"},
{
"customStatus": "False",
"displayName": "Devices with URL Monitors",
"isCustom": "false",
"id": 783,
"url": "/reports/GenerateReports.do?firstTime=true&reportID=783",
"Name": "webclient.url.monitors.report",
"desc": "Get report for devices with URL monitors"},
{
"customStatus": "False",
"displayName": "Devices with Service Monitors",
"isCustom": "false",
"id": 784,
"url": "/reports/GenerateReports.do?firstTime=true&reportID=784",
"Name": "webclient.service.monitors.report",
"desc": "Get report for devices with Service monitors"},
{
"customStatus": "False",
"displayName": "VPN Summary",
"isCustom": "false",
"id": 895,
"url": "/reports/GenerateReports.do?firstTime=true&reportID=895",
"Name": "webclient.opm.reports.vpnSummary",
"desc": "Get summary report for Site-to-Site VPN devices."}
],
"title": ""}
],
"Name": "Health and Performance"},
{
"displayName": "Availability and Response",
"list": [
{
"list": [
{
"customStatus": "True",
"displayName": "SMTP Servers by Response Time",
"isCustom": "true",
"id": 65,
"url": "/reports/GenerateReports.do?firstTime=true&reportID=65",
"Name": "SMTP Servers by Response Time",
"desc": "Identify SMTP servers with high Response Time"},
{
"customStatus": "True",
"displayName": "Process Monitors Availability",
"isCustom": "true",
"id": 146,
"url": "/reports/GenerateReports.do?firstTime=true&reportID=146",
"Name": "Process Monitors Availability",
"desc": "Get availability report for all process monitors"},
{
"customStatus": "True",
"displayName": "Windows Service Monitors Availability",
"isCustom": "true",
"id": 147,
"url": "/reports/GenerateReports.do?firstTime=true&reportID=147",
"Name": "Windows Service Monitors Availability",
"desc": "Get availability report for all windows service monitors"},
{
"customStatus": "True",
"displayName": "HTTP Servers by Response Time",
"isCustom": "true",
"id": 64,
"url": "/reports/GenerateReports.do?firstTime=true&reportID=64",
"Name": "HTTP Servers by Response Time",
"desc": "Identify Web servers with high Response Time"},
{
"customStatus": "False",
"displayName": "Devices by Packet Loss",
"isCustom": "false",
"id": 58,
"url": "/reports/GenerateReports.do?firstTime=true&reportID=58",
"Name": "Devices by Packet Loss",
"desc": "Identify devices with high packet loss"},
{
"customStatus": "False",
"displayName": "Devices by Response Time",
"isCustom": "false",
"id": 57,
"url": "/reports/GenerateReports.do?firstTime=true&reportID=57",
"Name": "Devices by Response Time",
"desc": "Identify devices with high response time"},
{
"customStatus": "True",
"displayName": "Web Servers Availability",
"isCustom": "true",
"id": 63,
"url": "/reports/GenerateReports.do?firstTime=true&reportID=63",
"Name": "Web Servers Availability",
"desc": "Get availability report for all web servers"},
{
"customStatus": "False",
"displayName": "WAN Links Availability",
"isCustom": "false",
"id": 54,
"isFavourite": "True",
"url": "/reports/GenerateReports.do?firstTime=true&reportID=54",
"Name": "WAN Links Availability",
"desc": "Get availability report for all interfaces"},
{
"customStatus": "False",
"displayName": "All Interfaces Availability",
"isCustom": "false",
"id": 87,
"isFavourite": "True",
"url": "/reports/GenerateReports.do?firstTime=true&reportID=87",
"Name": "All Interfaces Availability",
"desc": "Get availability report for all interfaces"},
{
"customStatus": "False",
"displayName": "URLs Availability",
"isCustom": "false",
"id": 55,
"url": "/reports/GenerateReports.do?firstTime=true&reportID=55",
"Name": "URLs Availability",
"desc": "Get availability report for all URLs"},
{
"customStatus": "False",
"displayName": "Service Monitors Availability",
"isCustom": "false",
"id": 56,
"isFavourite": "True",
"url": "/reports/GenerateReports.do?firstTime=true&reportID=56",
"Name": "Service Monitors Availability",
"desc": "Get availability report for all service monitors"},
{
"customStatus": "True",
"displayName": "DCs Availability Report",
"isCustom": "true",
"id": 62,
"url": "/reports/GenerateReports.do?firstTime=true&reportID=62",
"Name": "DCs Availability Report",
"desc": "Get availability report for all DCs"},
{
"customStatus": "True",
"displayName": "Servers Availability Report",
"isCustom": "true",
"id": 61,
"url": "/reports/GenerateReports.do?firstTime=true&reportID=61",
"Name": "Servers Availability Report",
"desc": "Get availability report for all services"},
{
"customStatus": "False",
"displayName": "Devices Availability",
"isCustom": "false",
"id": 52,
"url": "/reports/GenerateReports.do?firstTime=true&reportID=52",
"Name": "Devices Availability",
"desc": "Get availability report for all devices"},
{
"customStatus": "False",
"displayName": "Devices Availability Dashboard",
"isCustom": "false",
"id": 53,
"url": "/reports/GenerateReports.do?firstTime=true&reportID=53",
"Name": "Devices Availability Dashboard",
"desc": "Get availability report for all devices"},
{
"customStatus": "False",
"displayName": "DownTime Report For Interfaces",
"isCustom": "false",
"id": 724,
"url": "/reports/GenerateReports.do?firstTime=true&reportID=724",
"Name": "DownTime Report For Interfaces",
"desc": "DownTime history for all interfaces"},
{
"customStatus": "False",
"displayName": "Services by Response Time",
"isCustom": "false",
"id": 60,
"url": "/reports/GenerateReports.do?firstTime=true&reportID=60",
"Name": "Services by Response Time",
"desc": "Identify services with high response time"},
{
"customStatus": "False",
"displayName": "URLs by Response Time",
"isCustom": "false",
"id": 59,
"url": "/reports/GenerateReports.do?firstTime=true&reportID=59",
"Name": "URLs by Response Time",
"desc": "Identify URLs with high response time"},
{
"customStatus": "True",
"displayName": "Telnet Servers by Response Time",
"isCustom": "true",
"id": 68,
"url": "/reports/GenerateReports.do?firstTime=true&reportID=68",
"Name": "Telnet Servers by Response Time",
"desc": "Identify Telnet servers with high Response Time"},
{
"customStatus": "False",
"displayName": "DownTime Report",
"isCustom": "false",
"id": 91,
"url": "/reports/GenerateReports.do?firstTime=true&reportID=91",
"Name": "DownTime Report",
"desc": "DownTime history for all devices"},
{
"customStatus": "True",
"displayName": "FTP Servers by Response Time",
"isCustom": "true",
"id": 67,
"url": "/reports/GenerateReports.do?firstTime=true&reportID=67",
"Name": "FTP Servers by Response Time",
"desc": "Identify FTP servers with high Response Time"},
{
"customStatus": "True",
"displayName": "MySQL Servers by Response Time",
"isCustom": "true",
"id": 66,
"url": "/reports/GenerateReports.do?firstTime=true&reportID=66",
"Name": "MySQL Servers by Response Time",
"desc": "Identify MySQL servers with high Response Time"}
],
"title": ""}
],
"Name": "Availability and Response"},
{
"displayName": "Inventory",
"list": [
{
"list": [
{
"customStatus": "True",
"displayName": "Devices Down",
"isCustom": "true",
"id": 722,
"url": "/reports/GenerateReports.do?firstTime=true&reportID=722",
"Name": "widget.name.devicesdown",
"desc": "Get report for all devices down"},
{
"customStatus": "False",
"displayName": "Notification Profiles Applied by Type",
"isCustom": "false",
"id": 72,
"url": "/reports/GenerateReports.do?firstTime=true&reportID=72",
"Name": "Notification Profiles Applied by Type",
"desc": "Get report of all notification profiles applied by profile type"},
{
"customStatus": "False",
"displayName": "Notification Profiles Applied",
"isCustom": "false",
"id": 71,
"url": "/reports/GenerateReports.do?firstTime=true&reportID=71",
"Name": "Notification Profiles Applied",
"desc": "Get report of all notification profiles applied"},
{
"customStatus": "False",
"displayName": "Devices by Category",
"isCustom": "false",
"id": 70,
"isFavourite": "True",
"url": "/reports/GenerateReports.do?firstTime=true&reportID=70",
"Name": "Devices by Category",
"desc": "Get inventory report of devices by device category"},
{
"customStatus": "False",
"displayName": "Devices by Device Type",
"isCustom": "false",
"id": 69,
"url": "/reports/GenerateReports.do?firstTime=true&reportID=69",
"Name": "Devices by Device Type",
"desc": "Get inventory report of devices by device type"},
{
"customStatus": "False",
"displayName": "Hardware Information",
"isCustom": "false",
"id": 155,
"url": "/reports/GenerateReports.do?firstTime=true&reportID=155",
"Name": "webclient.reports.hardwareinfo.title",
"desc": "Get report of Hardware Information"},
{
"customStatus": "True",
"displayName": "Non SNMP Devices",
"isCustom": "true",
"id": 80,
"url": "/reports/GenerateReports.do?firstTime=true&reportID=80",
"Name": "Non SNMP Devices",
"desc": "Get inventory report of all SNMP not enabled devices"},
{
"customStatus": "True",
"displayName": "SNMP Enabled Devices",
"isCustom": "true",
"id": 79,
"url": "/reports/GenerateReports.do?firstTime=true&reportID=79",
"Name": "SNMP Enabled Devices",
"desc": "Get inventory report of all SNMP enabled devices"},
{
"customStatus": "True",
"displayName": "Desktop",
"isCustom": "true",
"id": 78,
"url": "/reports/GenerateReports.do?firstTime=true&reportID=78",
"Name": "Desktops",
"desc": "Get inventory report of desktops"},
{
"customStatus": "True",
"displayName": "Server",
"isCustom": "true",
"id": 77,
"url": "/reports/GenerateReports.do?firstTime=true&reportID=77",
"Name": "Servers",
"desc": "Get inventory report of servers"},
{
"customStatus": "False",
"displayName": "Threshold Details of Devices",
"isCustom": "false",
"id": 150,
"url": "/reports/GenerateReports.do?firstTime=true&reportID=150",
"Name": "webclient.report.name.thresholdreports",
"desc": "Get report of all thresholds configured"},
{
"customStatus": "True",
"displayName": "All Devices",
"isCustom": "true",
"id": 76,
"url": "/reports/GenerateReports.do?firstTime=true&reportID=76",
"Name": "All Devices",
"desc": "Get inventory report of all devices"},
{
"customStatus": "False",
"displayName": "Interfaces by Type",
"isCustom": "false",
"id": 75,
"url": "/reports/GenerateReports.do?firstTime=true&reportID=75",
"Name": "Interfaces by Type",
"desc": "Get report of all interfaces by type"},
{
"customStatus": "False",
"displayName": "Interface Speed Report",
"isCustom": "false",
"id": 74,
"url": "/reports/GenerateReports.do?firstTime=true&reportID=74",
"Name": "Interface Speed Report",
"desc": "Get report of interface bandwidth"},
{
"customStatus": "False",
"displayName": "Notification Profiles Applied by Device",
"isCustom": "false",
"id": 73,
"url": "/reports/GenerateReports.do?firstTime=true&reportID=73",
"Name": "Notification Profiles Applied by Device",
"desc": "Get report of all notification profiles applied by device"},
{
"customStatus": "False",
"displayName": "Devices by Added Time",
"isCustom": "false",
"id": 725,
"url": "/reports/GenerateReports.do?firstTime=true&reportID=725",
"Name": "Devices by Added Time",
"desc": "Get Devices with its Added Time"},
{
"customStatus": "False",
"displayName": "Uplink Dependency Devices",
"isCustom": "false",
"id": 727,
"url": "/reports/GenerateReports.do?firstTime=true&reportID=727",
"Name": "Up Link Dependency Devices",
"desc": "Get inventory report of all dependent devices"},
{
"customStatus": "False",
"displayName": "Credentials Associated Devices",
"isCustom": "false",
"id": 761,
"url": "/reports/GenerateReports.do?firstTime=true&reportID=761",
"Name": "webclient.credential.devices.report",
"desc": "Get report of credentials associated to devices"},
{
"customStatus": "False",
"displayName": "Agent-monitored devices",
"isCustom": "false",
"id": 862,
"url": "/reports/GenerateReports.do?firstTime=true&reportID=862",
"Name": "Agent Devices",
"desc": "Get an Inventory report of all agent-monitored devices"},
{
"customStatus": "False",
"displayName": "IPMI Information",
"isCustom": "false",
"id": 723,
"url": "/reports/GenerateReports.do?firstTime=true&reportID=723",
"Name": "webclient.reports.ipmi.info.title",
"desc": "Get a report of your IPMI devices and related hardware"}
],
"title": ""}
],
"Name": "Inventory"},
{
"displayName": "WAN RTT Monitors",
"list": [
{
"list": [
{
"customStatus": "False",
"displayName": "Top N Paths with Maximum RTT",
"isCustom": "false",
"id": 101,
"url": "/reports/GenerateReports.do?firstTime=true&reportID=101",
"Name": "Top N Paths with Maximum RTT",
"desc": "Top paths with maximum Round Trip Time"},
{
"customStatus": "False",
"displayName": "Round Trip Time History Report",
"isCustom": "false",
"id": 97,
"url": "/reports/GenerateReports.do?firstTime=true&reportID=97",
"Name": "Round Trip Time Trend Report",
"desc": "Show RTT of icmp packets between source and destination host"},
{
"customStatus": "False",
"displayName": "Availability History",
"isCustom": "false",
"id": 98,
"url": "/reports/GenerateReports.do?firstTime=true&reportID=98",
"Name": "Link Availability and Error Statistics",
"desc": "Show availability of destination also show type of errors in case of failed operation"},
{
"customStatus": "False",
"displayName": "RTT Threshold Violation Report",
"isCustom": "false",
"id": 96,
"url": "/reports/GenerateReports.do?firstTime=true&reportID=96",
"Name": "RTT Threshold Violation Report",
"desc": "Shows threshold violation of icmp packets between source and destination host"},
{
"customStatus": "False",
"displayName": "Top N Least Available Paths",
"isCustom": "false",
"id": 99,
"url": "/reports/GenerateReports.do?firstTime=true&reportID=99",
"Name": "Top N Least Available Paths",
"desc": "Top paths with least availability"},
{
"customStatus": "False",
"displayName": "Top N Paths with Maximum Threshold Violation",
"isCustom": "false",
"id": 100,
"url": "/reports/GenerateReports.do?firstTime=true&reportID=100",
"Name": "Top N Paths with Maximum Threshold Violation",
"desc": "Top paths with maximum threshold violation"}
],
"title": ""}
],
"Name": "WAN RTT Monitors"},
{
"displayName": "VoIP Monitors",
"list": [
{
"list": [
{
"customStatus": "False",
"displayName": "Round Trip Time History Report",
"isCustom": "false",
"id": 107,
"url": "/reports/GenerateReports.do?firstTime=true&reportID=107",
"Name": "Round Trip Time History Report",
"desc": "Shows RTT (Round Trip Time) of VoIP packets in both directions"},
{
"customStatus": "False",
"displayName": "Top N Call Paths by Jitter",
"isCustom": "false",
"id": 110,
"url": "/reports/GenerateReports.do?firstTime=true&reportID=110",
"Name": "Top N Call Paths by Jitter",
"desc": "Top call paths with maximum Jitter"},
{
"customStatus": "False",
"displayName": "Top N Call Paths by Packet Loss",
"isCustom": "false",
"id": 109,
"url": "/reports/GenerateReports.do?firstTime=true&reportID=109",
"Name": "Top N Call Paths by Packet Loss",
"desc": "Top call paths with maximum Packet Loss"},
{
"customStatus": "False",
"displayName": "Top N Call Paths by MOS",
"isCustom": "false",
"id": 108,
"url": "/reports/GenerateReports.do?firstTime=true&reportID=108",
"Name": "Top N Call Paths by MOS",
"desc": "Top call paths with minimum MOS"},
{
"customStatus": "False",
"displayName": "Top N Call Paths by Latency",
"isCustom": "false",
"id": 111,
"url": "/reports/GenerateReports.do?firstTime=true&reportID=111",
"Name": "Top N Call Paths by Latency",
"desc": "Top call paths with maximum Latency"},
{
"customStatus": "False",
"displayName": "Latency History Report",
"isCustom": "false",
"id": 102,
"url": "/reports/GenerateReports.do?firstTime=true&reportID=102",
"Name": "Latency History Report",
"desc": "Shows latency of VoIP packets in both directions"},
{
"customStatus": "False",
"displayName": "Jitter History Report",
"isCustom": "false",
"id": 103,
"url": "/reports/GenerateReports.do?firstTime=true&reportID=103",
"Name": "Jitter History Report",
"desc": "Shows jitter (inter packet delay) of VoIP packets in bonfa.overview.Qos=QoS"},
{
"customStatus": "False",
"displayName": "Packet Loss History Report",
"isCustom": "false",
"id": 104,
"url": "/reports/GenerateReports.do?firstTime=true&reportID=104",
"Name": "Packet Loss History Report",
"desc": "Shows packetloss of VoIP packets in both directions"},
{
"customStatus": "False",
"displayName": "VoIP Errors History Report",
"isCustom": "false",
"id": 105,
"url": "/reports/GenerateReports.do?firstTime=true&reportID=105",
"Name": "VoIP Errors History Report",
"desc": "Shows various errors (timeout, tail drop,MIA etc.,) generated in the VoIP traffic"},
{
"customStatus": "False",
"displayName": "MOS History Report",
"isCustom": "false",
"id": 106,
"url": "/reports/GenerateReports.do?firstTime=true&reportID=106",
"Name": "MOS History Report",
"desc": "Report shows MOS (Mean Opinion Score) of VoIP traffic. MOS is the key quality indicator of VoIP traffic"}
],
"title": ""}
],
"Name": "VoIP Monitors"},
{
"displayName": "Virtual Servers Report",
"list": [
{
"list": [
{
"customStatus": "False",
"displayName": "HyperV-Host vs Disk Mapping",
"isCustom": "false",
"id": 154,
"url": "/reports/GenerateReports.do?firstTime=true&reportID=154",
"Name": "webclient.virtual.hyperv.hostdisk.report",
"desc": "Get report for all Monitored HyperV-Host Vs Disk Mappings"},
{
"customStatus": "False",
"displayName": "Datastore vs VMware-Host Mapping",
"isCustom": "false",
"id": 153,
"url": "/reports/GenerateReports.do?firstTime=true&reportID=153",
"Name": "webclient.virtual.vmware.datastorehost.report",
"desc": "Get report for all Datastore Vs Monitored VMware-Host Mappings"},
{
"customStatus": "False",
"displayName": "Datastore vs VMware-VM Mapping",
"isCustom": "false",
"id": 152,
"url": "/reports/GenerateReports.do?firstTime=true&reportID=152",
"Name": "webclient.virtual.vmware.datastorevm.report",
"desc": "Get report for all Datastore Vs Monitored VMware-VM Mappings"},
{
"customStatus": "False",
"displayName": "VMware Idle VMs",
"isCustom": "false",
"id": 156,
"url": "/reports/GenerateReports.do?firstTime=true&reportID=156",
"Name": "widget.name.vmware.idleVms",
"desc": "List of Idle VMs"},
{
"customStatus": "False",
"displayName": "Top VMware VMs by CPU Under Allocated",
"isCustom": "false",
"id": 157,
"url": "/reports/GenerateReports.do?firstTime=true&reportID=157",
"Name": "widget.name.vmware.vmUnderAllocatedCPU",
"desc": "vms with under allocated CPU"},
{
"customStatus": "False",
"displayName": "Top VMware VMs by CPU Over Allocated",
"isCustom": "false",
"id": 158,
"url": "/reports/GenerateReports.do?firstTime=true&reportID=158",
"Name": "widget.name.vmware.vmOverAllocatedCPU",
"desc": "VMs with CPU over allocated"},
{
"customStatus": "False",
"displayName": "Top VMware VMs by Memory Under Allocated",
"isCustom": "false",
"id": 159,
"url": "/reports/GenerateReports.do?firstTime=true&reportID=159",
"Name": "widget.name.vmware.vmUnderAllocatedMemory",
"desc": "VMs with memory under allocated"},
{
"customStatus": "False",
"displayName": "Top VMware VMs by Memory Over Allocated",
"isCustom": "false",
"id": 160,
"url": "/reports/GenerateReports.do?firstTime=true&reportID=160",
"Name": "widget.name.vmware.vmOverAllocatedMemory",
"desc": "VMs with memory over allocated"},
{
"customStatus": "False",
"displayName": "All Virtual Machines",
"isCustom": "false",
"id": 726,
"url": "/reports/GenerateReports.do?firstTime=true&reportID=726",
"Name": "widget.name.vmware.vmsList",
"desc": "List of virtual machines based on virtual type"}
],
"title": ""}
],
"Name": "Virtual Servers Report"},
{
"displayName": "Storage Reports",
"list": [
{
"list": [
{
"customStatus": "False",
"displayName": "Growth Trend",
"isCustom": "false",
"id": 174,
"url": "/reports/GenerateReports.do?firstTime=true&reportID=174",
"Name": "webclient.reports.growthtrend.title",
"desc": "Growth Trend"},
{
"customStatus": "False",
"displayName": "Storage Summary",
"isCustom": "false",
"id": 161,
"url": "/reports/GenerateReports.do?firstTime=true&reportID=161",
"Name": "webclient.reports.storagesummary.title",
"desc": "Storage Summary"},
{
"customStatus": "False",
"displayName": "RAID Capacity Utilization",
"isCustom": "false",
"id": 162,
"url": "/reports/GenerateReports.do?firstTime=true&reportID=162",
"Name": "webclient.reports.topncapacity",
"desc": "RAID Capacity Utilization"},
{
"customStatus": "False",
"displayName": "RAID IOPS ",
"isCustom": "false",
"id": 163,
"url": "/reports/GenerateReports.do?firstTime=true&reportID=163",
"Name": "webclient.reports.topnraidiops",
"desc": "RAID IOPS "},
{
"customStatus": "False",
"displayName": "RAID Reads/Sec",
"isCustom": "false",
"id": 164,
"url": "/reports/GenerateReports.do?firstTime=true&reportID=164",
"Name": "webclient.reports.topnraidreads",
"desc": "RAID Reads/Sec"},
{
"customStatus": "False",
"displayName": "RAID Writes/Sec",
"isCustom": "false",
"id": 165,
"url": "/reports/GenerateReports.do?firstTime=true&reportID=165",
"Name": "webclient.reports.topnraidwrites",
"desc": "RAID Writes/Sec"},
{
"customStatus": "False",
"displayName": "RAID Latency",
"isCustom": "false",
"id": 166,
"url": "/reports/GenerateReports.do?firstTime=true&reportID=166",
"Name": "webclient.reports.topnraidlatency",
"desc": "RAID Latency"},
{
"customStatus": "False",
"displayName": "RAID Controller IOPS",
"isCustom": "false",
"id": 167,
"url": "/reports/GenerateReports.do?firstTime=true&reportID=167",
"Name": "webclient.reports.topnraidcontrolleriops",
"desc": "RAID Controller IOPS"},
{
"customStatus": "False",
"displayName": "RAID Controller Reads/Sec",
"isCustom": "false",
"id": 168,
"url": "/reports/GenerateReports.do?firstTime=true&reportID=168",
"Name": "webclient.reports.topnraidcontrollerreads",
"desc": "RAID Controller Reads/Sec"},
{
"customStatus": "False",
"displayName": "RAID Controller Writes/Sec",
"isCustom": "false",
"id": 169,
"url": "/reports/GenerateReports.do?firstTime=true&reportID=169",
"Name": "webclient.reports.topnraidcontrollerwrites",
"desc": "RAID Controller Writes/Sec"},
{
"customStatus": "False",
"displayName": "Disk IOPS",
"isCustom": "false",
"id": 170,
"url": "/reports/GenerateReports.do?firstTime=true&reportID=170",
"Name": "webclient.reports.topndiskiops",
"desc": "Disk IOPS"},
{
"customStatus": "False",
"displayName": "Disk Reads/Sec",
"isCustom": "false",
"id": 171,
"url": "/reports/GenerateReports.do?firstTime=true&reportID=171",
"Name": "webclient.reports.topndiskreads",
"desc": "Disk Reads/Sec"},
{
"customStatus": "False",
"displayName": "Disk Writes/Sec",
"isCustom": "false",
"id": 172,
"url": "/reports/GenerateReports.do?firstTime=true&reportID=172",
"Name": "webclient.reports.topndiskwrites",
"desc": "Disk Writes/Sec"},
{
"customStatus": "False",
"displayName": "RAID Forecast By Utilization",
"isCustom": "false",
"id": 173,
"url": "/reports/GenerateReports.do?firstTime=true&reportID=173",
"Name": "webclient.reports.forecast.title",
"desc": "RAID Forecast By Utilization"}
],
"title": ""}
],
"Name": "Storage Reports"},
{
"displayName": "Forecast Reports",
"list": [
{
"list": [
{
"customStatus": "False",
"displayName": "Memory Forecast",
"isCustom": "false",
"id": 177,
"url": "/reports/GenerateReports.do?firstTime=true&reportID=177",
"Name": "Memory Forecast",
"desc": "Forecasts the Memory Utilization"},
{
"customStatus": "False",
"displayName": "Disk Forecast By Usage",
"isCustom": "false",
"id": 175,
"url": "/reports/GenerateReports.do?firstTime=true&reportID=175",
"Name": "Disk Forecast By Usage",
"desc": "Disk Forecast By Usage"},
{
"customStatus": "False",
"displayName": "CPU Forecast",
"isCustom": "false",
"id": 178,
"url": "/reports/GenerateReports.do?firstTime=true&reportID=178",
"Name": "CPU Forecast",
"desc": "Forecasts the CPU utilization"}
],
"title": ""}
],
"Name": "Forecast Reports"},
{
"displayName": "Nutanix Reports",
"list": [
{
"list": [
{
"customStatus": "False",
"displayName": "Top N Hosts by IOPS",
"isCustom": "false",
"id": 740,
"url": "/reports/GenerateReports.do?firstTime=true&reportID=740",
"Name": "webclient.nutanix.hostsUnderIOPS.report",
"desc": "Get report for Top Hosts with IOPS rate"},
{
"customStatus": "False",
"displayName": "Disk Inventory",
"isCustom": "false",
"id": 739,
"url": "/reports/GenerateReports.do?firstTime=true&reportID=739",
"Name": "webclient.nutanix.disk.report",
"desc": "Get report for all Disk Inventory Details"},
{
"customStatus": "False",
"displayName": "Storage Containers",
"isCustom": "false",
"id": 738,
"url": "/reports/GenerateReports.do?firstTime=true&reportID=738",
"Name": "webclient.nutanix.storagecontainers",
"desc": "Get report for all Storage Container Details"},
{
"customStatus": "False",
"displayName": "Cluster Latency",
"isCustom": "false",
"id": 736,
"url": "/reports/GenerateReports.do?firstTime=true&reportID=736",
"Name": "webclient.nutanix.cluster.latency.report",
"desc": "Get report for all Cluster Latency Data"},
{
"customStatus": "False",
"displayName": "Cluster IOPS",
"isCustom": "false",
"id": 735,
"url": "/reports/GenerateReports.do?firstTime=true&reportID=735",
"Name": "webclient.nutanix.cluster.iops.report",
"desc": "Get report for all Cluster IOPS Data"},
{
"customStatus": "False",
"displayName": "Cluster Inventory",
"isCustom": "false",
"id": 734,
"url": "/reports/GenerateReports.do?firstTime=true&reportID=734",
"Name": "webclient.nutanix.cluster.report",
"desc": "Get report for all Cluster details"},
{
"customStatus": "False",
"displayName": "VM Summary by Host",
"isCustom": "false",
"id": 733,
"url": "/reports/GenerateReports.do?firstTime=true&reportID=733",
"Name": "webclient.nutanix.hostToVmMap.report",
"desc": "Get report for VMs Details based on its Host"},
{
"customStatus": "False",
"displayName": "VM Summary by Cluster",
"isCustom": "false",
"id": 732,
"url": "/reports/GenerateReports.do?firstTime=true&reportID=732",
"Name": "webclient.nutanix.clusterToVMMap.report",
"desc": "Get report for VM Details based on its Cluster"},
{
"customStatus": "False",
"displayName": "Host Summary",
"isCustom": "false",
"id": 737,
"url": "/reports/GenerateReports.do?firstTime=true&reportID=737",
"Name": "webclient.nutanix.clusterToHostMap.report",
"desc": "Get report for all Host Details based on its Cluster"},
{
"customStatus": "False",
"displayName": "Top N Hosts by IO Bandwidth",
"isCustom": "false",
"id": 743,
"url": "/reports/GenerateReports.do?firstTime=true&reportID=743",
"Name": "webclient.nutanix.hostUnderBandwidth.report",
"desc": "Get report for Top Disks with IO Bandwidth rate"},
{
"customStatus": "False",
"displayName": "Top N Hosts by Latency",
"isCustom": "false",
"id": 742,
"url": "/reports/GenerateReports.do?firstTime=true&reportID=742",
"Name": "webclient.nutanix.hostUnderLatency.report",
"desc": "Get report for Top Hosts with Latency"},
{
"customStatus": "False",
"displayName": "Top N Disks by free space",
"isCustom": "false",
"id": 741,
"url": "/reports/GenerateReports.do?firstTime=true&reportID=741",
"Name": "webclient.nutanix.diskUnderFreespace.report",
"desc": "Get report for Top Disks with Free space"}
],
"title": ""}
],
"Name": "Nutanix Reports"},
{
"displayName": "WLC Reports",
"list": [
{
"list": [
{
"customStatus": "False",
"displayName": "AP Availability",
"isCustom": "false",
"id": 837,
"url": "/reports/GenerateReports.do?firstTime=true&reportID=837",
"Name": "webclient.availability.accessPoints.report",
"desc": "Get availability report for Access points"},
{
"customStatus": "False",
"displayName": "Rogue SSID Details",
"isCustom": "false",
"id": 839,
"url": "/reports/GenerateReports.do?firstTime=true&reportID=839",
"Name": "webclient.inventory.RougeAP.report",
"desc": "Get inventory report of Rogue SSIDs"},
{
"customStatus": "False",
"displayName": "AP Details",
"isCustom": "false",
"id": 838,
"url": "/reports/GenerateReports.do?firstTime=true&reportID=838",
"Name": "webclient.inventory.accessPoints.report",
"desc": "Get inventory report of Access points"}
],
"title": ""}
],
"Name": "WLC Reports"},
{
"displayName": "Meraki Reports",
"list": [
{
"list": [
{
"customStatus": "False",
"displayName": "Meraki MS Details",
"isCustom": "false",
"id": 855,
"url": "/reports/GenerateReports.do?firstTime=true&reportID=855",
"Name": "webclient.opm.reports.meraki.msdetails",
"desc": "Get summary reports of Meraki Switch devices."},
{
"customStatus": "False",
"displayName": "Meraki AP Details",
"isCustom": "false",
"id": 860,
"url": "/reports/GenerateReports.do?firstTime=true&reportID=860",
"Name": "webclient.opm.reports.meraki.apDetails",
"desc": "Get inventory reports of Meraki Access Points."},
{
"customStatus": "False",
"displayName": "Meraki Rogue SSID Details",
"isCustom": "false",
"id": 859,
"url": "/reports/GenerateReports.do?firstTime=true&reportID=859",
"Name": "webclient.opm.reports.meraki.rogue",
"desc": "Get inventory reports of Meraki Rogue SSIDs."},
{
"customStatus": "False",
"displayName": "Meraki Cellular Gateway Details",
"isCustom": "false",
"id": 858,
"url": "/reports/GenerateReports.do?firstTime=true&reportID=858",
"Name": "webclient.opm.reports.meraki.mgdetails",
"desc": "Get summary reports of Meraki Gateway devices."},
{
"customStatus": "False",
"displayName": "Meraki MV Details",
"isCustom": "false",
"id": 857,
"url": "/reports/GenerateReports.do?firstTime=true&reportID=857",
"Name": "webclient.opm.reports.meraki.mvdetails",
"desc": "Get summary reports of Meraki Vision devices."},
{
"customStatus": "False",
"displayName": "Meraki MR Details",
"isCustom": "false",
"id": 856,
"url": "/reports/GenerateReports.do?firstTime=true&reportID=856",
"Name": "webclient.opm.reports.meraki.mrdetails",
"desc": "Get summary reports of Meraki Radio devices."},
{
"customStatus": "False",
"displayName": "Meraki Organization Summary",
"isCustom": "false",
"id": 853,
"url": "/reports/GenerateReports.do?firstTime=true&reportID=853",
"Name": "webclient.opm.reports.meraki.orgSummary",
"desc": "Get inventory reports of devices in each organization"},
{
"customStatus": "False",
"displayName": "Meraki MX Details",
"isCustom": "false",
"id": 854,
"url": "/reports/GenerateReports.do?firstTime=true&reportID=854",
"Name": "webclient.opm.reports.meraki.mxdetails",
"desc": "Get summary reports of Meraki Security appliances."},
{
"customStatus": "False",
"displayName": "Down Meraki Devices",
"isCustom": "false",
"id": 861,
"url": "/reports/GenerateReports.do?firstTime=true&reportID=861",
"Name": "webclient.opm.reports.meraki.down",
"desc": "Get reports for all Meraki devices that are down."}
],
"title": ""}
],
"Name": "Meraki Reports"},
{
"displayName": "My Favorites",
"list": [
{
"list": [
{
"customStatus": "False",
"displayName": "All Alerts",
"isCustom": "false",
"id": 84,
"isFavourite": "True",
"url": "/reports/GenerateReports.do?firstTime=true&reportID=84",
"Name": "All Alerts",
"desc": "Get report for all alerts"},
{
"customStatus": "False",
"displayName": "All Events",
"isCustom": "false",
"id": 1,
"isFavourite": "True",
"url": "/reports/GenerateReports.do?firstTime=true&reportID=1",
"Name": "All Events",
"desc": "Get report for all events"},
{
"customStatus": "False",
"displayName": "WAN Links by Utilization",
"isCustom": "false",
"id": 15,
"isFavourite": "True",
"url": "/reports/GenerateReports.do?firstTime=true&reportID=15",
"Name": "WAN Links by Utilization",
"desc": "Identify WAN links with heavy traffic utilization"},
{
"customStatus": "True",
"displayName": "Servers Health Report",
"isCustom": "true",
"id": 22,
"isFavourite": "True",
"url": "/reports/GenerateReports.do?firstTime=true&reportID=22",
"Name": "Servers Health Report",
"desc": "Get health report of servers"},
{
"customStatus": "False",
"displayName": "WAN Links Availability",
"isCustom": "false",
"id": 54,
"isFavourite": "True",
"url": "/reports/GenerateReports.do?firstTime=true&reportID=54",
"Name": "WAN Links Availability",
"desc": "Get availability report for all interfaces"},
{
"customStatus": "False",
"displayName": "All Interfaces Availability",
"isCustom": "false",
"id": 87,
"isFavourite": "True",
"url": "/reports/GenerateReports.do?firstTime=true&reportID=87",
"Name": "All Interfaces Availability",
"desc": "Get availability report for all interfaces"},
{
"customStatus": "False",
"displayName": "Service Monitors Availability",
"isCustom": "false",
"id": 56,
"isFavourite": "True",
"url": "/reports/GenerateReports.do?firstTime=true&reportID=56",
"Name": "Service Monitors Availability",
"desc": "Get availability report for all service monitors"},
{
"customStatus": "False",
"displayName": "Devices by Category",
"isCustom": "false",
"id": 70,
"isFavourite": "True",
"url": "/reports/GenerateReports.do?firstTime=true&reportID=70",
"Name": "Devices by Category",
"desc": "Get inventory report of devices by device category"}
],
"title": ""}
],
"Name": "My Favorites"},
{
"ScheduleReports": true,
"FavoriteReports": false,
"CustomReports": true}
]
Rate limit: 100 requests per minute. Exceeding this limit will block requests for 1 minute

getReportsData

The API to get the required report data.

HTTP Method

GET

API URL

https://localhost:8060/api/json/reports/getReportsData?apiKey=***************&reportID=84&isExcludeDays=true&excludedDays=Monday,Tuesday&category=Desktop&bview=All&time=Last_Month&timeWindow=8-20&isBusinessHour=false&showType=0&top=1000&viewAs=json

Parameters

Param NameDescriptionData TypeAdditional InformationIs Mandatory
apiKeyAPI Key to access your OpManager server.StringapiKeyYes
reportIDUnique ID for individual reports, This ID can be fetched from getReportsList APIStringAny numeric value (e.g., 101, 2024, 987654) or The exact string "Audit"No
viewAsFormat to view the resultant report data.StringPDF, XLS, DOCX, json, or EMAIL.Yes
timeThe time period to fetch the report data.Stringcustom, Today, onehour, twohours, fourhours, sixhours, eighthours, twelvehours, twfourhours, before_12_hours, before_24_hours, before_48_hours, Last_7_Days, WEEK, Last_30_Days, MONTH, Last_60_Days, Last_90_Days, Yesterday, thisweek, lastweek, thismonth, Last_Month, Last 12 hours, Last 24 hours, Last 7 days, This week, Last week, This month, Last month, Last_12_hours, Last_24_hours, This_Week, This_Month, Last_Week, Next_7_days, Next_14_days, Next_30_days, Next_60_days, Next_90_days, Next_12_hours, Next_24_hours, This_Week, This_Quarter, Last_Quarter, Last_3_Months, Last_6_Months.No
isExcludeDaysBoolean value to exclude days or not.boolean-No
excludedDaysThe day to be excluded in report data.StringMonday,Tuesday,Wednesday,Thursday,Friday,Saturday,SundayNo
categoryThe category of devices for which the report data needs to be fetchedString-No
logicalGroupThe logical group for which the report data needs to be fetched (format: logicalGroupName-logicalGroupId).This name can be fetched from listAllLogicalGroups API StringA-Z, a-z, 0-9, all non-Basic Latin letters, ., !, :, @, #, $, , -, _, \, /, ', ,No
bviewThe business view for which the report data needs to be fetched (format: bussinessViewName_bv).String-No
timeWindowThe time window to fetch the report data.StringAny two numbers from 0 to 24 separated by a dash (-) (Eg 0-0, 0-1, 0-24, 5-10, 12-24, 24-24)No
showTypeTo show the top or bottom contents of report data.int-No
startTimeStart time of custom time period (only if custom time period is chosen).StringYYYY-MM-DDNo
endTimeEnd time of custom time period (only if custom time period is chosen).StringYYYY-MM-DDNo
startHourStart hour of custom time period (only if custom time period is chosen).int-No
endHourEnd hour of custom time period (only if custom time period is chosen).int-No
customerIdProbe Id to be filtered.long-No
customerNameProbe name to be filtered.String-No
fromEmailidFrom mail id for report to be sent.StringMust be a valid email address containing alphanumeric characters and allowed symbols (% _ + . - ') before the @, followed by a domain name and a valid alphabetic top-level domain (e.g., .com).No
toEmailidTo mail id for report to be sent.StringOne or more valid email addresses separated by commas, each containing permitted characters before the @ and followed by a valid domain or IPv4 address.No
emailSubjectMail SubjectStringAny combination of letters, numbers, spaces, and permitted special characters.No
isBusinessHourBoolean value to show business hour data or not.boolean-No
businessRuleIDID of the business rule created previously.long-No
probeIdprobe ID for forecast trend report.long-No
fromTimestart time (Only if custom time period chosen for forecast trend report).StringDD/MM/YYYY HH:MMNo
toTimeend time (Only if custom time period chosen for forecast trend report).StringDD/MM/YYYY HH:MMNo
pollIDPoll ID of the monitor for forecast trend report.long-No
valueTypeValue type to get mimum or maximum or average value in Trend report.StringMINIMUM,MAXIMUM,AVERAGENo
perfGroupIdPerformance group ID for Trend Report (EX: 2 for Disk Utilization).long-No
cpRuleIdRule ID to filter Capacity planning report.long-No
cpResultCapacity planning report Result (all, yes, no).Stringall,yes,noNo
reportRequestIdAn Id will be generated on access of each reportlong-No

Sample Response

HTTP Code: 200

[ { "clientParams":{ "top": 0, "genAt": "9 Oct 2025 10:54:08 AM IST", "customerId": 1, "showType": 0, "sites":{ "1": "probe1"}, "time": "twfourhours", "isFavourite": false, "genAtMilliseconds": 1759987448987}, "additionalRespData":{ "isThresholdState": "true", "cpReportType": "webclient.reports.cpr.idle.name", "cpResult": "all"}, "graphDetails": [ [ "172.21.3.31", "172.21.3.31.10000000001", "0_No", "1_Idle for 100% of the time (3 Hours)", "0_Idle for 0% of the time ", "0_Idle for 0% of the time " ], [ "172.21.11.53", "172.21.11.53.10000000001", "1_Yes", "1_Idle for 100% of the time (3 Hours)", "0_Monitor not yet polled or not associated", "0_Idle for 0% of the time " ], [ "Siva-22814", "siva-22814.mdu.zohocorpin.com.10000000001", "0_No", "0_Idle for 50% of the time (2 Hours)", "0_Idle for 0% of the time ", "0_Idle for 0% of the time " ], [ "172.21.178.111", "172.21.178.111.10000000001", "0_No", "1_Idle for 100% of the time (3 Hours)", "0_Idle for 0% of the time ", "0_Idle for 0% of the time " ] ], "forward": "cpReports", "graphHeaders": [ "Name", "Idle", "CPU Utilization < 10", "Disk Utilization < 10", "Memory Utilization < 10" ], "vmClientParams":{ "isThresholdState": "true", "cpReportType": "webclient.reports.cpr.idle.name", "cpResult": "all"}, "ReportGraphName": "webclient.reports.cpr.idle.name", "graphDispName": "Idle devices"}
]
Rate limit: 100 requests per minute. Exceeding this limit will block requests for 1 minute

getReportData

This API is used to fetch data from Report Builder reports. It allows users to create customized reports based on their monitoring preferences. Users can also generate reports specifically for devices or interfaces monitored by OpManager. Additionally, this API can be used to fetch monitoring data for different time periods across multiple monitors and devices simultaneously.

HTTP Method

POST

API URL

https://localhost:8060/api/json/v2/device/getReportData?apiKey=***************&deviceList=moname1,moname2&monitorList=DevicesAvailability,ResponseTime,WMI-CPUUtilization,MSSQLDataFilesSizeKB&timePeriod=Last_Month&view=table&timeWindow=0-24&startDate=2020-11-09&endDate=2020-11-18-18

Parameters

Param NameDescriptionData TypeAdditional InformationIs Mandatory
apiKeyAPI Key to access your OpManager server.StringapikeyYes
deviceListList of devices to fetch the report for.StringStringYes
deviceMOIDListList of device MOIDs separated by commas, This ID can be fetched from listDevices APIStringOne or more integer numbers, separated by commas.Yes
monitorListList of monitors to include in the report.String-Yes
timePeriodTime period for the report.Stringcustom, Today, onehour, twohours, fourhours, sixhours, eighthours, twelvehours, twfourhours, before_12_hours, before_24_hours, before_48_hours, Last_7_Days, WEEK, Last_30_Days, MONTH, Last_60_Days, Last_90_Days, Yesterday, thisweek, lastweek, thismonth, Last_Month, Last 12 hours, Last 24 hours, Last 7 days, This week, Last week, This month, Last month, Last_12_hours, Last_24_hours, This_Week, This_Month, Last_Week, Next_7_days, Next_14_days, Next_30_days, Next_60_days, Next_90_days, Next_12_hours, Next_24_hours, This_Week, This_Quarter, Last_Quarter, Last_3_Months, Last_6_Months.Yes
viewView type for the report (table/graph/tile).Stringtable, graph, tileYes
tableViewDecides Table view is based on instance or monitors or device name or interface.Stringinstance, monitor, monitors, interfaceNo
combinedTableWhether to combine multiple tables into one.Boolean-No
rangeTypeRange type for the report.Int-No
showOnlyFilter to show only specific data.Int-No
startDateReport start date (only if custom time period is selsected).StringYYYY-MM-DDNo
startHourReport start hour (only if custom time period is selsected).Int-No
endDateReport end date (only if custom time period is selsected).StringYYYY-MM-DD$No
endHourReport end hour (only if custom time period is selsected).Int-No
viewAsFormat to view the report.StringXLSNo
tabletypeType of table for the report.StringmonitorNo
timeWindowTime window for reports (startHour-endHour).StringAny two numbers from 0 to 24 separated by a dash (-) (Eg 0-0, 0-1, 0-24, 5-10, 12-24, 24-24)Yes
graphReportTypeType of Graph Report.StringNormal, Average, Individual, Summary, PieChartYes
dataFrequencyFrequency of the data points in the report.Int-No
isBusinessHourWhether to consider business hours.Boolean-No
bhRuleIdBusiness hours rule ID.Long-No
seriesTypeDecides whether Minimum or Maximum or Average values need to be shown in report.StringMIN, MAX, AVGYes
needMetaDataWhether to include metadata in the report.Boolean-No
entityMOIDEntity MOID to filter the report, This ID can be fetched from listDevices APILong-No
entityTypeType of entity for widgets.Stringdevices, interfaces, Device_Group, Interface_GroupNo
isInstantWidgetsWhether the request is for instant widgets.Boolean-No

Sample Response

HTTP Code: 200

{ "DevicesAvailability - Percentage": [ { "seriesname": "Ground Floor AD Server", "data": [ [ 1667759400000, 0, "DevicesAvailability" ], [ 1667763000000, 0, "DevicesAvailability" ], [ 1667766600000, 0, "DevicesAvailability" ], [ 1667770200000, 0, "DevicesAvailability" ], [ 1667773800000, 0, "DevicesAvailability" ], [ 1667777400000, 0, "DevicesAvailability" ], [ 1667781000000, 0, "DevicesAvailability" ], [ 1667784600000, 0, "DevicesAvailability" ], [ 1667788200000, 0, "DevicesAvailability" ], [ 1667791800000, 0, "DevicesAvailability" ], [ 1667795400000, 0, "DevicesAvailability" ], [ 1667799000000, 0, "DevicesAvailability" ] ], "yaxiscolumnorder": [ 0 ], "id": "20000049227"} ], "Packet Loss - Percentage": [ { "seriesname": "Ground Floor AD Server", "data": [ [ 1667759400000, 100, "Packet_Loss" ], [ 1667763000000, 100, "Packet_Loss" ], [ 1667766600000, 100, "Packet_Loss" ], [ 1667770200000, 100, "Packet_Loss" ], [ 1667773800000, 100, "Packet_Loss" ], [ 1667777400000, 100, "Packet_Loss" ], [ 1667781000000, 100, "Packet_Loss" ], [ 1667784600000, 100, "Packet_Loss" ], [ 1667788200000, 100, "Packet_Loss" ], [ 1667791800000, 100, "Packet_Loss" ], [ 1667795400000, 100, "Packet_Loss" ], [ 1667799000000, 100, "Packet_Loss" ] ], "id": "20000001078"} ]}
Rate limit: 100 requests per minute. Exceeding this limit will block requests for 1 minute

List All Advanced Reports

This API can be used to fetch all the created Advanced Reports.

HTTP Method

GET

API URL

http://localhost:8060/client/api/json/reports/listAllAdvancedReports?_=***********************

Parameters

Param NameDescriptionData TypeAdditional InformationIs Mandatory
apiKeyAn apiKey enables you to access OpManager server.-apiKeyNo

Sample Response

HTTP Code: 200

[ { "Description": "Interfaces Availability report", "ReportId": 6903, "Name": "Interfaces Report"}, { "Description": "Availability reports for servers", "ReportId": 6904, "Name": "Device Availability Report"}, { "Description": "Inventory Data for interfaces", "ReportId": 16201, "Name": "Interfaces Inventory"}, { "Description": "Custom fields for devices", "ReportId": 16806, "Name": "Devices Data with Custom Fields"}
]
Rate limit: 100 requests per minute. Exceeding this limit will block requests for 1 minute

Subnets

listSubnets

Lists all the Subnets monitored in OpManager

HTTP Method

GET

API URL

https://localhost:8060/api/json/device/listSubnets?apiKey=***************

Parameters

Param NameDescriptionData TypeAdditional InformationIs Mandatory
apiKeyAPI Key to access your OpManager server.String-Yes

Sample Response

HTTP Code: 200

{ "10.5.5.1":{ "data": [ { "Status": "5", "Label": "Clear", "Count": "1"}, { "Status": "5", "Label": "Clear", "Count": "1"} ], "displayName": "10.5.5.1", "subnetDisplayName": ""}, "10.5.5.2":{ "data": [ { "Status": "5", "Label": "Clear", "Count": "1"} ], "displayName": "10.5.5.2", "subnetDisplayName": ""}}
Rate limit: 300 requests per minute. Exceeding this limit will block requests for 1 minute

Wireless

getWirelessNetworkDetails

Lists Access Points, Client Count and Network Usage for each SSID in Wireless LAN Controller

HTTP Method

GET

API URL

https://localhost:8060/api/json/v2/wireless/getWirelessNetworkDetails?apiKey=***************&deviceName=CiscoWirelessController

Parameters

Param NameDescriptionData TypeAdditional InformationIs Mandatory
apiKeyAPI Key to access your OpManager server.String-Yes
deviceNameName of the WLC device (Managed Entity name as seen in the URL of device snapshot page OR 'deviceName' property value in the listDevices API response)String-Yes

Sample Response

HTTP Code: 200

[ { "ClientCount": "40", "TotalBytes": "224.548 MBps", "SSIDName": "Mobile-Connect", "APCount": "20"}, { "ClientCount": "20", "TotalBytes": "224.546 MBps", "SSIDName": "Machine-Connect", "APCount": "20"}, { "ClientCount": "20", "TotalBytes": "196.161 MBps", "SSIDName": "Free-Connect", "APCount": "20"}
]
Rate limit: 40 requests per minute. Exceeding this limit will block requests for 1 minute

getWirelessAPList

Lists all Access Points in the WLC Device.

HTTP Method

GET

API URL

https://localhost:8060/api/json/v2/wireless/getWirelessAPList?apiKey=***************&deviceName=CiscoWirelessController

Parameters

Param NameDescriptionData TypeAdditional InformationIs Mandatory
apiKeyAPI Key to access your OpManager server.String-Yes
deviceNameName of the WLC device (Managed Entity name seen in the URL of device snapshot page OR 'deviceName' property value in the listDevices API response)String-Yes
filterByFilter criteria to narrow down the list of wireless access pointsStringAllowed values: All, Active, Removed, Managed, UnManaged, Monitored, NotMonitoredNo

Sample Response

HTTP Code: 200

[ { "macAddress": "1:50:bf:7:xx:xx", "channels": "53,64", "statusStr": "Clear", "ipAddress": "10.5.5.2", "apDisplayName": "South-0011", "advanceMonitoringEnabled": "true", "apName": "ap-10.5.5.2-1.80.191.7.xxx.xx", "statusNum": "5"}, { "macAddress": "1:50:bf:7:xx:xx", "channels": "53,64", "statusStr": "Not Monitored", "ipAddress": "10.5.5.2", "apDisplayName": "North021", "advanceMonitoringEnabled": "false", "apName": "ap-10.5.5.2-1.80.191.7.xxx.xx", "statusNum": "7"}, { "macAddress": "1:50:bf:7:xx:xx", "channels": "53,64", "statusStr": "Not Monitored", "ipAddress": "10.5.5.2", "apDisplayName": "South0021", "advanceMonitoringEnabled": "false", "apName": "ap-10.5.5.2-1.80.191.7.xxx.xx", "statusNum": "7"}, { "macAddress": "1:50:bf:7:xx:xx", "channels": "53,64", "statusStr": "Not Monitored", "ipAddress": "10.5.5.2", "apDisplayName": "North0031", "advanceMonitoringEnabled": "false", "apName": "ap-10.5.5.2-1.80.191.7.xxx.xx", "statusNum": "7"}
]
Rate limit: 40 requests per minute. Exceeding this limit will block requests for 1 minute

getSSIDClientList

Lists all the SSID Clients associated with the given WLC device.

HTTP Method

GET

API URL

https://localhost:8060/api/json/v2/wireless/getSSIDClientList?apiKey=***************&deviceName=CiscoWirelessController

Parameters

Param NameDescriptionData TypeAdditional InformationIs Mandatory
apiKeyAPI Key to access your OpManager server.String-Yes
deviceNameName of the WLC device (Managed Entity name as seen in the URL of device snapshot page OR 'deviceName' property value in the listDevices API response)String-Yes

Sample Response

HTTP Code: 200

{ "clientData": [ { "displayName": "Mobile-Connect", "ClientCount": "40"}, { "displayName": "Free-Connect", "ClientCount": "20"}, { "displayName": "Machine-Connect", "ClientCount": "20"} ], "clientCount": 80}
Rate limit: 50 requests per minute. Exceeding this limit will block requests for 1 minute

getClientDetails

Fetches the client devices connected to the given SSID of WLC device.

HTTP Method

GET

API URL

https://localhost:8060/api/json/v2/wireless/getClientDetails?apiKey=***************&deviceName=CiscoWirelessController&ssidName=WorkstationNetwork

Parameters

Param NameDescriptionData TypeAdditional InformationIs Mandatory
apiKeyAPI Key to access your OpManager server.String-Yes
deviceNameName of the WLC device (Managed Entity name as seen in the URL of device snapshot page OR 'deviceName' property value in the listDevices API response)String-Yes
ssidNameSSID name of the wireless network associated to WLCString-Yes

Sample Response

HTTP Code: 200

[ { "ClientCount": "2", "TotalBytes": "28.156 MBps", "APMOName": "ap-10.5.5.2-1.80.191.7.xxx.xx", "advanceMonitoringEnabled": "false", "apName": "North0041"}, { "ClientCount": "2", "TotalBytes": "28.154 MBps", "APMOName": "ap-10.5.5.2-1.80.191.7.xxx.xx", "advanceMonitoringEnabled": "false", "apName": "North0031"}, { "ClientCount": "2", "TotalBytes": "14.079 MBps", "APMOName": "ap-10.5.5.2-1.80.191.7.xxx.xx", "advanceMonitoringEnabled": "false", "apName": "North0101"}
]
Rate limit: 50 requests per minute. Exceeding this limit will block requests for 1 minute

Workflow

getWorkflowList

This API is to list all the workflows created in an OPM Setup

HTTP Method

GET

API URL

https://localhost:8060/api/json/workflow/getWorkflowList?apiKey=***************

Parameters

Param NameDescriptionData TypeAdditional InformationIs Mandatory
apiKeyAPI Key to access your OpManager server.Yes

Sample Response

HTTP Code: 200

[ { "reportID": 90, "name": "Instant Device Check", "description": "This Workflow updates the alarm notes with results of PING and NSLOOKUP when triggered from a device down alarm", "triggerdesc": "Schedule or Alarm Trigger is not configured for this Workflow", "workflowType": 0, "triggerType": 3, "rbID": 1}, { "reportID": 90, "name": "Test WMI Credentials", "description": "Execute Windows Script", "triggerdesc": "Schedule or Alarm Trigger is not configured for this Workflow", "workflowType": 1, "triggerType": 3, "rbID": 3}, { "reportID": 90, "name": "URL Down Check", "description": "Description not given for this Workflow", "triggerdesc": "Schedule or Alarm Trigger is not configured for this Workflow", "workflowType": 1, "triggerType": 3, "rbID": 2}
]
Rate limit: 25 requests per minute. Exceeding this limit will block requests for 1 minute

getWorkFlows

This API is to list all the workflows associated to a respective device.

HTTP Method

GET

API URL

https://localhost:8060/api/json/workflow/getWorkFlows?name=192.168.100.202.10000000001&apiKey=***************

Parameters

Param NameDescriptionData TypeAdditional InformationIs Mandatory
apiKeyAPI Key to access your OpManager server.Yes
nameName of the device - Managed Entity name as seen in the URL of the device snapshot page OR 'deviceName' property value in the listDevices API response.String-Yes

Sample Response

HTTP Code: 200

[ { "reportID": 10000000091, "wfName": "Instant Device Check", "triggerDesc": "Alarm trigger configured for this workflow", "triggerType": "1", "wfID": "10000000002", "wfDesc": "This Workflow updates the alarm notes with results of PING and NSLOOKUP when triggered from a device down alarm"}, { "reportID": 10000000091, "wfName": "alarm", "triggerDesc": "Alarm trigger configured for this workflow", "triggerType": "1", "wfID": "10000000302", "wfDesc": "Description not given for this Workflow"}
]
Rate limit: 5 requests per minute. Exceeding this limit will block requests for 1 minute

triggerWorkflow

This API is to trigger an workflow for a specific device.(Note: The device should be associated to that workflow.)

HTTP Method

POST

API URL

https://localhost:8060/api/json/workflow/triggerWorkflow?workflowName=10000000302&deviceName=192.168.100.202.10000000001&apiKey=***************

Parameters

Param NameDescriptionData TypeAdditional InformationIs Mandatory
apiKeyAPI Key to access your OpManager server.Yes
workflowNameThe Name of the workflow which is to be triggerred for the device. This Name Can be obtained from the All workflows page (Workflows -> All Workflows)StringAllowed values : alphabets, Numbers, '-','_', 'space'Yes
deviceNameName of the device - Managed Entity name as seen in the URL of the device snapshot page OR 'deviceName' property value in the listDevices API response.String-Yes

Sample Response

HTTP Code: 200

[ { "result":{ "message": "Workflow has been triggered successfully."}}
]

Error Response

HTTP Code: 200

{ "error":{ "code": 5051, "message": "Device[] does not exist in the product."}}

HTTP Code: 200

{ "error":{ "code": 5175, "message": "Workflow with the sepecified name[] does not exist."}}
View common error responses
Rate limit: 5 requests per minute. Exceeding this limit will block requests for 1 minute

triggerWorkflowToAlarm

This API is to trigger an workflow for a specific device.

HTTP Method

POST

API URL

https://localhost:8060/api/json/workflow/triggerWorkflowToAlarm?wfID=10000000302&alarmId=10000000302&apiKey=***************

Parameters

Param NameDescriptionData TypeAdditional InformationIs Mandatory
apiKeyAPI Key to access your OpManager server.Yes
wfIDThe ID of the workflow which is to be triggerred for the device. This ID Can be obtained from the getWorkFlows of the edit workflow page(Workflows->All workflows->click on the required workflow) or this can be obtained from the rbID key of the getWorkflowList api.NumberAllowed values : Numebers from (0-9) which is the ID of the workflowYes
alarmIdThe Id Of the alarm for which the workflow is to be triggered. This ID Can be obtained from the list Alarms API. The output of the listAlarms API is a JSONObject. It contains an JSONArray called rows, which is a array of JSONObjects. These objects contains the list of properties of all alarms. In that alarmId will be available in the key alarmId.NumberAllowed values : Numebers from (0-9) which is the ID of the alarmYes

Sample Response

HTTP Code: 200

[ { "result":{ "message": "Workflow has been triggered successfully."}}
]

Error Response

HTTP Code: 200

{ "error":{ "code": 5194, "message": "Workflow cannot be executed - No device is associated with this alarm."}}
View common error responses
Rate limit: 5 requests per minute. Exceeding this limit will block requests for 1 minute

Settings

getCategoryList

Lists all the available device categories

HTTP Method

POST

API URL

https://localhost:8060/api/json/device/getCategoryList?apiKey=***************

Parameters

Param NameDescriptionData TypeAdditional InformationIs Mandatory
apiKeyAPI Key to access your OpManager server.String-Yes
getDefaultCatOnlyIf true, returns only the default categories instead of all available categoriesBoolean-No
excludeUnknownExcludes Unknown CategoryBoolean-No
excludeStorageExcludes Storage categoryBoolean-No
excludeWLCExcludes Wirless LAN Controller categoryBoolean-No
excludeIPMIExcludes IPMI categoryBoolean-No
excludeAPExcludes Wireless Access Point categoryBoolean-No
excludeUCSExcludes UCS categoryBoolean-No
excludeSDWANExcludes SDWAN categoryBoolean-No
excludeMerakiExcludes Meraki categoryBoolean-No

Sample Response

HTTP Code: 200

{ "Wireless": "Wireless", "Server": "Server", "UCS": "UCS", "WirelessLANController": "Wireless LAN Controller", "DomainController": "DomainController", "Printer": "Printer", "IoT": "IoT", "MerakiRadio": "Meraki Radio", "Unknown": "Unknown", "MerakiCellularGateway": "Meraki Cellular Gateway", "UPS": "UPS", "WirelessAccessPoint": "Wireless Access Point", "MerakiVision": "Meraki Vision", "SDN": "SDN", "TapeLibrary": "TapeLibrary", "PDU": "PDU", "IPMI": "IPMI", "MerakiSwitch": "Meraki Switch", "FCSwitch": "FCSwitch", "LoadBalancer": "Load Balancer", "Router": "Router", "RAID": "RAID", "Firewall": "Firewall", "Storage": "Storage", "Desktop": "Desktop", "Switch": "Switch", "MerakiController": "Meraki Controller", "MerakiSecurity": "Meraki Security", "WANAccelerator": "WAN Accelerator"}
Rate limit: 200 requests per minute. Exceeding this limit will block requests for 1 minute

Thank you for your feedback!

Was this content helpful?

We are sorry. Help us improve this page.

How can we improve this page?
Do you need assistance with this topic?
By clicking "Submit", you agree to processing of personal data according to the Privacy Policy.

Thank you for your feedback!

Was this content helpful?

We are sorry. Help us improve this page.

How can we improve this page?
Do you need assistance with this topic?
By clicking "Submit", you agree to processing of personal data according to the Privacy Policy.