VeloCloud SD-WAN Monitoring in OpManager
OpManager's SD-WAN monitoring capability delivers end-to-end visibility into the health, availability, and performance of your VeloCloud SD-WAN environment. Edge devices, paths, and WAN links can all be tracked in real time, enabling you to maintain optimal network performance and minimize downtime.
- Discovering VeloCloud SD-WAN devices
- Viewing the SD-WAN snapshot page
- Monitoring SD-WAN devices
- Managing SD-WAN paths
- Managing WAN Links
- Decommissioning SD-WAN devices
- Rediscovering SD-WAN devices
- Generating advanced reports
Discovering VeloCloud SD-WAN devices
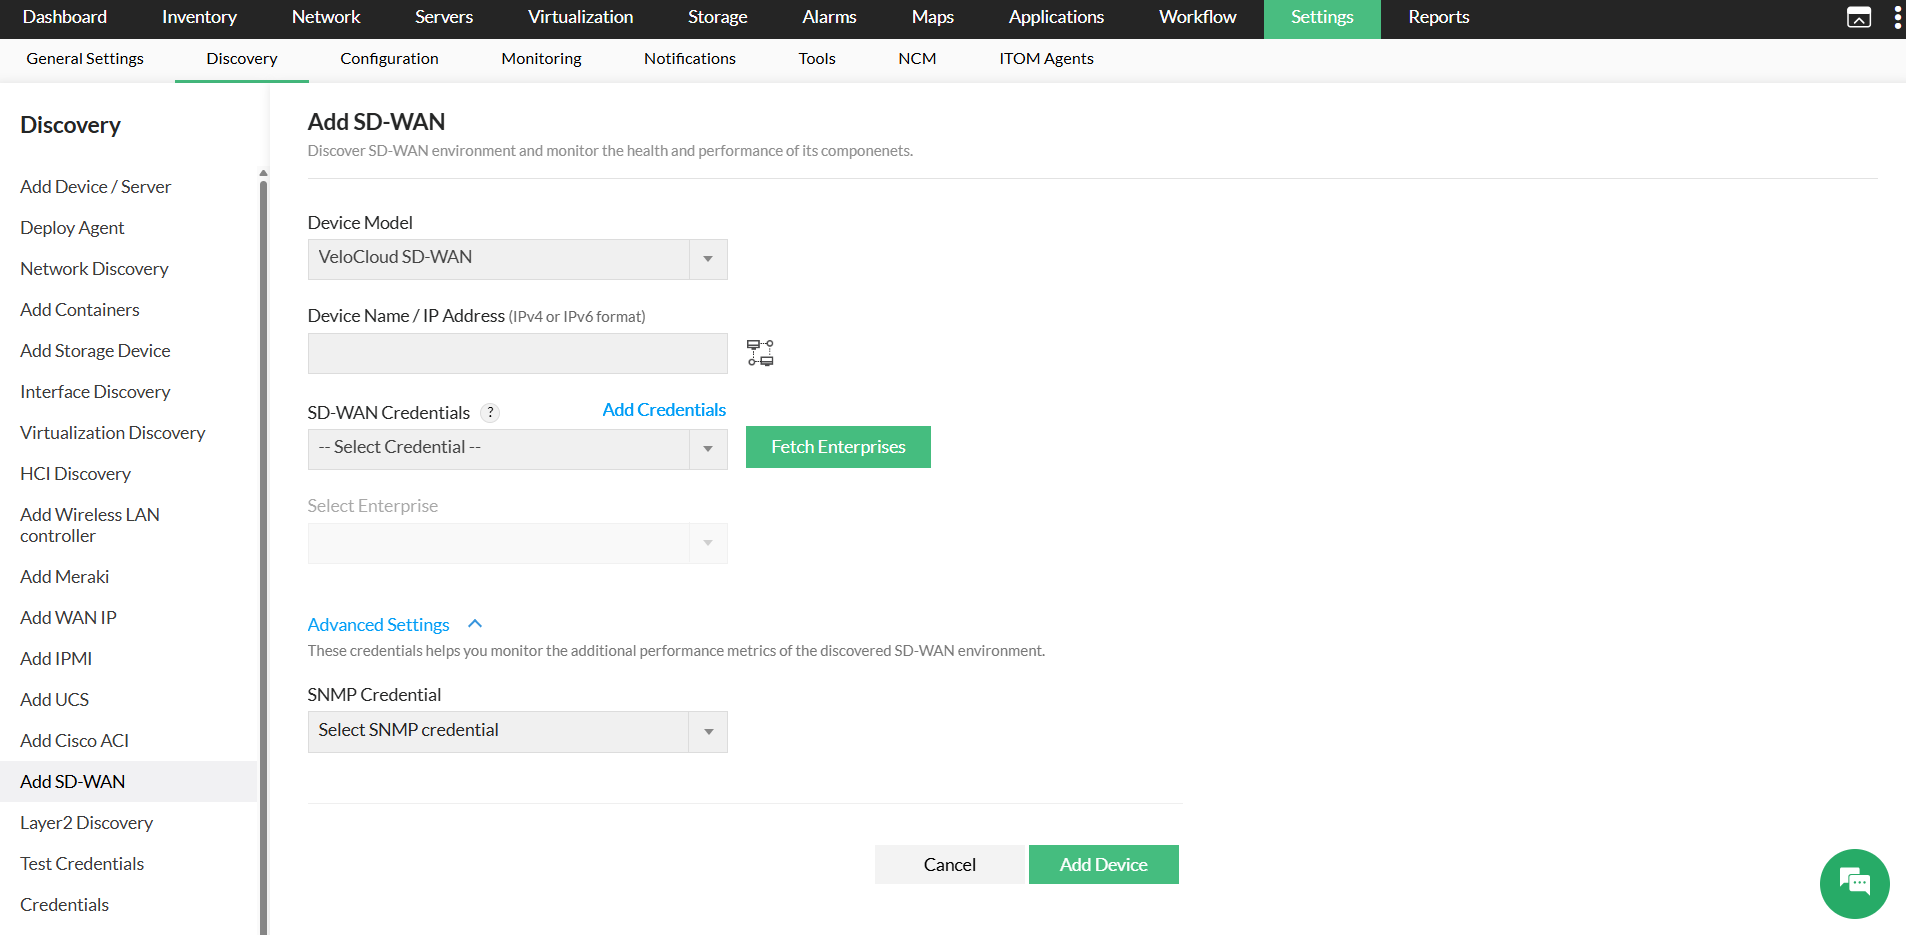
Follow the steps below to add and begin monitoring your VeloCloud SD-WAN devices in OpManager:
- Go to Settings → Discovery → Add SD-WAN.
- Under Device Model, choose VeloCloud SD-WAN from the drop-down menu.
- Provide the IP address or hostname of the SD-WAN controller in the Device Name / IP Address field.
- Pick the relevant SD-WAN credentials (Username and Password or API Key) from the drop-down , or select Add Credentials to configure a new set, then click Fetch Enterprises.
- From the Select Enterprise drop-down that populates, choose the appropriate enterprise.
- Optionally, expand Advanced Settings and assign an SNMP credential to enable collection of additional performance metrics.
- Click Add Device to begin the discovery process.
When discovery completes, OpManager automatically brings the edge devices, paths, and WAN links into its inventory for ongoing monitoring.
Viewing the SD-WAN snapshot page
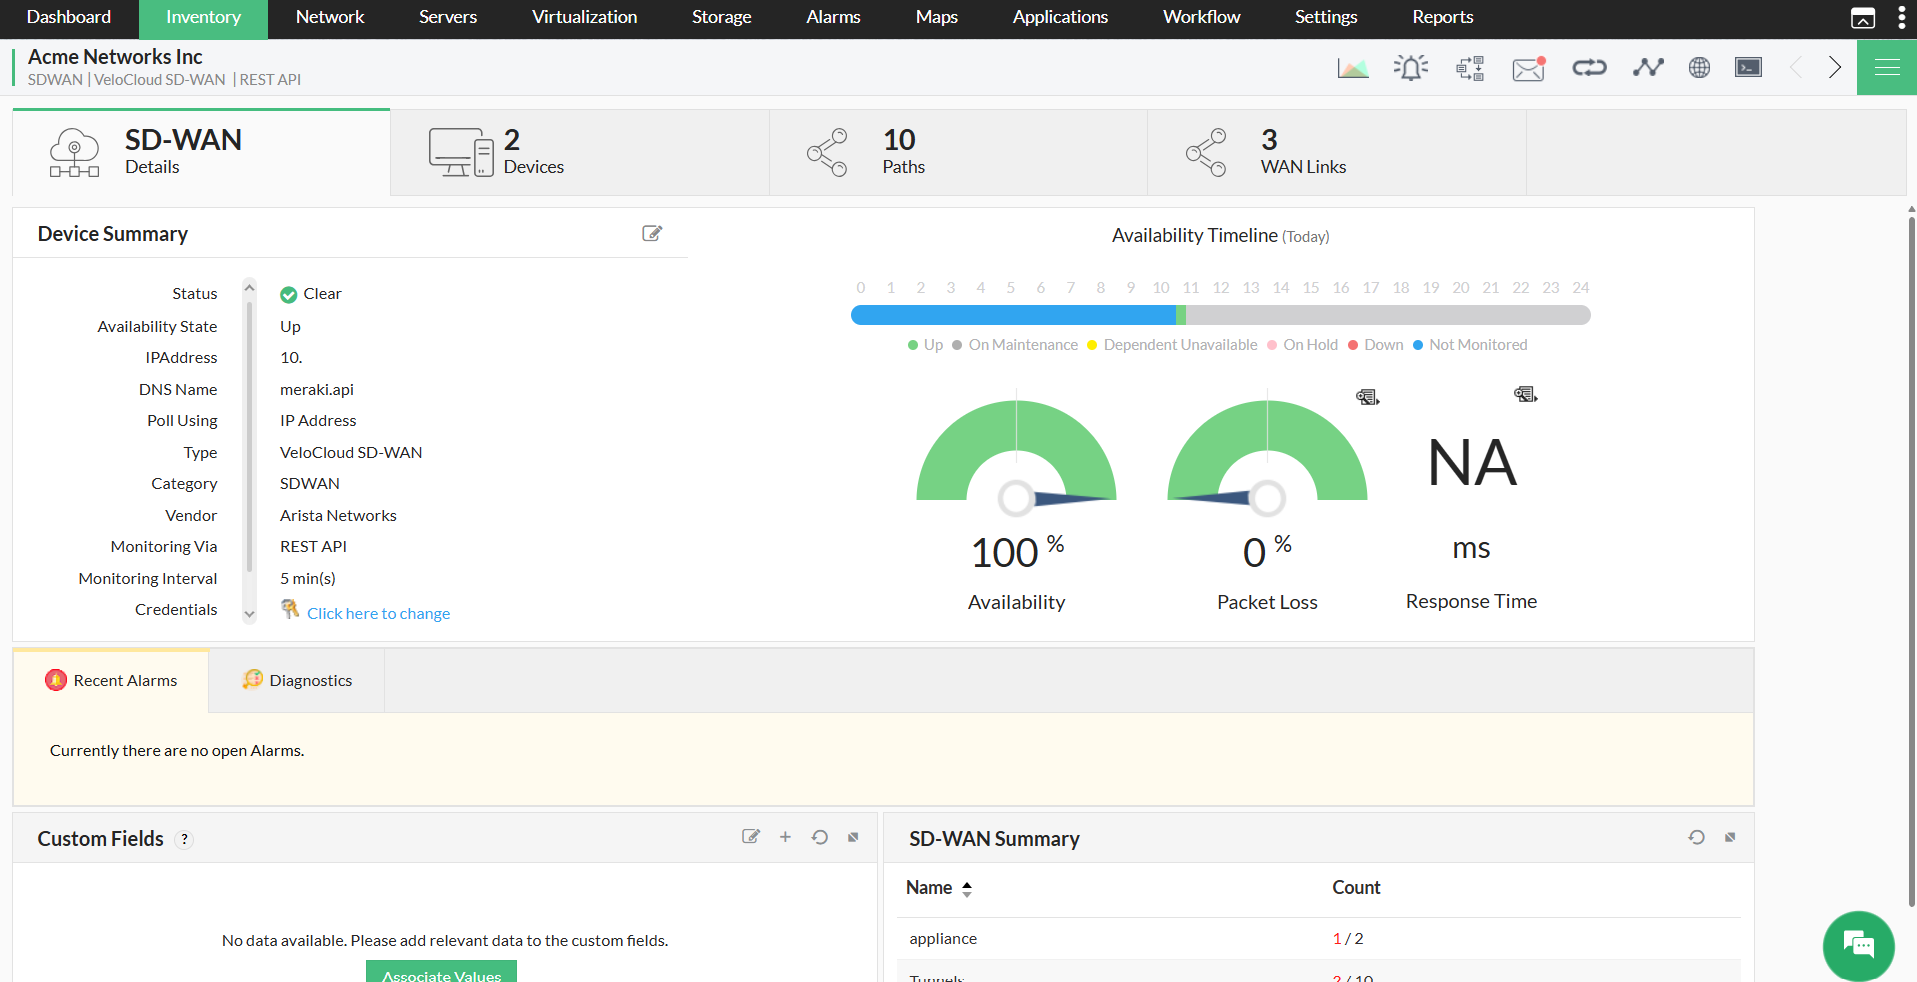
The snapshot page offers a unified view of your discovered VeloCloud SD-WAN device along with its key performance data.
To access the snapshot page:
- Navigate to Inventory or Network.
- Select the desired SD-WAN device.
The snapshot page displays:
- Basic Device Details - Core attributes including IP address, DNS name, device type, category, vendor, and polling interval.
- Status & Availability - Current device state alongside availability percentage, packet loss, and response time metrics.
- SD-WAN Summary - A top-level count of appliances, tunnels, and WAN links associated with the device.
- Availability Timeline - A day-view chart reflecting Up, Down, On Maintenance, and related states over time.
- Recent Alarms - Any currently open alarms tied to the device.
Monitoring SD-WAN devices
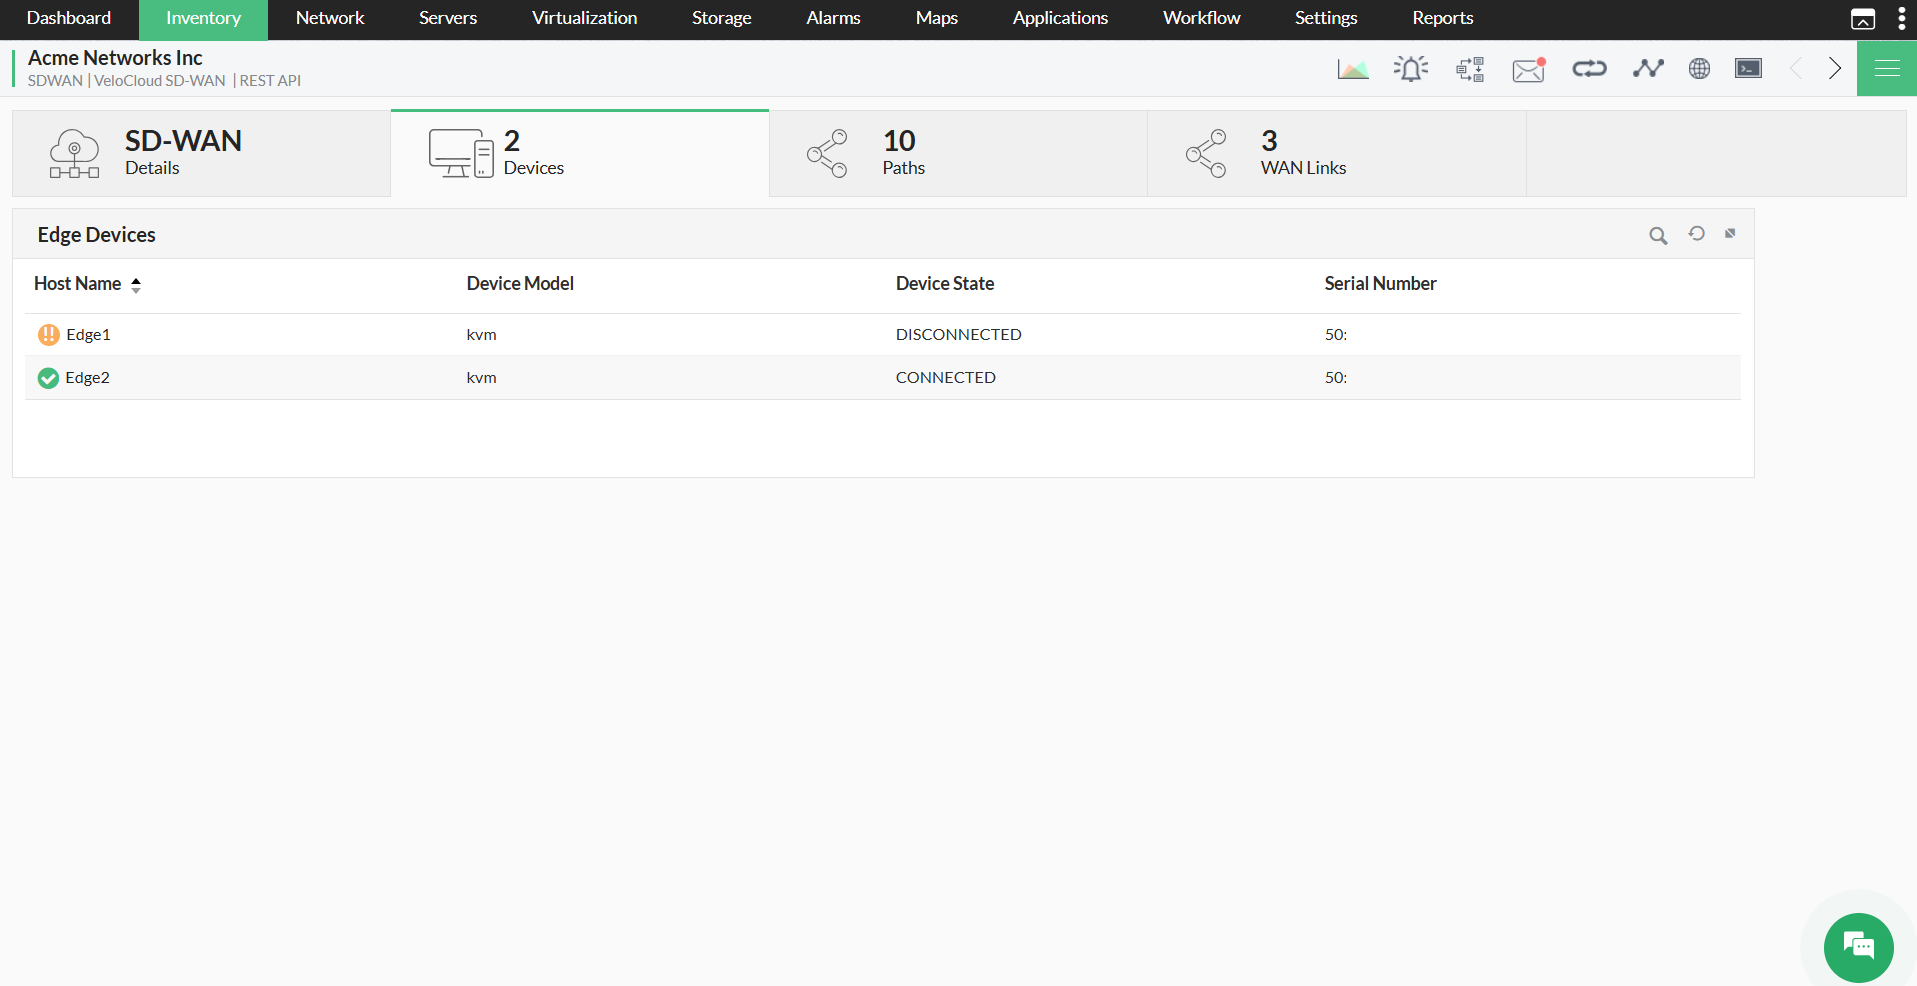
The Devices tab on the snapshot page lists all edge devices found during discovery.
The following details are shown for each edge device:
- Host Name - The assigned name of the edge device.
- Device Model - The underlying hardware or virtualization platform (e.g., kvm).
- Device State - Current operational condition of the device (e.g., Active, Degraded, Offline).
- Serial Number - The manufacturer-assigned identifier for the device.
Managing SD-WAN paths
Paths are virtual links that connect SD-WAN edge devices to remote endpoints such as Gateways. Keeping tabs on path performance helps guarantee consistent and efficient data delivery across your network.
Performing path actions:
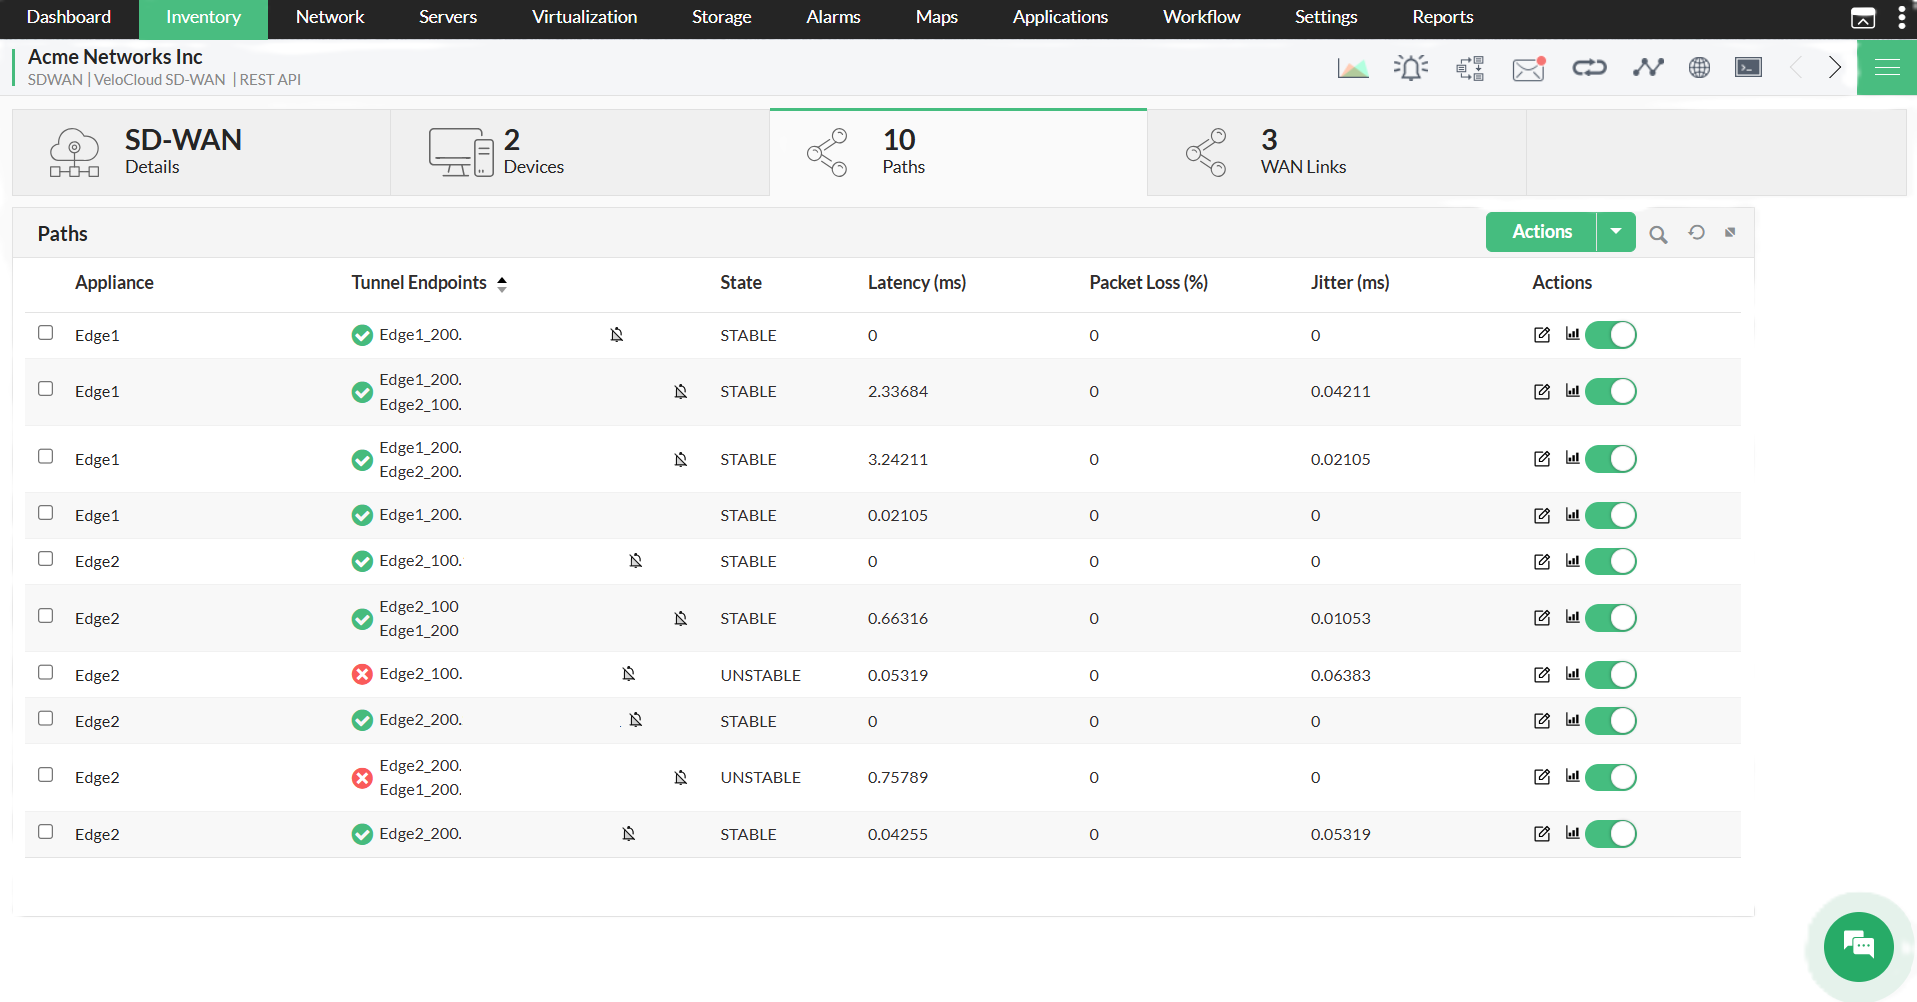
Using the Actions button at the top-right of the Paths tab, you can:
- Define performance thresholds and configure alert rules for path metrics.
- Bulk manage or unmanage path endpoints.
- Suppress or clear alarm suppression as needed.
- Adjust thresholds and pull up performance graphs for individual paths.
Viewing path details:
Navigate to the Paths tab from the SD-WAN snapshot page. The Paths section displays the following key metrics:
- Appliance - The edge device on which the path's local endpoint resides.
- Tunnel Endpoints - The two endpoints; source and destination, that the path connects.
- State - Reflects whether the path is Stable, Degraded, or Down.
- Latency (ms) - Round-trip delay across the path in milliseconds.
- Packet Loss (%) - Share of packets dropped during transmission.
- Jitter (ms) - Degree of fluctuation in packet delivery timing.
Managing WAN Links
WAN links are the physical or virtual interfaces through which SD-WAN edge appliances connect to the broader network. Tracking their status helps maintain steady connectivity throughout your deployment.
Performing WAN link actions:
Via the Actions button on the WAN Links tab, you can:
- Bulk manage or unmanage WAN links.
- Toggle alarm suppression on or off for selected links.
Viewing WAN link details:
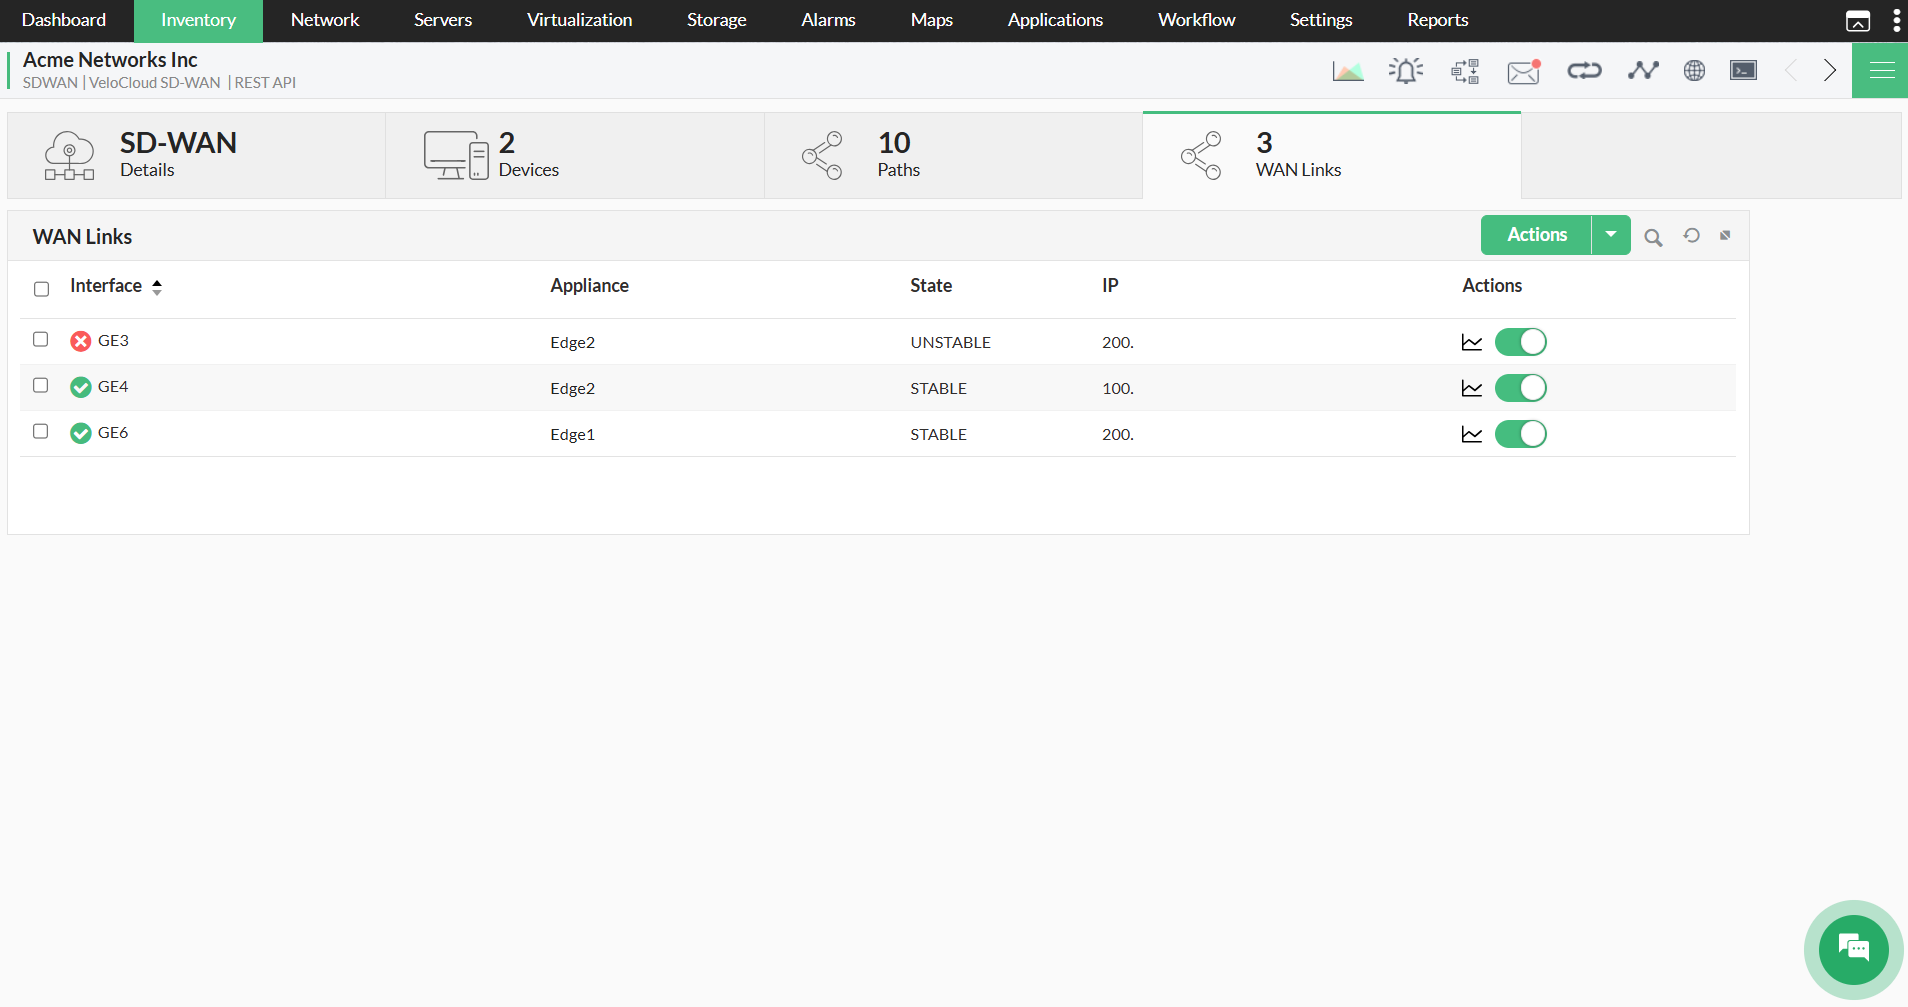
Select the WAN Links tab from the device snapshot page to view:
- Interface - The identifier of the WAN-facing interface on the edge device.
- Appliance - The edge device to which the WAN link belongs.
- State - The link's current status (e.g., Stable, Unstable, Down).
- IP - The IP address bound to the WAN interface.
Decommissioning SD-WAN devices
When a VeloCloud SD-WAN device is being retired or has reached End of Life (EOL):
- Set the device to Unmanaged within OpManager.
- A decommissioning alert will fire automatically, informing administrators of the change.
This keeps your inventory clean and reflective of your active infrastructure.
Note: Removing a device from OpManager will also permanently delete all paths and WAN links associated with it.
Rediscovering SD-WAN devices
Use rediscovery to sync OpManager with any hardware changes, interface modifications, or configuration updates on a VeloCloud device:
- Open the relevant device snapshot page.
- Click the menu icon in the top-right corner and choose Rediscover Device.
- Select an existing credential or add a new one.
- Click ReDiscover Now.
OpManager will pull updated device data and revise its inventory records to reflect the latest state.
Generating advanced reports
The Advanced Report feature in OpManager lets you build tailored reports using VeloCloud SD-WAN performance data. To get started:
- Navigate to Reports → OpManager → Advanced Report.
- Select Create New Report from the top-right corner.
- Set the Module Type to SD-WAN.
- Apply any filters, performance monitors, and grouping preferences.
- Save and run the report.
Click here for the steps on building advanced reports in OpManager.