Trusted by over 15,000 happy customers globally
How does OpManager monitor IBM storage?
OpManager uses IBM's storage APIs and network protocols like SNMP to monitor your IBM RAIDs, Distributed RAIDS (DRAIDs) virtual controllers, and tape libraries. OpManager automatically discovers and classifies IBM's popular storage solutions and supports 30+ dedicated storage performance monitors out-of-the-box.
Storage capacity
Monitor the capacity of your IBM storage at the disk level, the storage pool level, and the volume level. Set alarms for capacity utilization levels and leverage ML to predict storage capacity exhaustion.
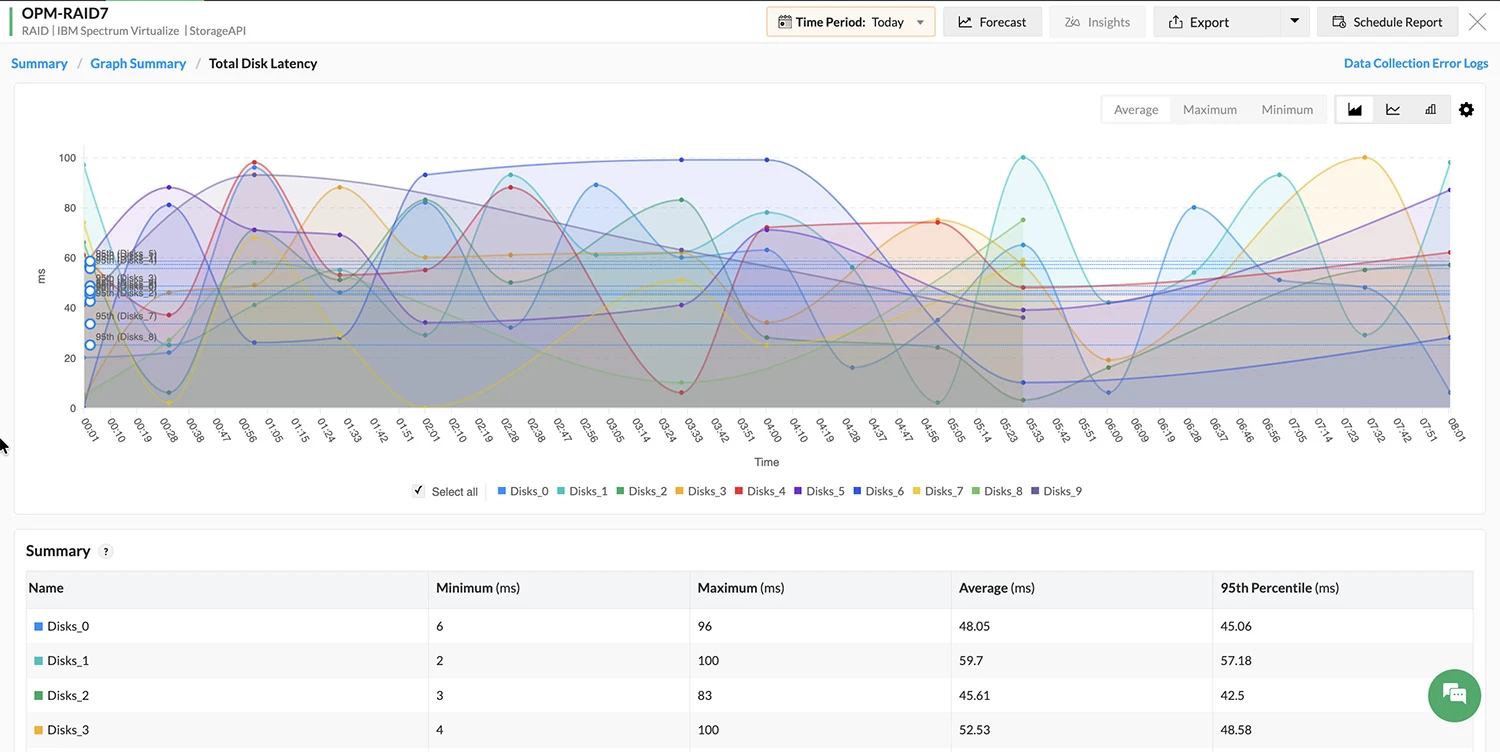
Disk latency & IOPs
Track the latency of back-end storage operations with metrics like Input/Output operations per second (IOPS), Read/Write latency, and Read/Write throughput across your managed disks (MDisks), and nodes.
Storage throughput
Keep tabs on the network congestion and traffic utilization between your servers and storage appliances by monitoring the throughput of your iSCSI ports, Fiber Channel (FC) ports, and network interfaces.
Storage disks
OpManager gives you visibility into the NVMe, SSD, and HDD drives inside your chassis as well as your managed disks (MDisks) in your DRAIDs. You can monitor the disk capacity utilization, status, IOPs, latency, and throughput.
LUNs, volumes & storage pools
OpManager automatically classifies the LUNs in your storage infrastructure to give you visibility into the volumes and storage pools. You can also track the storage host details as well as the host-vdisk connections.
Hardware health
Ensure optimal hardware health for your IBM storage infrastructure by tracking the status of Ethernet ports, FC ports, SAS ports, Nodes, Chassis, Power supply units, Batteries, and cooling fans.
Popular IBM storage solutions monitored by OpManager
IBM storage virtualize & FlashSystems
OpManager uses IBM's storageAPI to monitor IBM's storage virtualize and the latest FlashSystem RAIDs that use storage virtualize software. You can track key performance indicators like:
- Capacity, free capacity, and used capacity at all levels of storage
- Operational status of all logical and physical components
- IOPs, Latency, throughput, read, and write operations
- Hardware assets like controllers, ports, nodes, power, battery, etc
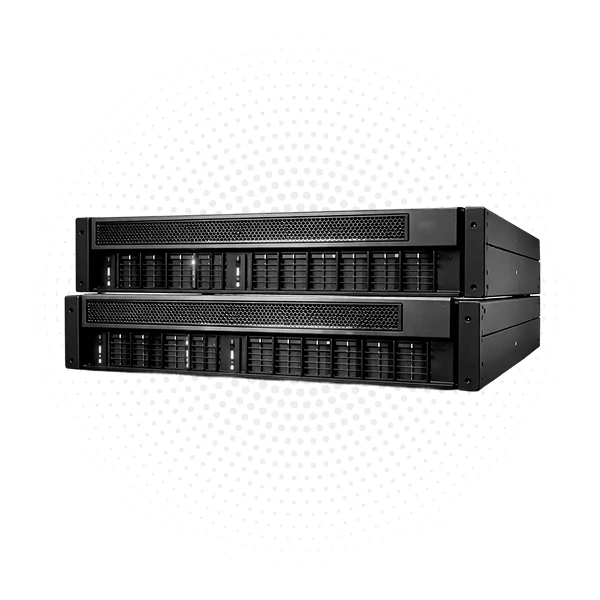
IBM DS series storage
OpManager leverages the industry standard Storage Management Initiative (SMI) protocol to monitor IBM's DS series. You can track key performance indicators like:
- Total, used, and free capacity, capacity utilization, disk status, and disk health
- IOPS, reads and writes of logical volumes
- Traffic utilization of storage interfaces
- Hardware assets like ports, disks, and batteries
IBM tape libraries
Tape libraries are gaining relevancy in the modern market due to their cold data storage capabilities, sustainable energy usage, and cost-effectiveness. OpManager offers support for IBM's tape library models like: IBM 3584, TS3100, and TS3200. You can monitor:
- Mechanical performance metrics like Library moves, fetches, stows, and retries
- Drive usage metrics like the drive motion hours, whether the drive needs to be cleaned, or the number of times a tape was inserted into the drive
- Soft and hard errors during read or write operations in the drive
IBM storage monitoring with OpManager: A quick walk-through
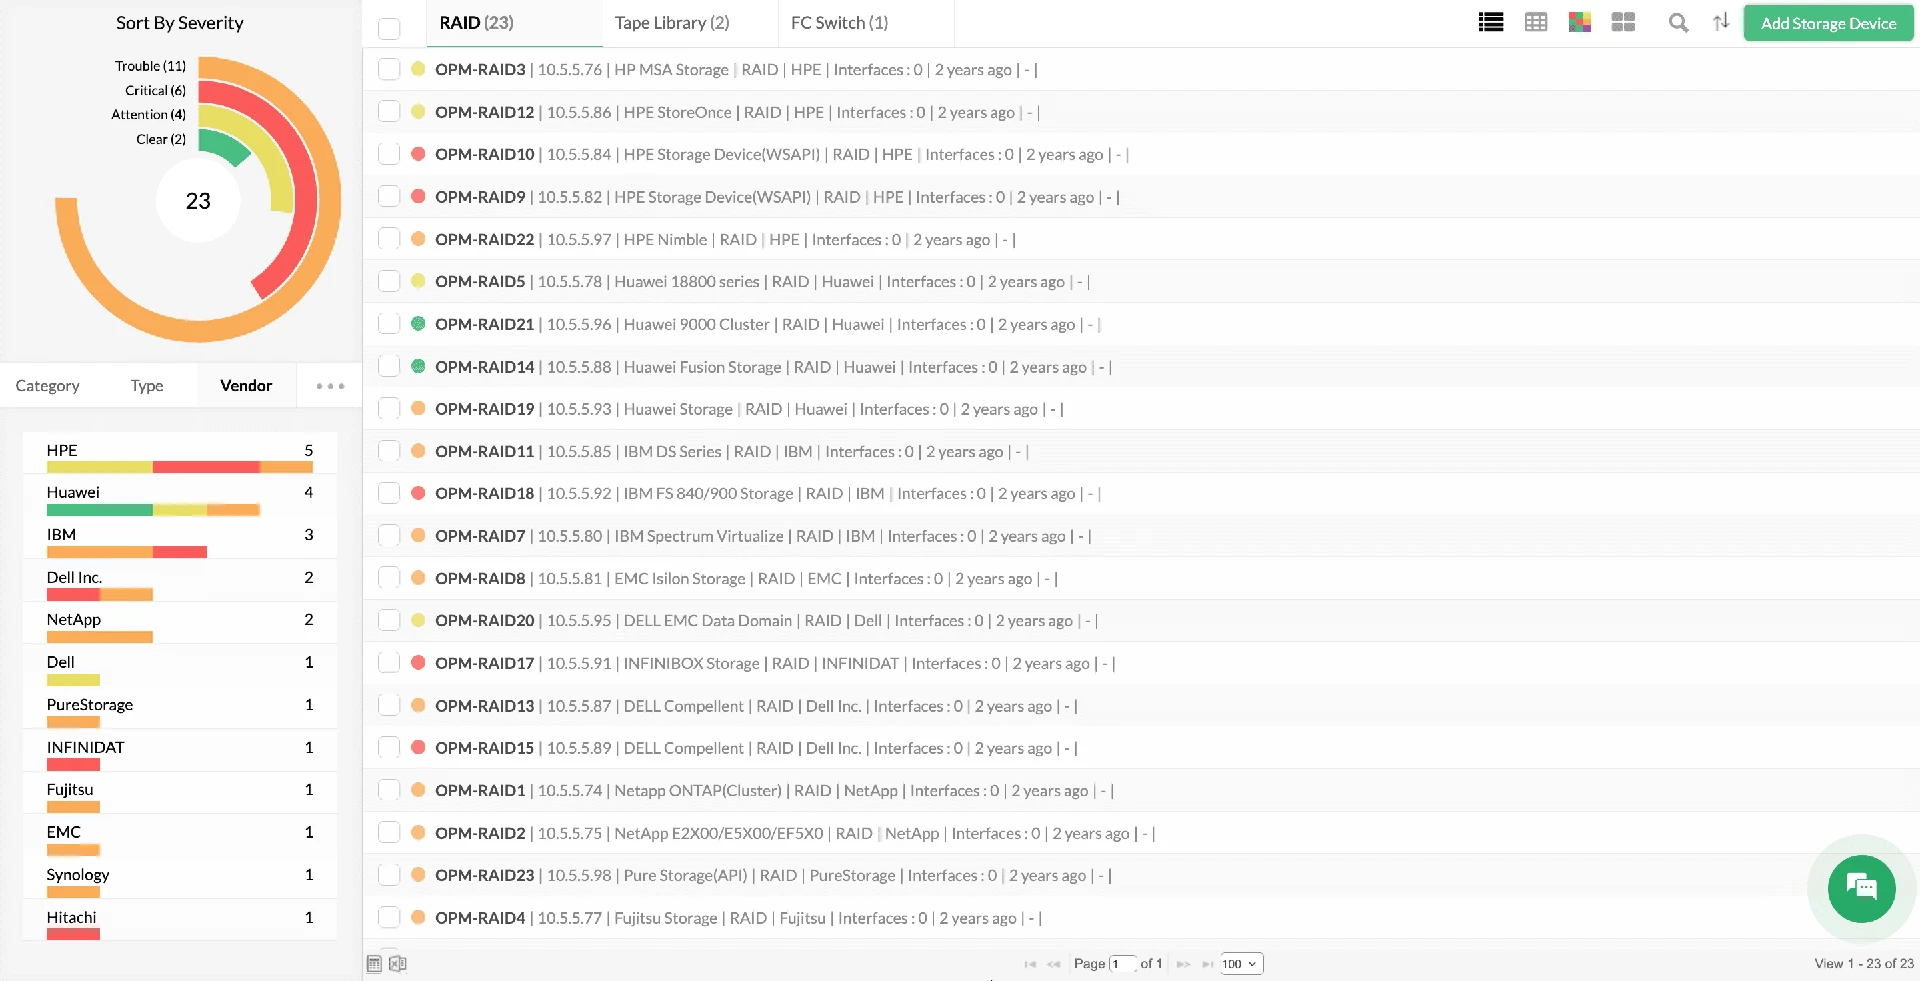
Storage discovery and classification
Discover and categorize IBM RAID arrays, distributed RAIDs (DRAIDs), and tape systems effortlessly using pre-configured device templates. OpManager automatically identifies and classifies your storage appliances, auto-assigning performance monitors to ensure your IBM storage architecture is fully instrumented the moment it's added to your monitoring inventory.
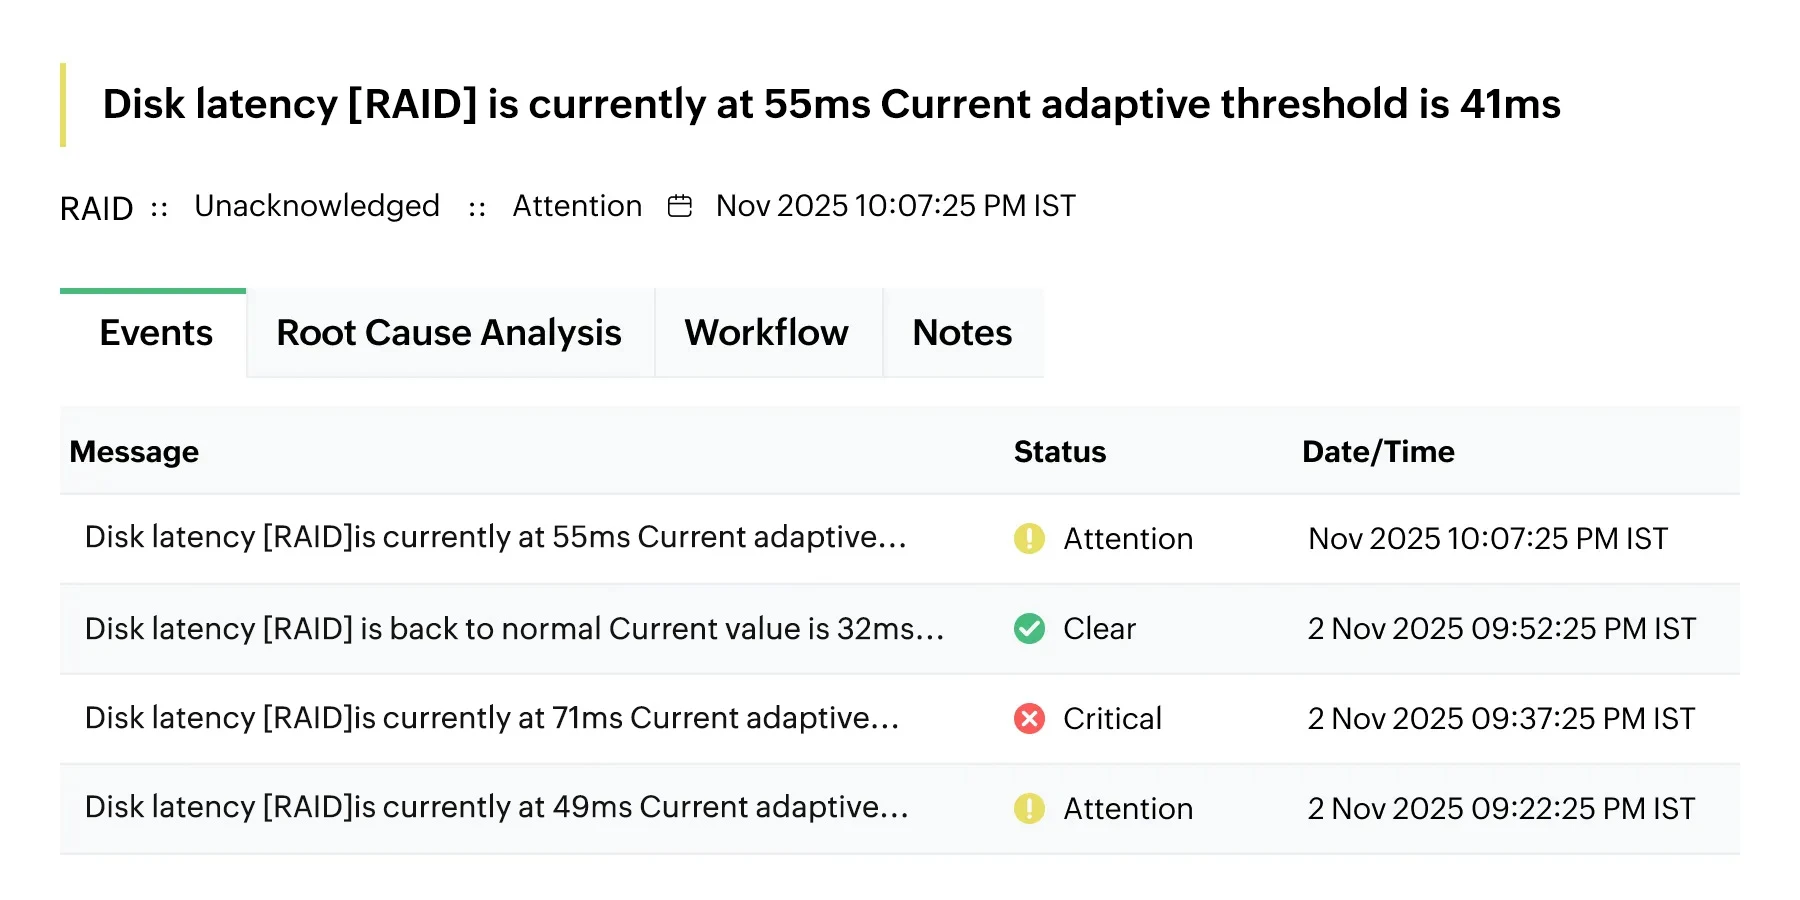
Monitoring key performance indicators
Track key IBM storage metrics like latency, throughput, and IOPS with multi-level threshold configurations. Utilize ML-driven adaptive thresholds to establish dynamic performance baselines and filter out false positives, generating context-rich alerts that isolate bottlenecks before storage degradation affects your business applications.
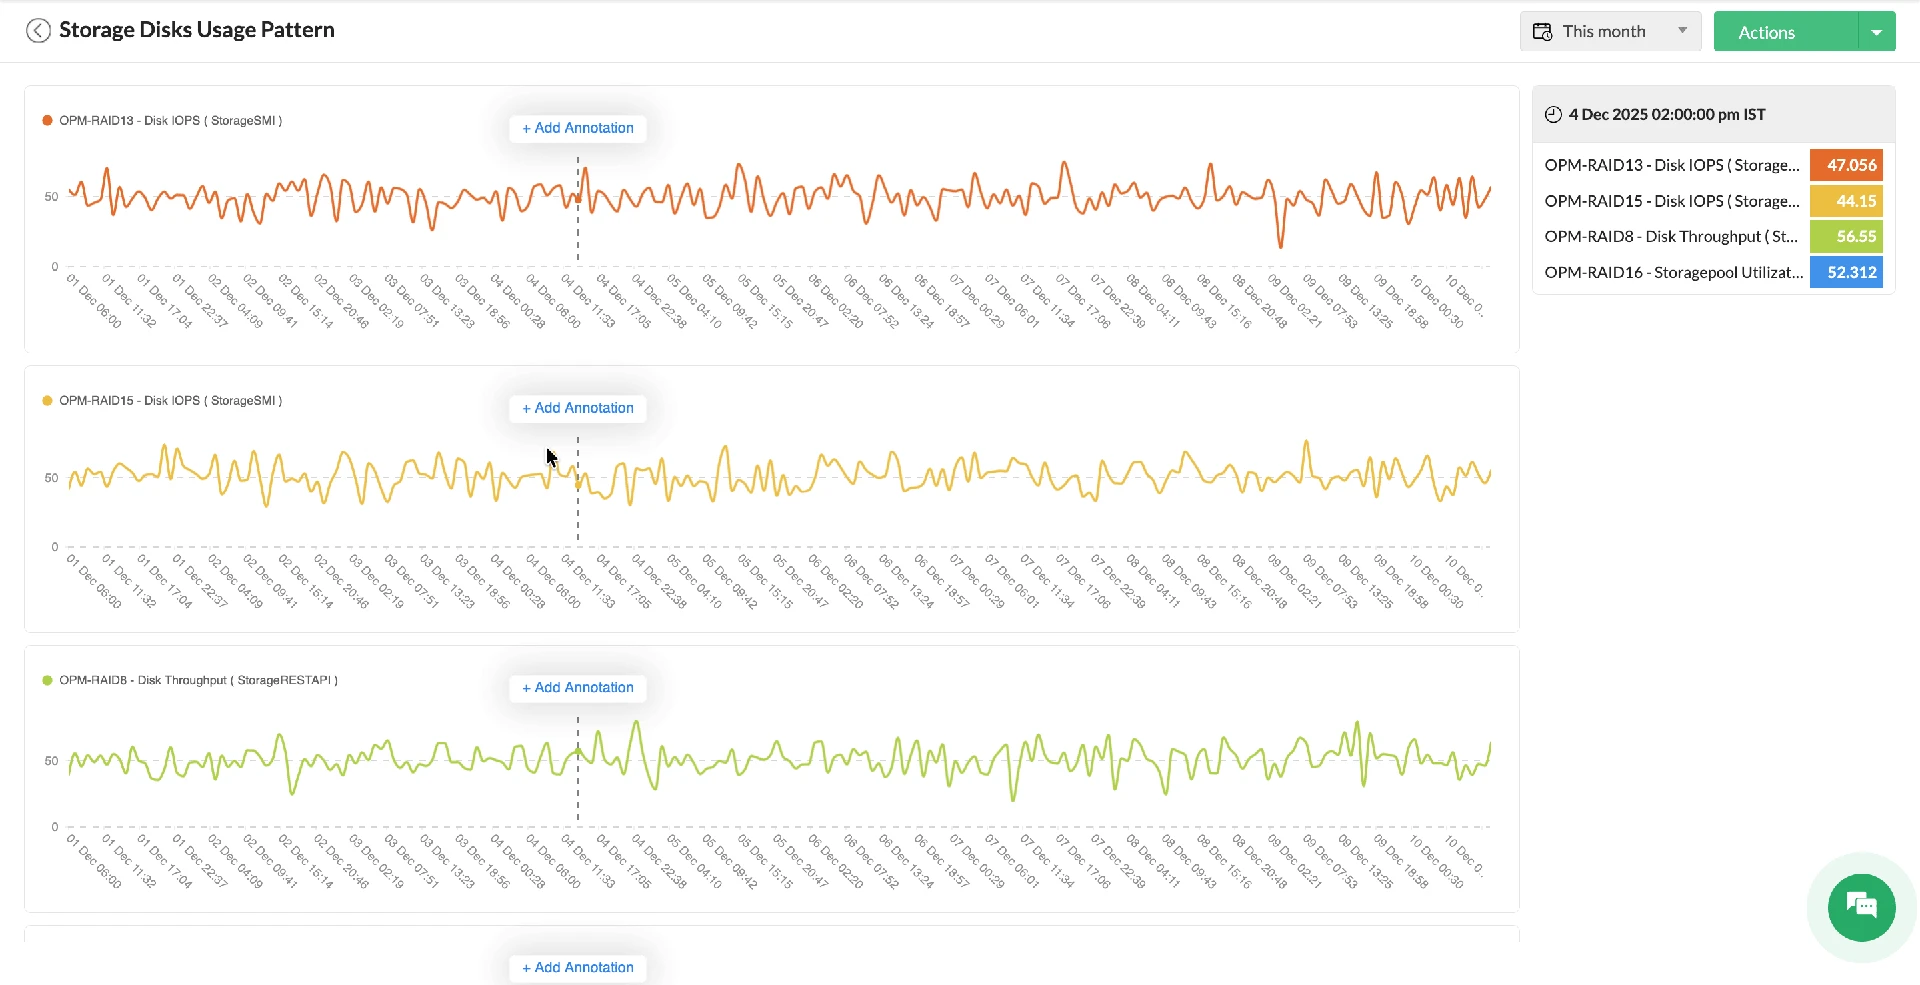
Root cause analysis and identification
Map intricate dependencies across IBM arrays, LUNs, and volumes using dynamic maps. Expedite root cause analysis by overlaying performance metrics (like CPU utilization and disk latency) onto a unified timeline to correlate anomalies and isolate the primary source of storage congestion in real time.
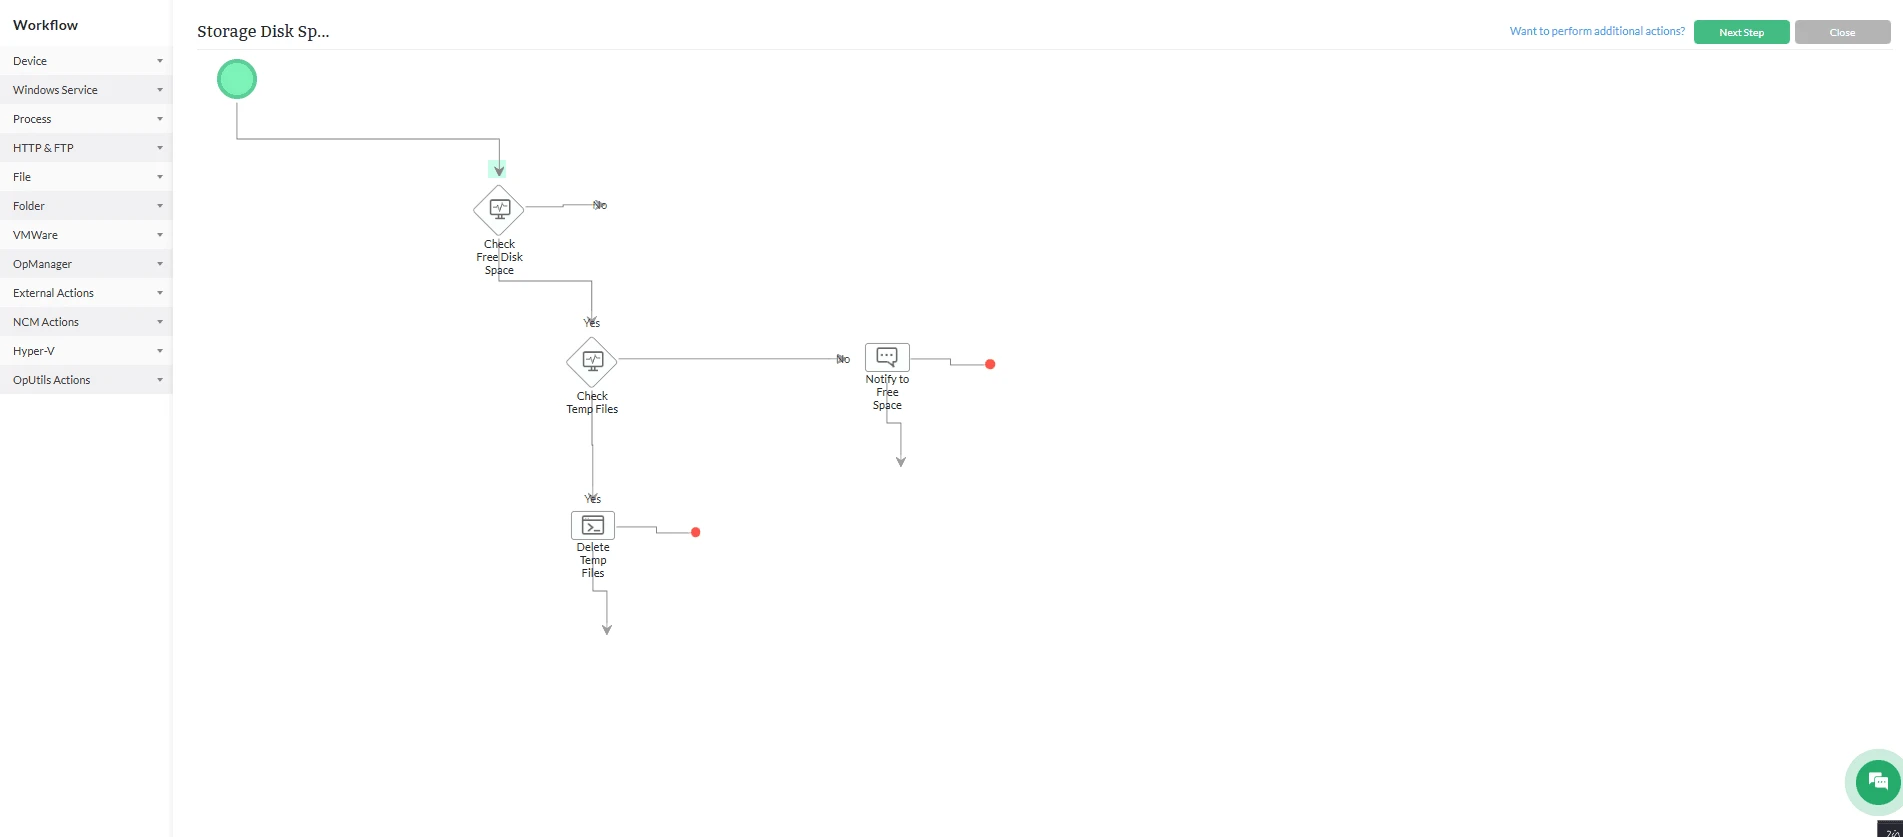
Automated IT incident response
Streamline operations and eliminate repetitive manual tasks by utilizing a code-free, drag-and-drop workflow builder equipped with 70+ out-of-the-box actions. Automatically trigger remediation actions the instant a storage alert occurs, significantly lowering your Mean Time to Repair (MTTR).
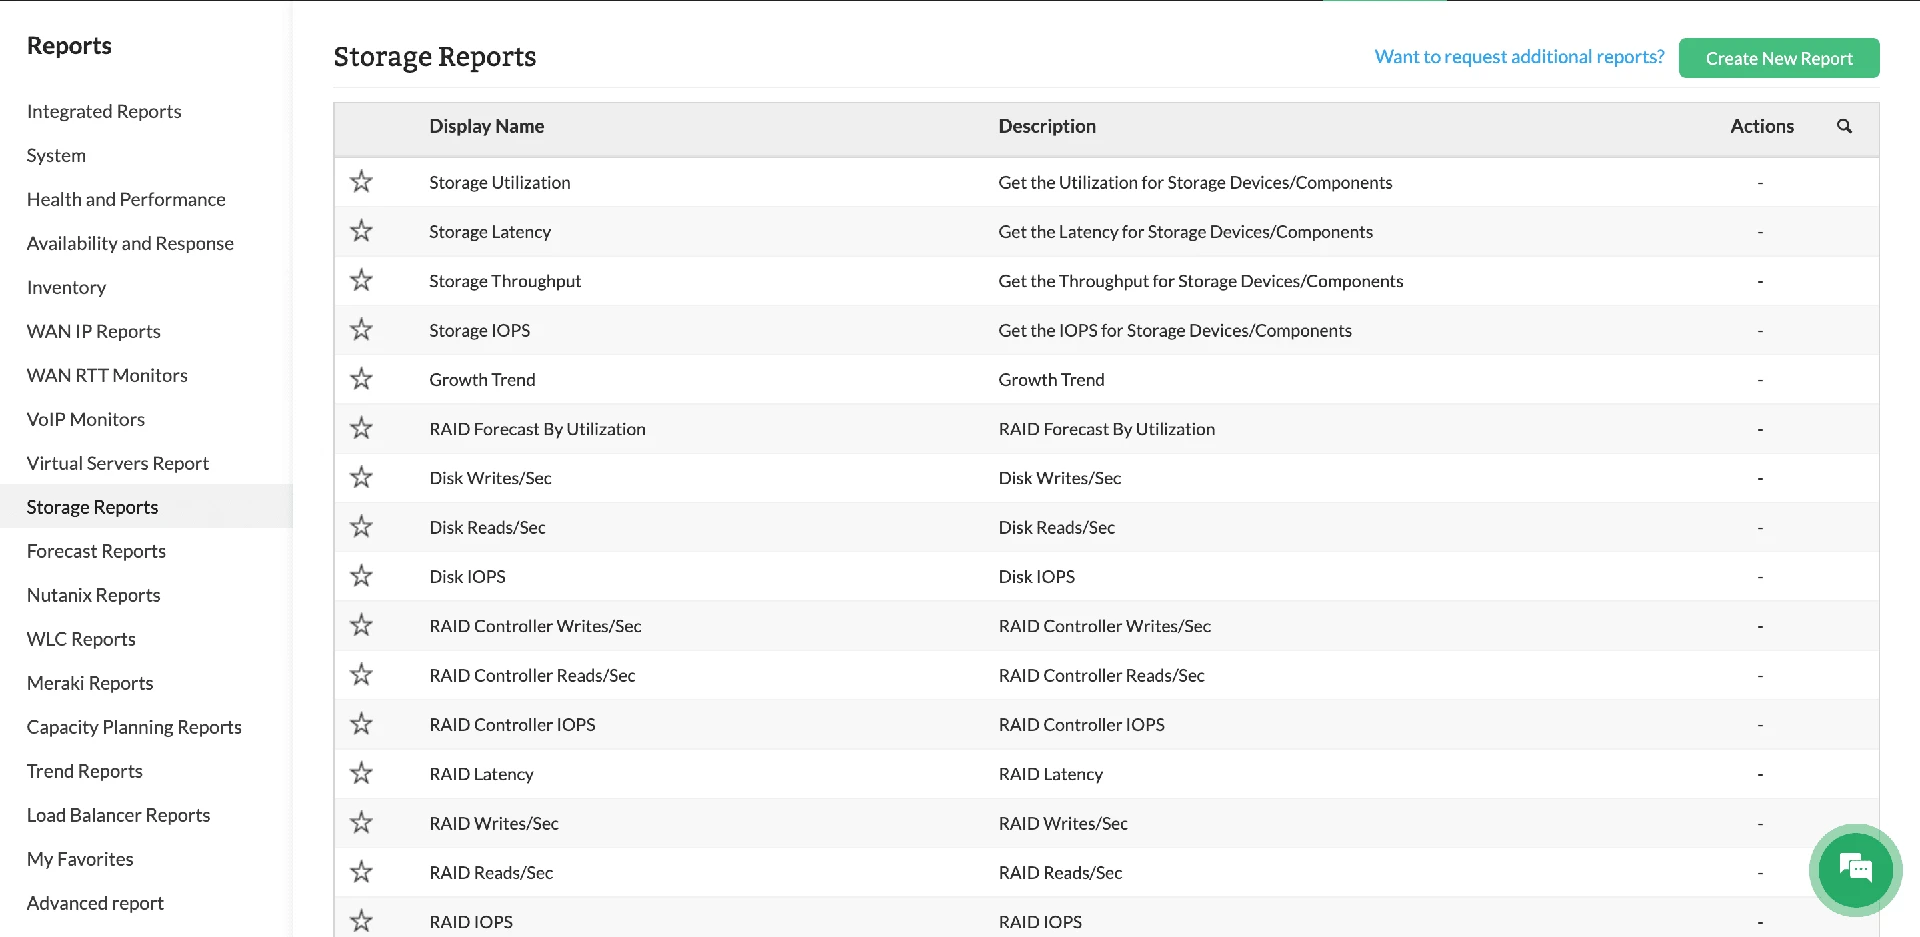
Dedicated storage monitoring reports
Achieve comprehensive oversight with dedicated storage dashboards and over 18 pre-configured reports tailored for capacity planning and health auditing. Tailor custom widgets to monitor specific volumes or LUNs, and produce scheduled reports to validate SLAs and forecast future storage growth requirements with precision.
Machine learning-driven monitoringfor IBM storage
ML-Driven threshold management
Automate the calculation, configuration, and refinement of alarm thresholds using a native ML engine. OpManager continuously aggregates performance data, dynamically calculates alarm thresholds, and performs hourly updates across all monitored performance metrics. This eliminates manual effort for threshold maintenance, enhances monitoring accuracy, and minimizes false positives.
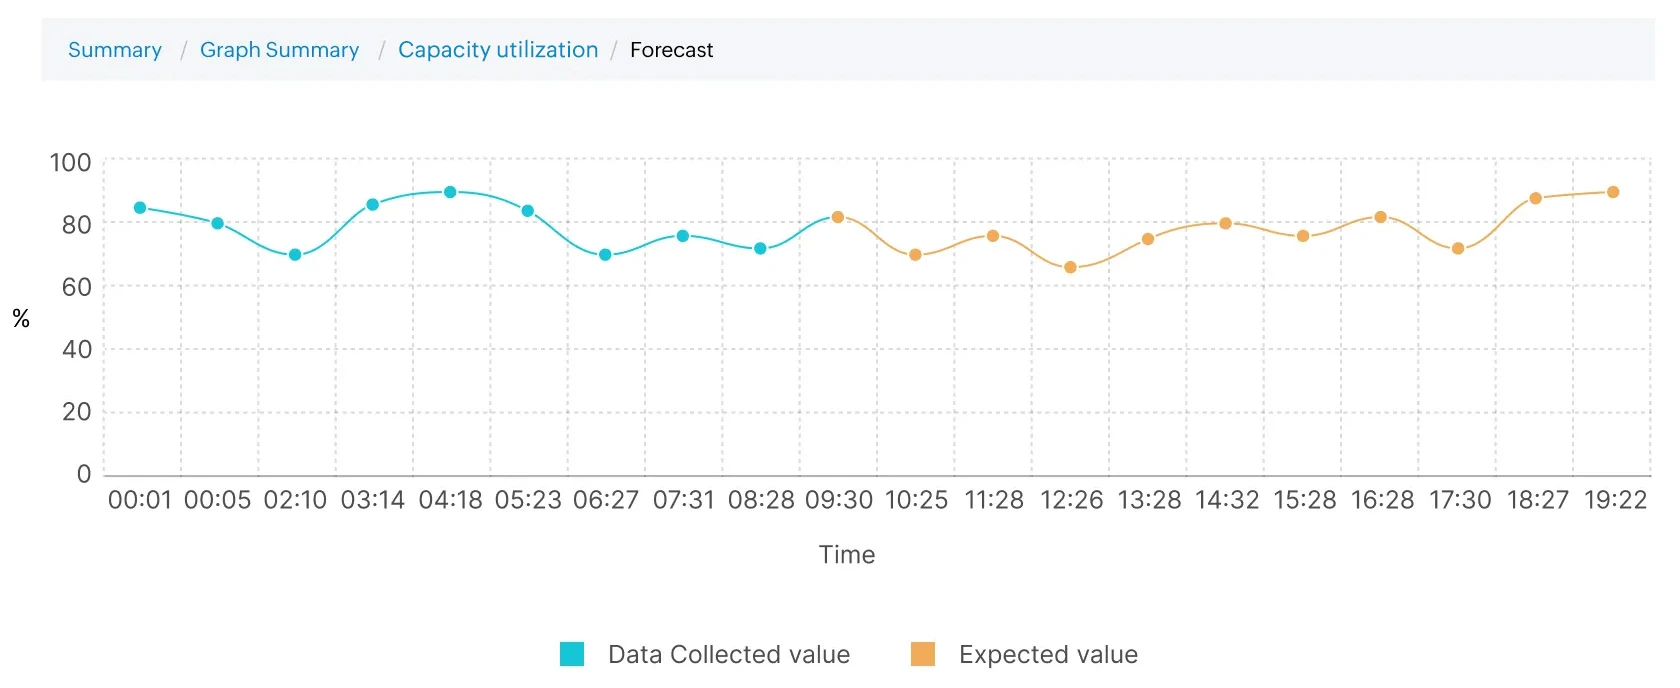
Storage performance trend forecasting
Project storage performance trends into the future utilizing advanced ML algorithms. Proactively prepare for impending resource crunches, isolate bottlenecks, and preempt storage performance issues by analyzing historical trajectories of critical metrics like CPU, latency, and throughput.
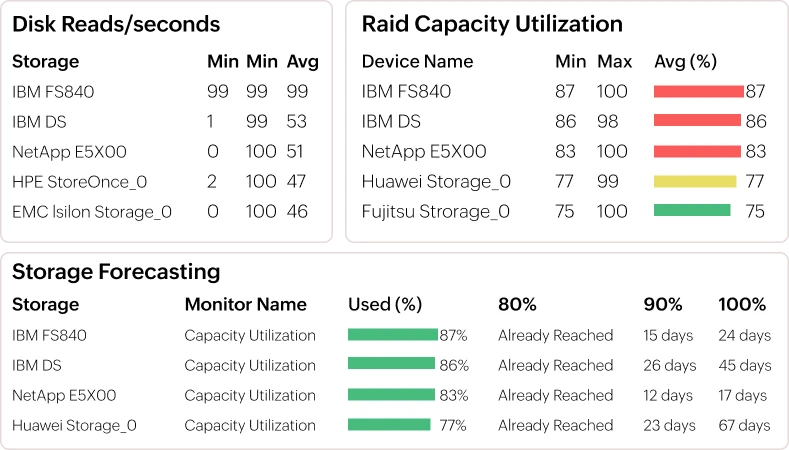
Predictive capacity utilization analytics
Leverage dedicated forecast reports to identify hardware recording higher resource utilization. Forecast reports track CPU, memory, and storage space to precisely calculate the number of days left before consumption hits 80%, 90%, and 100% of available capacity, allowing for data-driven capacity utilization.
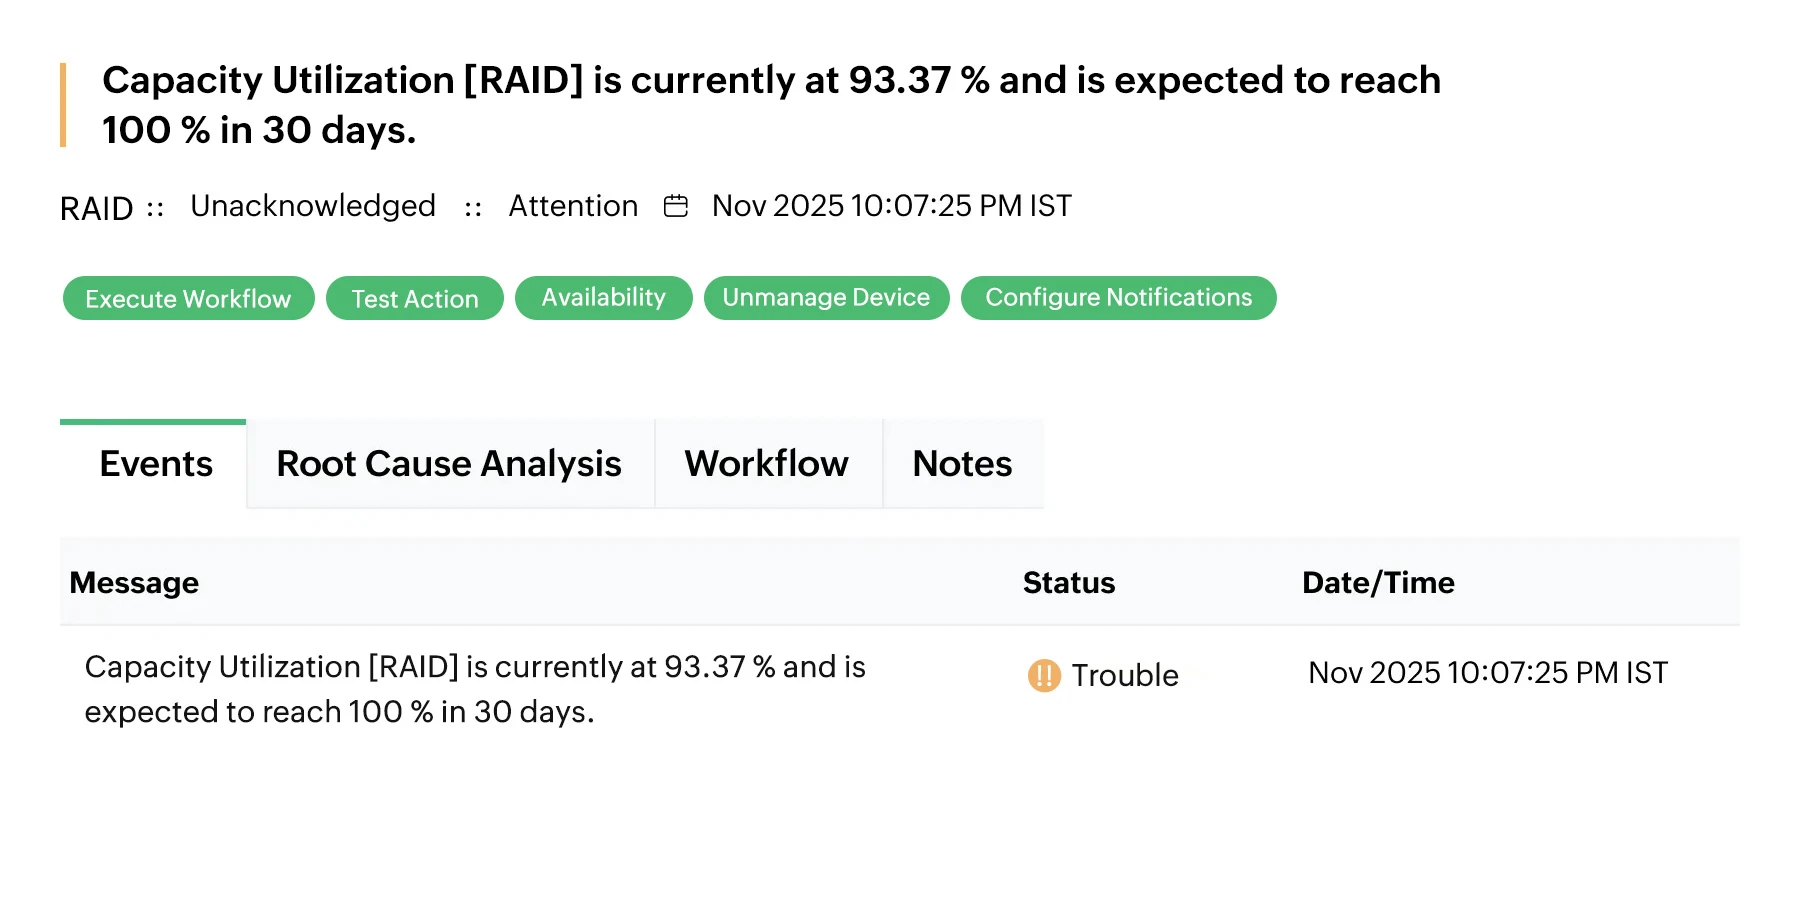
Proactive storage capacity alerting
Maintain visibility over IBM storage capacity with OpManager's forecast alarms. OpManager triggers proactive alerts when predictive forecasting analysis determines that storage capacity is projected to breach critical utilization thresholds within a defined timeframe, enabling proactive remediation.
Why choose OpManager for IBM storage monitoring?
Multi-Vendor ecosystem support
Seamlessly integrate IBM monitoring into existing multi-vendor setups to achieve a fluid, unified storage monitoring experience. This interoperability ensures consistent oversight across disparate storage environments within a single pane of glass.
Extensible Third-Party Integration
Leverage third-party apps, including help desk and service management tools, to consolidate and streamline network management tasks. By bridging the gap between monitoring and ITSM, you ensure a synchronized operational workflow.
Real-Time Webhook Support
Utilize real-time webhook notifications to facilitate instant and efficient data flow to external systems. This ensures that critical storage events are immediately propagated to your broader DevOps or SecOps toolstack for rapid response.
Enterprise Scalability & Architecture
Deploy a scalable solution engineered to accommodate diverse environments, from small setups to large enterprise infrastructures. The platform's flexibility ensures it evolves alongside your data center requirements without compromising performance.
Comprehensive storage monitoring software
OpManager extends its support for 25+ storage vendors in the market and provides dedicated KPIs and tracking for diverse device types and models.
Frequently asked questions
How does OpManager's device templates work for IBM storage monitoring?
OpManager has built-in, tailor-made device templates for IBM vendor storage devices. This is a part of OpManager's 11,000+ pre-configured templates. These device templates are unique for each device model, and once you discover a storage device, OpManager matches it with an existing template and associates monitors with the device as per the device template.
Let's say an IBM FS 840 is added to your network. OpManager instantly identifies the device model, classifies it, and curates a set of KPIs that you can enable with a single click.
Furthermore, you can also automate certain processes with OpManager's discovery rule engine. This allows you to add IBM storage devices to certain groups, set up notification channels for alerts, or to incorporate them into existing network maps.