Amazon Network Management and Delivery monitoring
Efficient network management and content delivery are vital to maintaining responsive, highly available cloud applications. Applications Manager’s Amazon Network Management and Delivery monitoring enables you to track critical AWS services like API Gateway, CloudFront, Route 53, and Elastic IPs — ensuring optimal traffic flow, DNS resolution, and content delivery performance. Gain actionable insights into latency, cache usage, routing behavior, and endpoint availability to enhance application reliability and deliver a superior end-user experience.
- AWS API Gateway monitoring
- AWS CloudFront monitoring
- AWS Region-wise Elastic IP monitoring
- AWS Route 53 Health Checks monitoring
- AWS Route 53 Resolver Endpoints monitoring
- AWS VPC monitoring
- AWS VPC Lattice Services monitoring
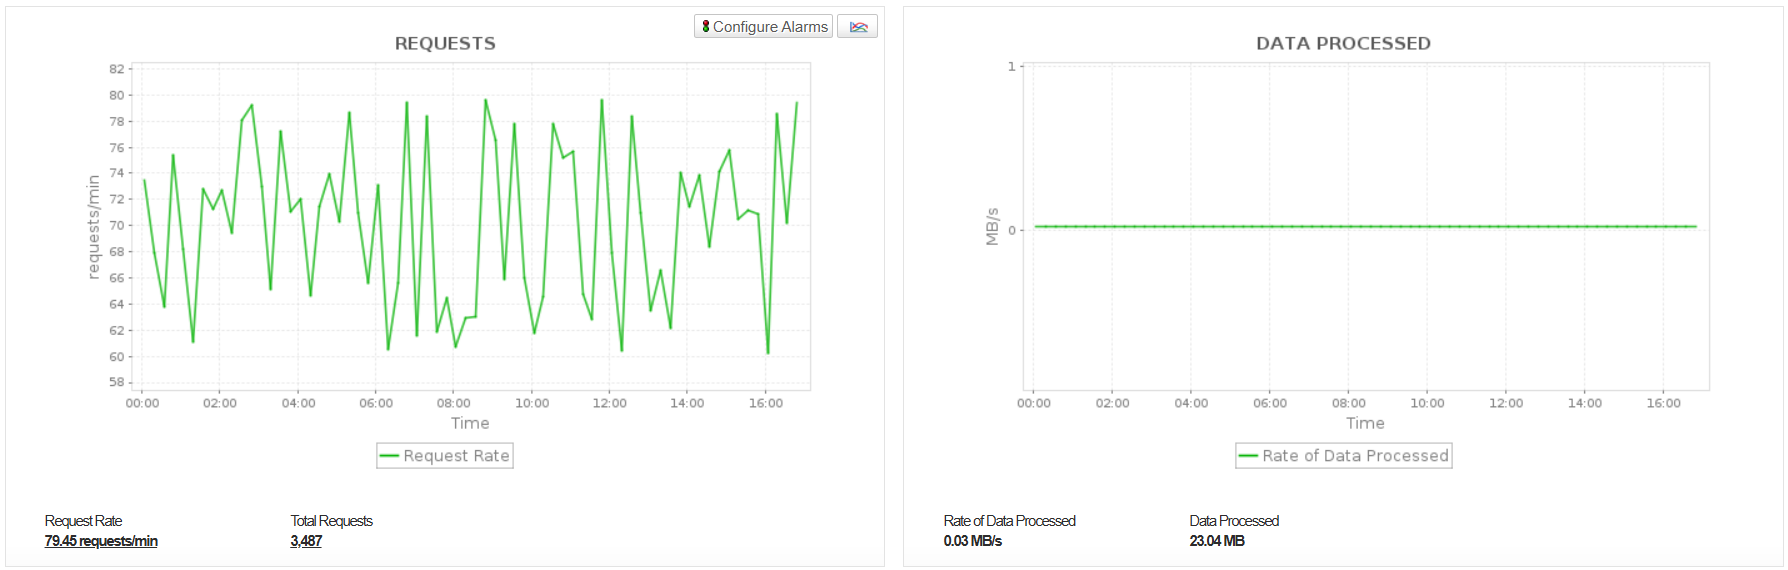
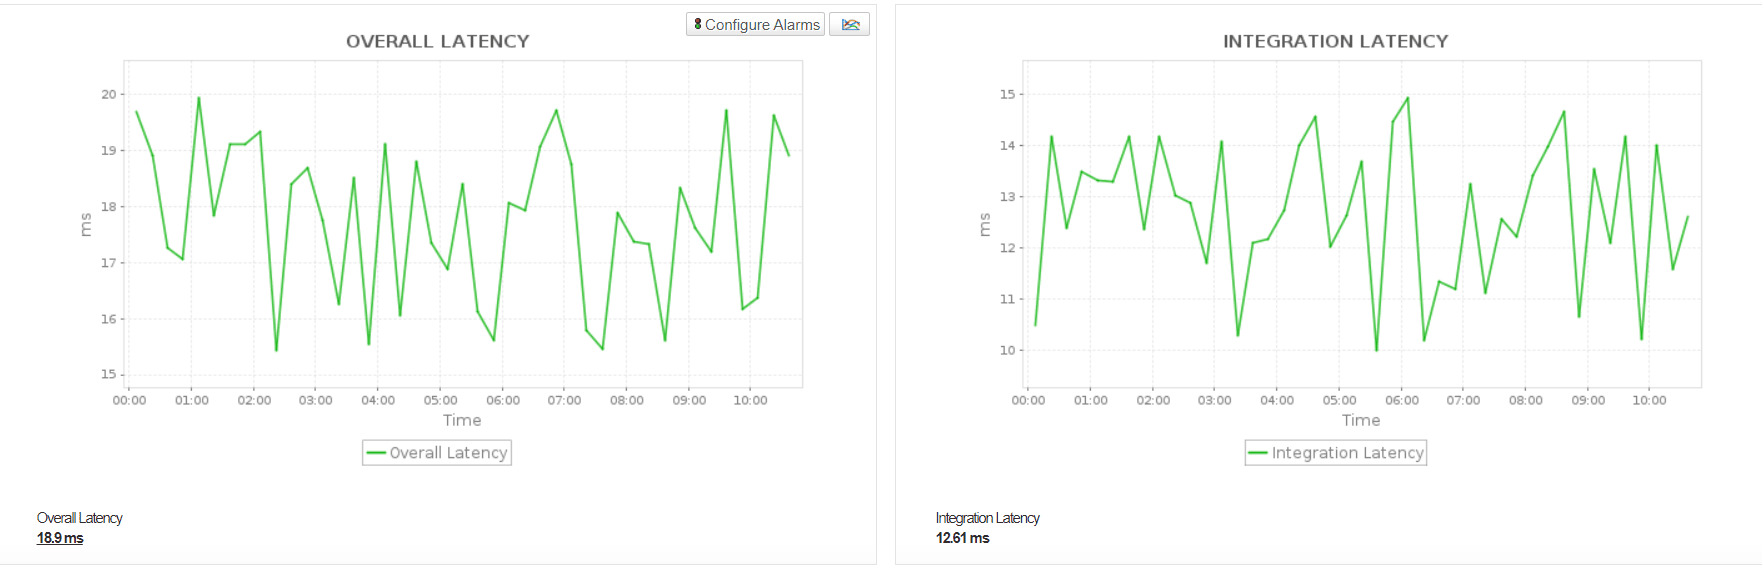
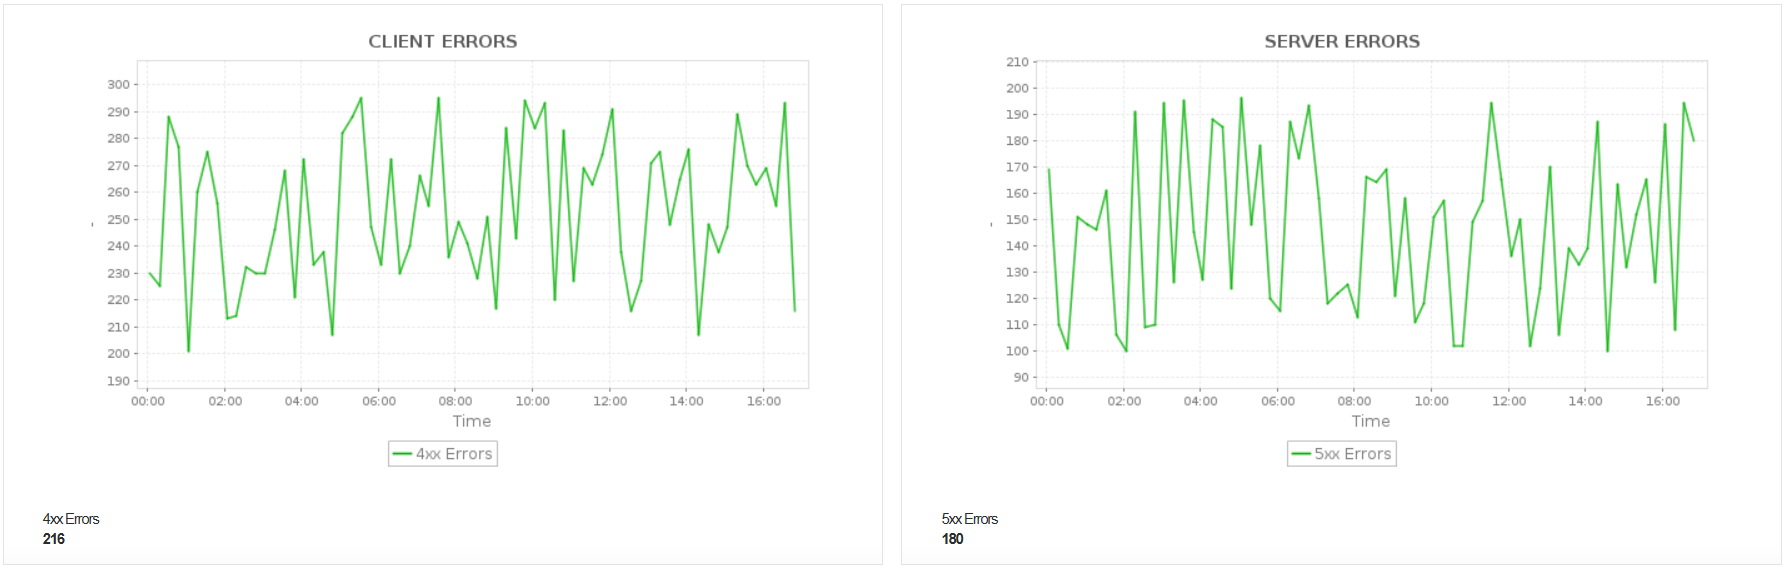
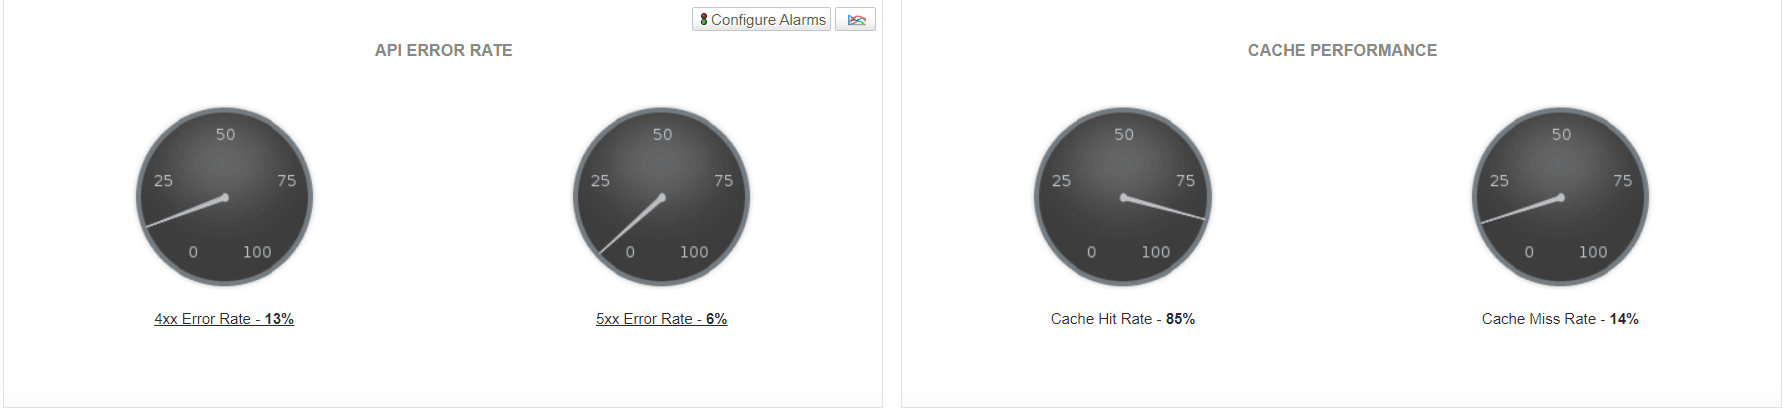
AWS API Gateway monitoring
Amazon API Gateway service allows developers to create, publish, maintain, and secure at scale, acting as a gateway for applications to access backend services like AWS Lambda, EC2, or other AWS resources. Applications Manager's Amazon API Gateway monitoring tool supports HTTP API, REST API and WebSocket API types.Keep track of the number of requests to gauge the demand and identify usage patterns, enabling better capacity planning and scaling decisions. Get notified about overall latency and integration latency to understand the time taken for API requests and backend integrations and pinpoint performance bottlenecks in real-time.
AWS CloudFront monitoring
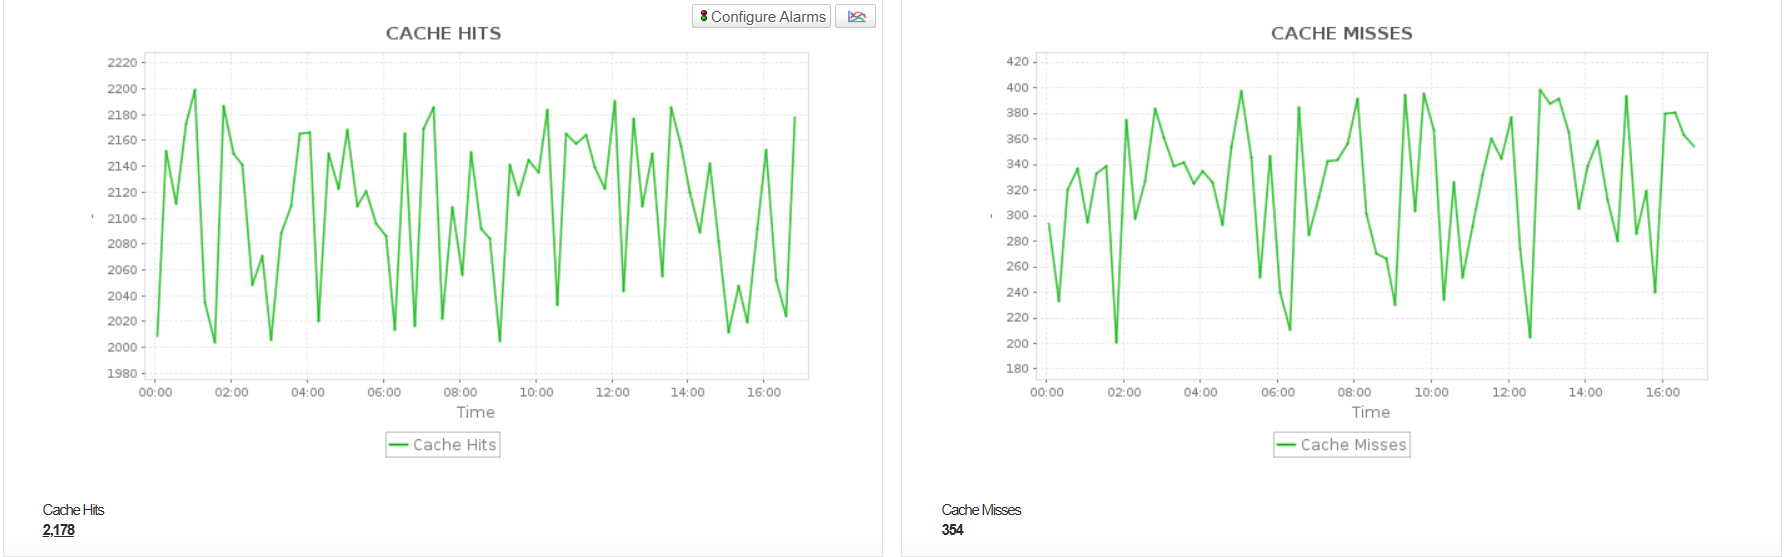
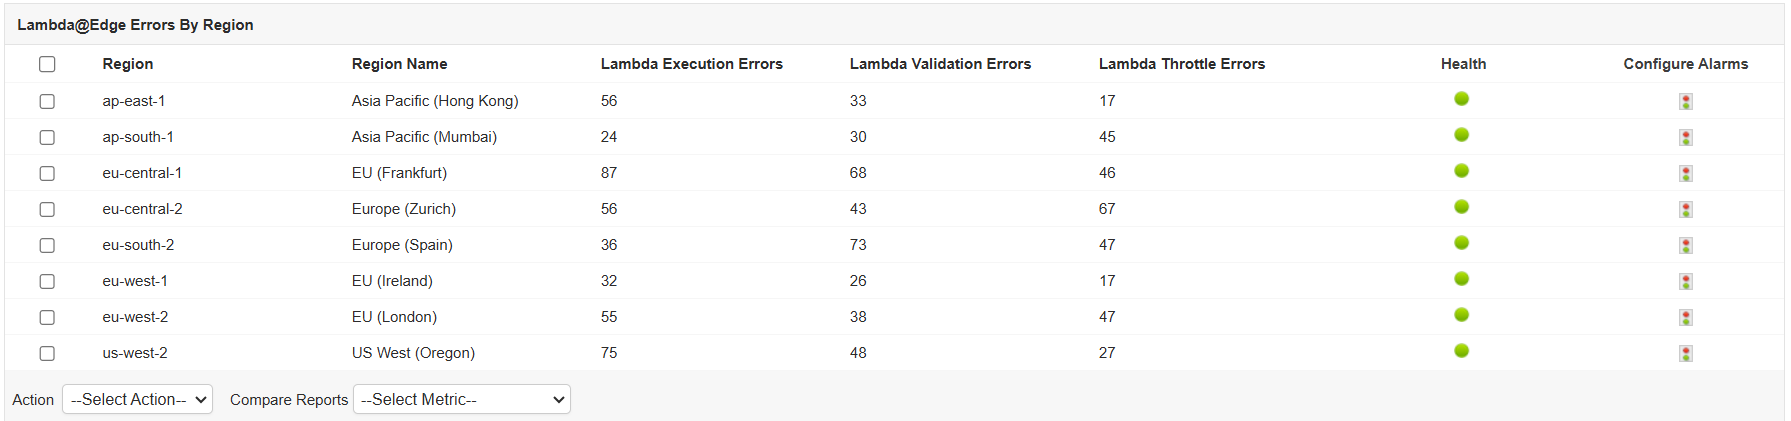
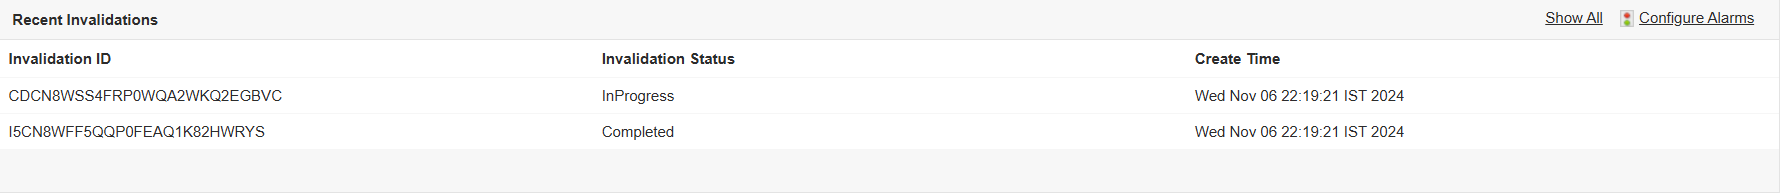
Amazon CloudFront is a content delivery network (CDN) service that facilitates the rapid distribution of static and dynamic content, such as HTML, CSS, JS, image, and video files to users. Applications Manager's AWS CloudFront monitor offers detailed visibility into your CloudFront distributions helping you ensure faster delivery of content from various locations. It keeps track of critical metrics of your CloudFront distribution servers from different edge locations that plays a crucial role in rapid content delivery and notifies you instantly in case of outages or delays in content loading times.
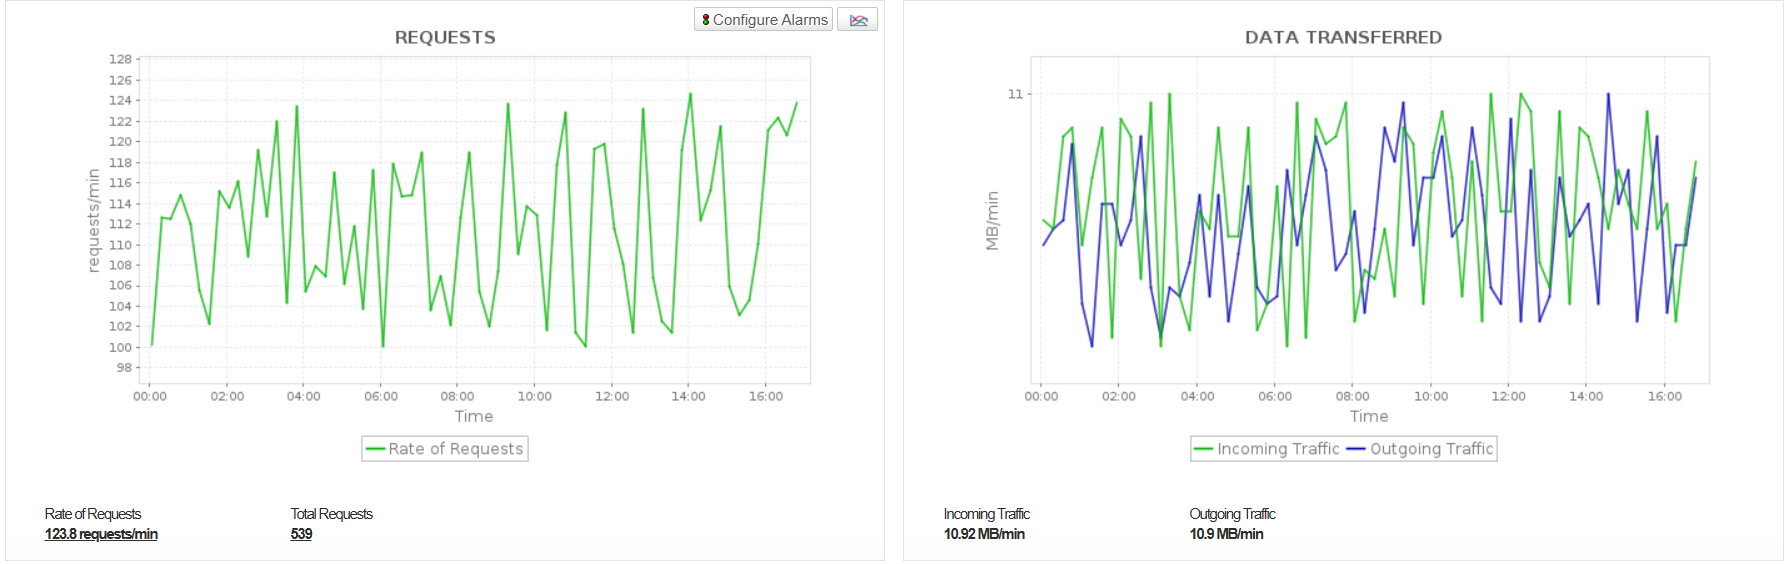
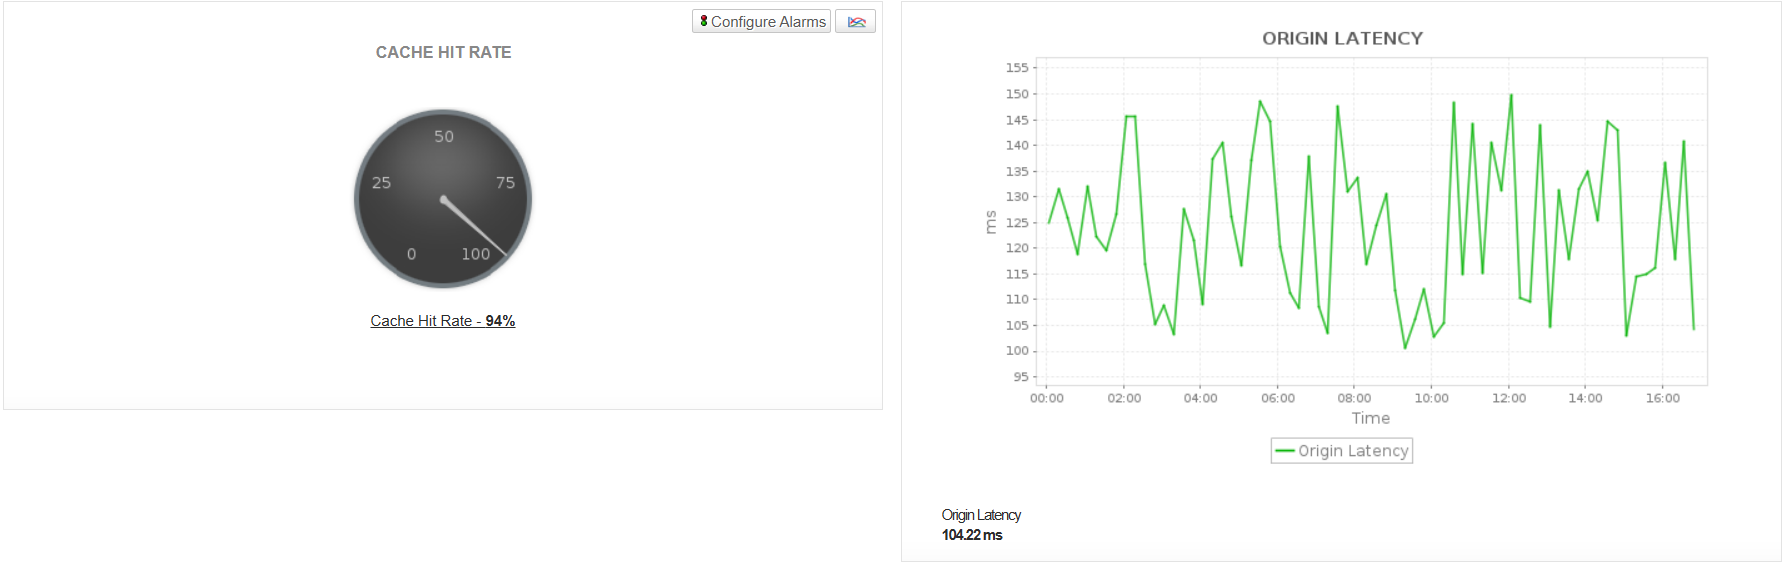
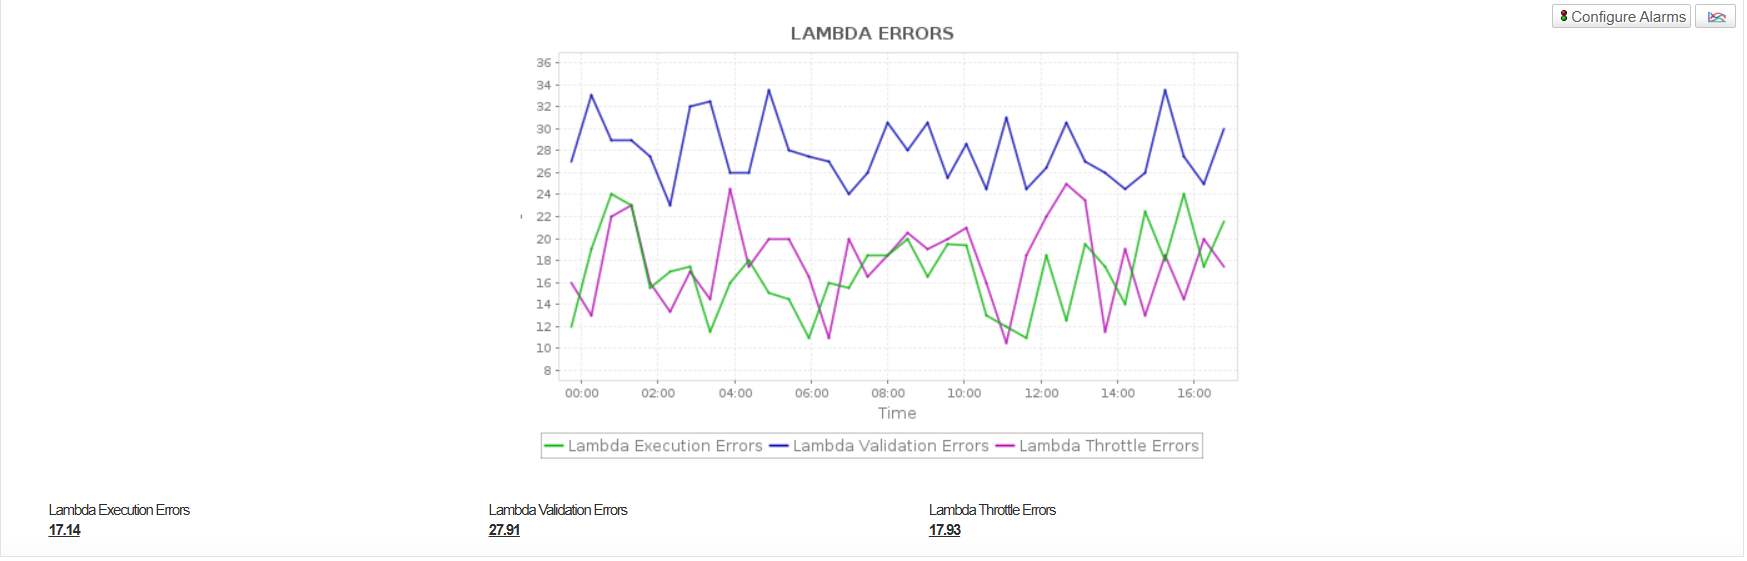
Monitor origin latency to identify bottlenecks in the response time from origin server. Obtain deep insights into cache hit ratio to ensure that requests are effectively served from the CloudFront's cache, which directly impacts latency and reduces the load on the origin. Thorough monitoring of error rates and Lambda@Edge errors can help detect configuration or backend issues and guaranteeing proper execution of custom request processing functions. Analyze request breakdowns to understand s traffic patterns and identify anomalies and track recent validations to get insights into caching efficiency.
AWS Region-wise Elastic IP monitoring
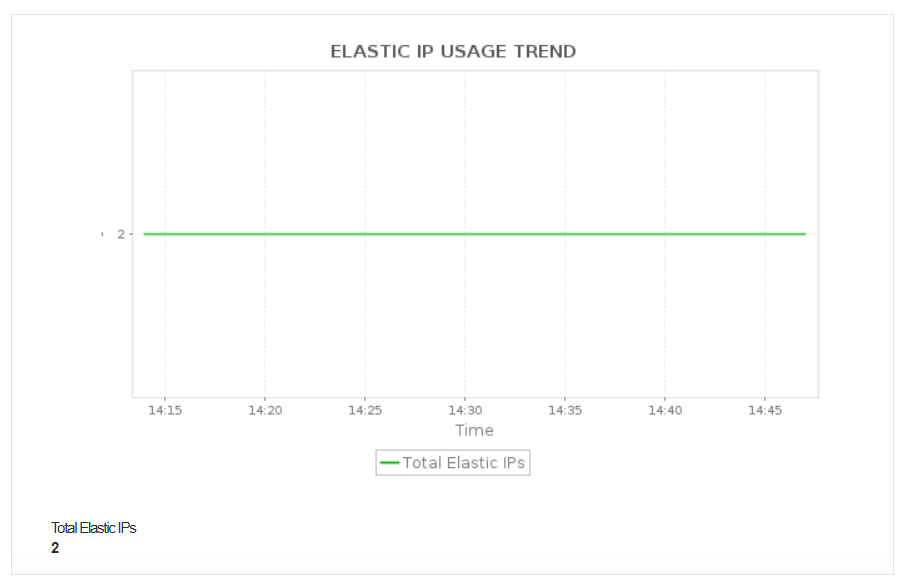
An AWS Elastic IP (EIP) is a static, public IPv4 address designed for the dynamic nature of cloud computing within Amazon Web Services (AWS). Applications Manager enables you to monitor key Elastic IP attributes within a region as a single monitor, ensuring optimal efficiency, availability, and security.
- Cost control & resource efficiency: Monitor the Total and Unattached Elastic IPs to quickly identify and release unused EIPs. This prevents unnecessary hourly charges and ensures you manage your usage against AWS resource quotas.
- Security & compliance auditing: Track detailed EIP Inventory (Public IP, Instance ID, Association ID) to maintain a clear audit trail. This confirms that all EIPs are correctly mapped to authorized, active resources, helping to prevent misuse and maintain a verifiable security posture.
- Operational resilience & fast failover: Monitor EIP Attachment Status to instantly confirm that an EIP has successfully remapped to a backup instance during a failover event. This ensures minimal downtime and accelerating troubleshooting.


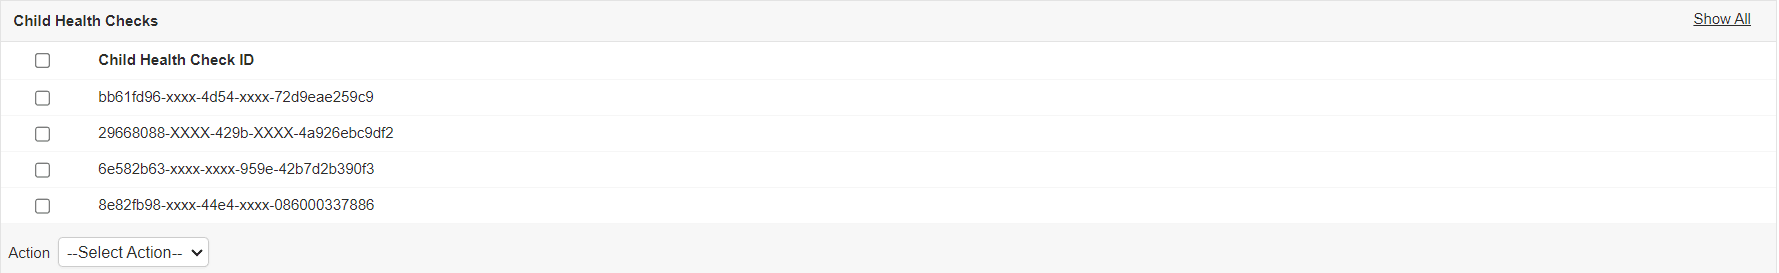
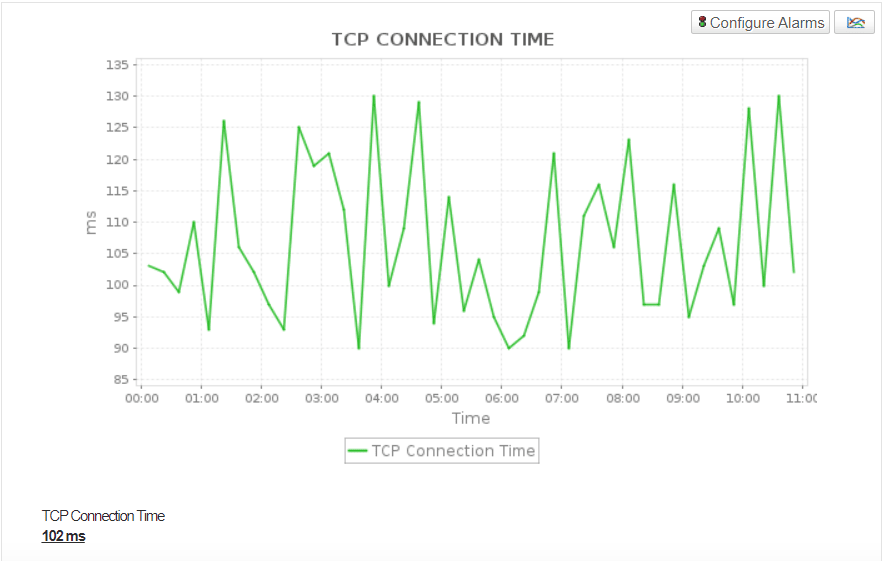
AWS Route 53 Health Checks monitoring
AWS Route 53 Health Checks allows you to monitor the health and performance of endpoints, such as web servers and applications., Applications Manager's AWS Route 53 Health check monitoring tool supports CLOUDWATCH_METRIC, CALCULATED, TCP, HTTP and HTTPS type health checks.

Track critical metrics such as TCP connection time, first byte latency, and SSL handshake time to ensure secure and fast connections. By proactively monitoring these metrics, you can ensure traffic is routed to healthy endpoints, minimizing downtime and enabling automatic failover for a seamless user experience.
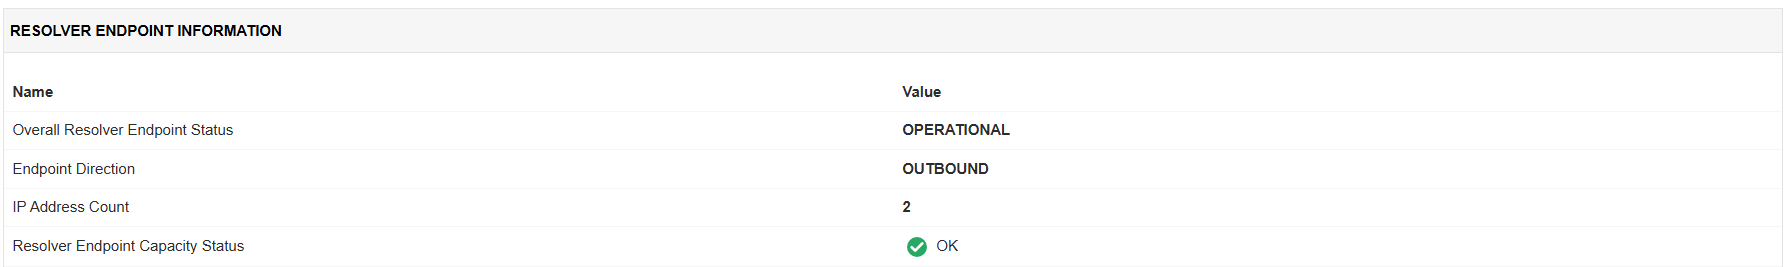
AWS Route 53 Resolver Endpoints monitoring
Amazon Route 53 Resolver is a feature of Amazon Route 53 that provides a robust, highly available, and fully managed DNS resolution service for your Amazon Virtual Private Cloud (VPC), allowing you to resolve domain names to IP addresses and vice versa. Applications Manager enables you to monitor Route 53 Resolver endpoints and provides the following benefits:
- Ensure uninterrupted, high-performance, and scalable DNS resolution across your hybrid cloud environment by tracking Resolver endpoint information. This allows proactive capacity planning and helps prevent outages before service limits are reached.
- Monitor the health of Elastic Network Interfaces (ENIs) for a Resolver endpoint to maintain DNS service reliability and continuity. Receive immediate alerts for capacity reduction due to unhealthy ENIs, take swift corrective action, and preserve hybrid network functionality.
- Monitor all DNS query rate metrics (Inbound, Outbound, and Aggregate) for proactive capacity management. This prevents service disruptions caused by hitting QPS limits and supports cost control while enabling rapid detection of security anomalies like DoS attacks or DNS exfiltration.


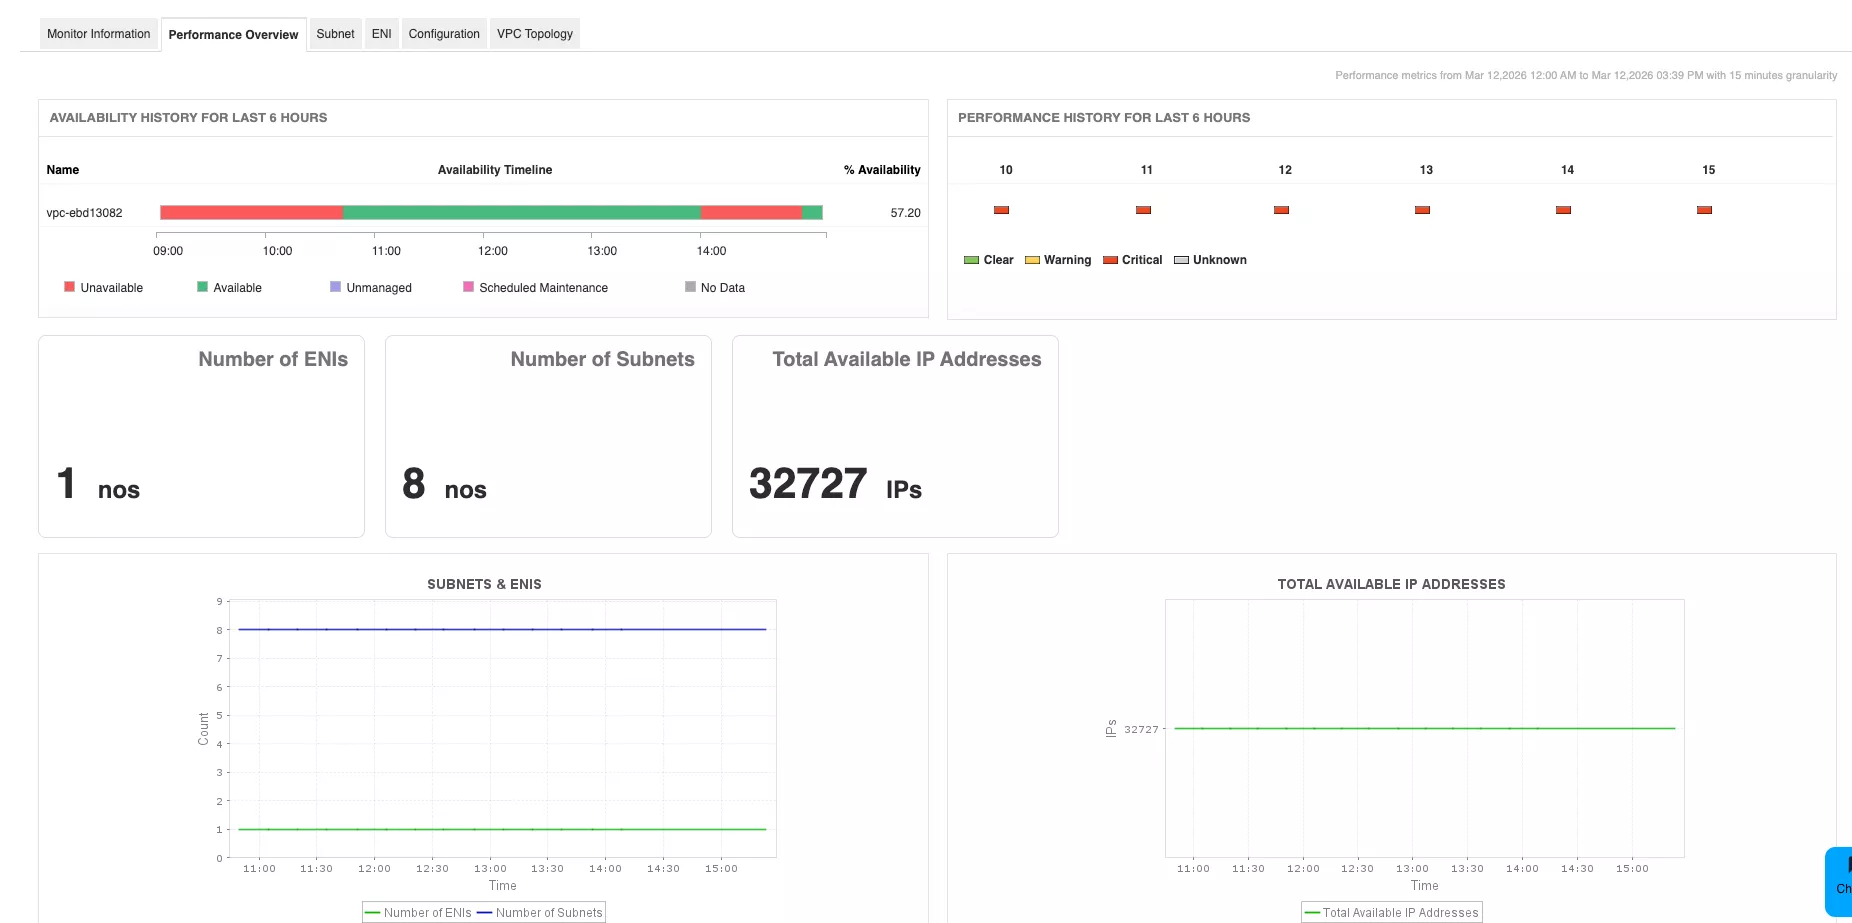
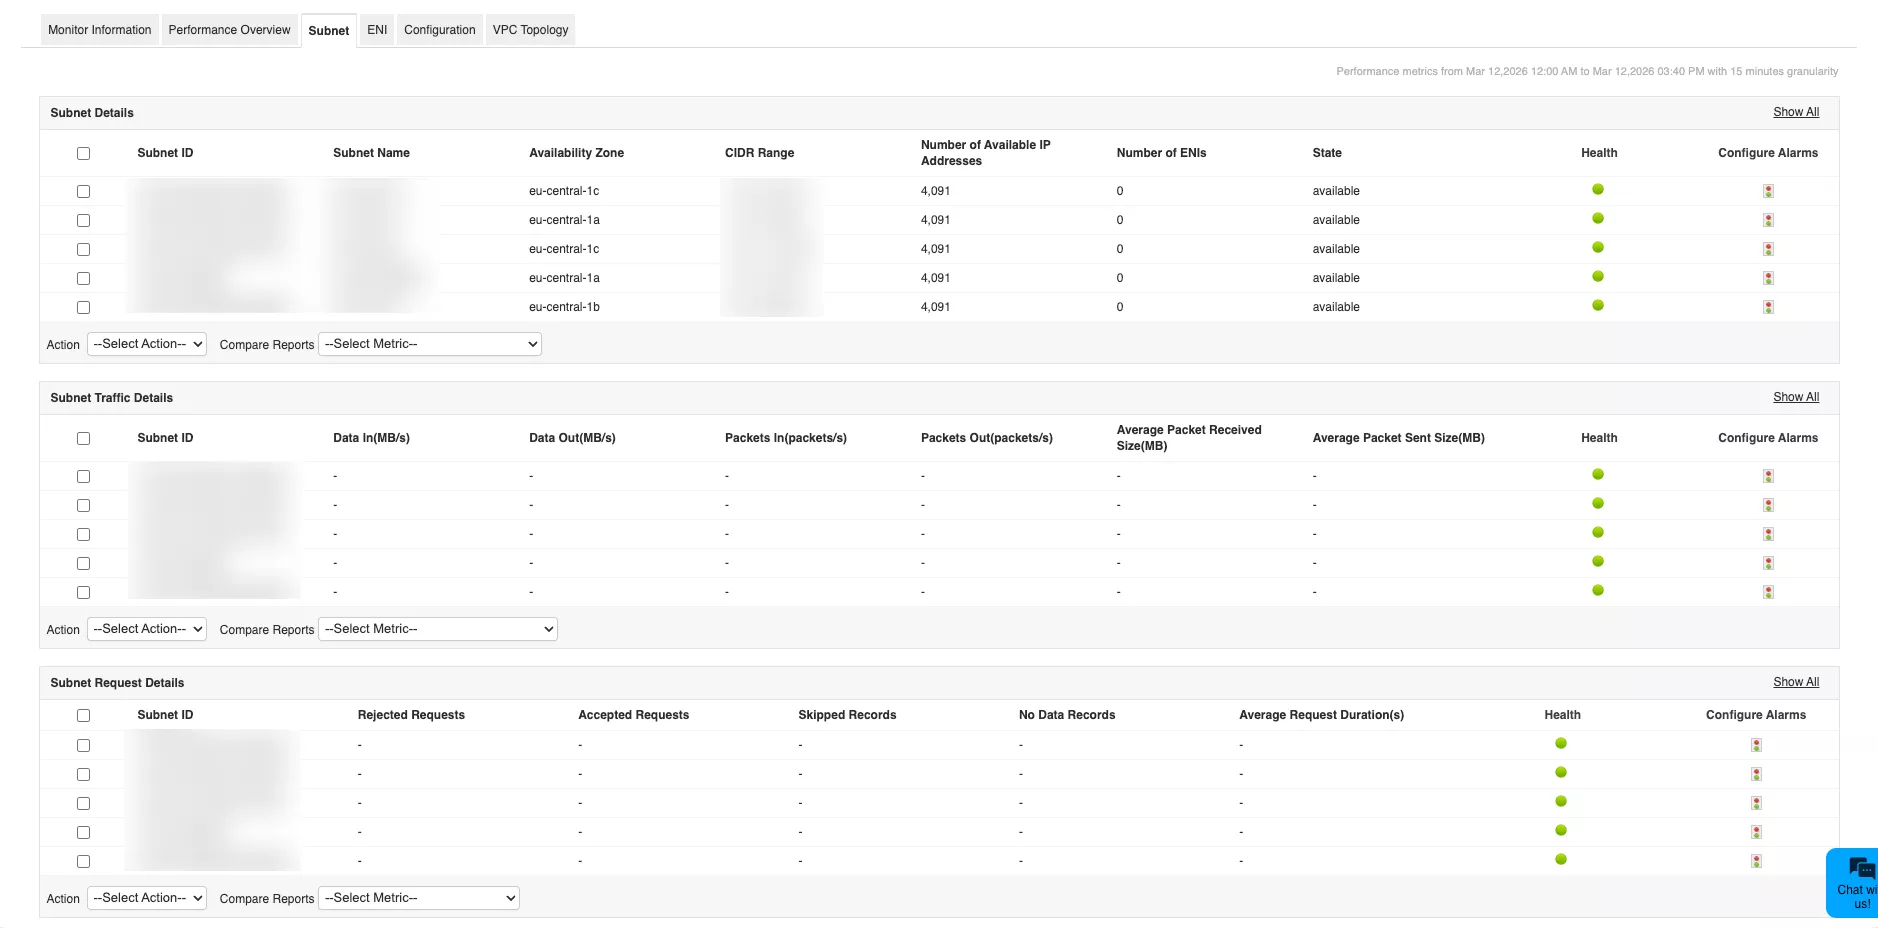
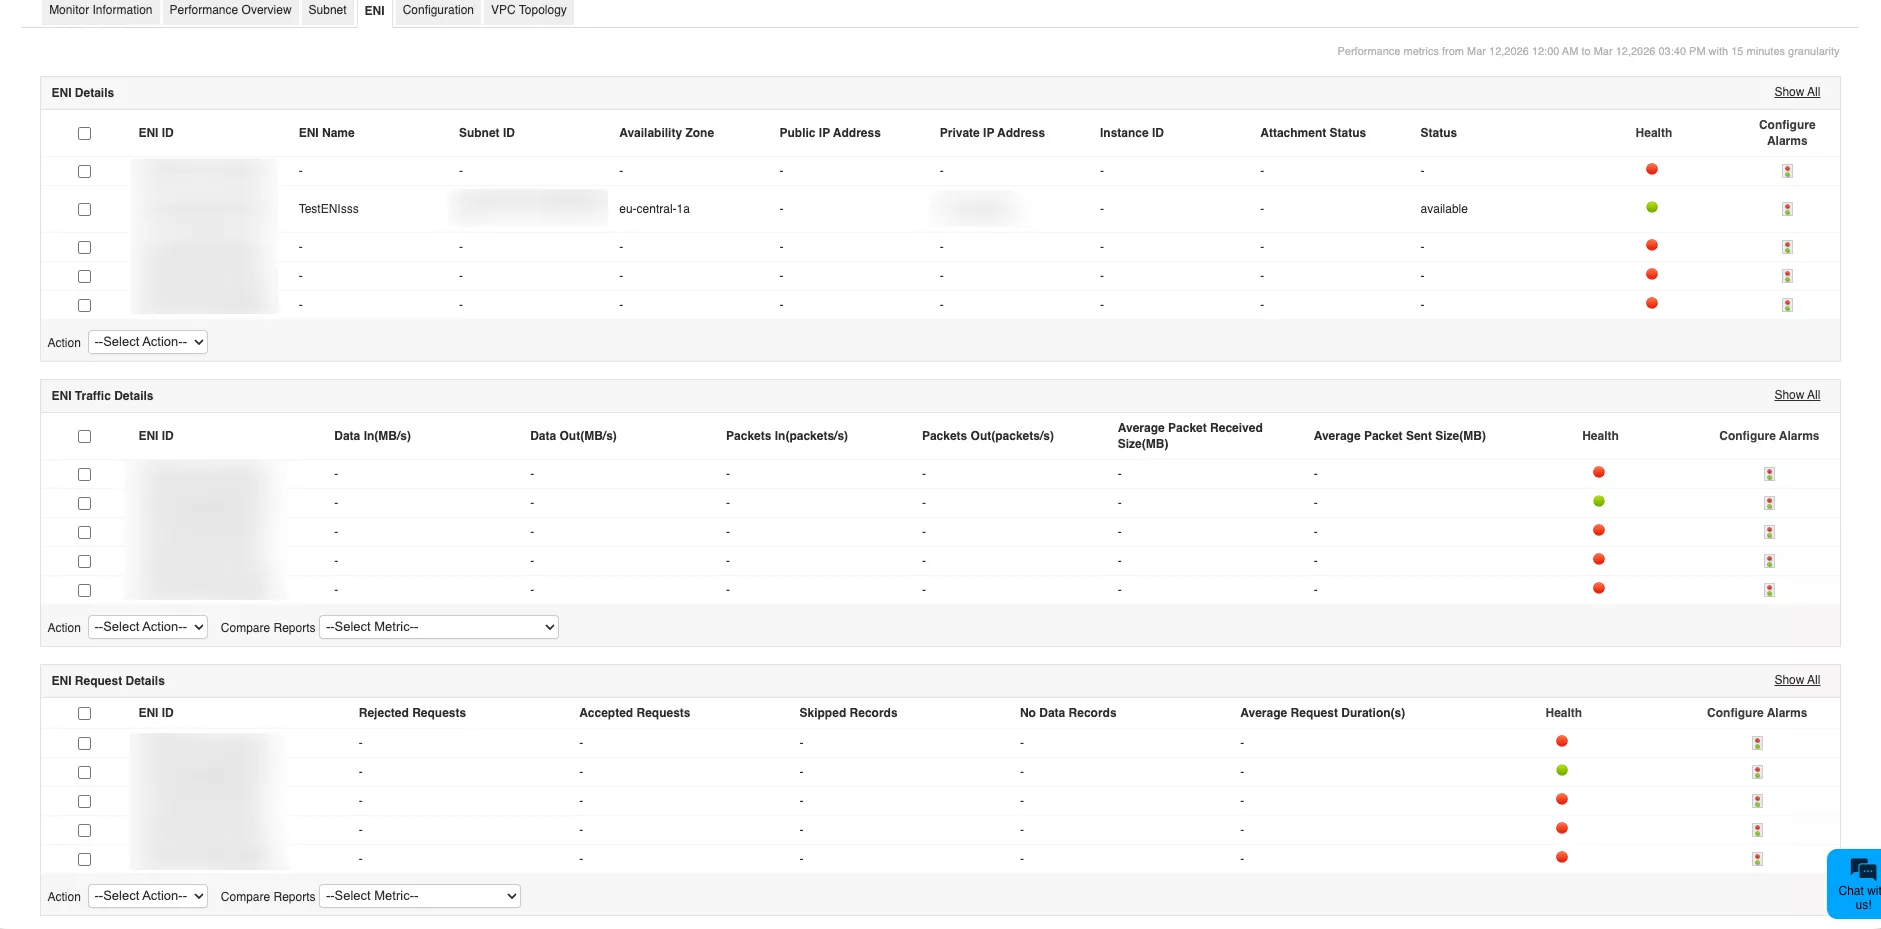
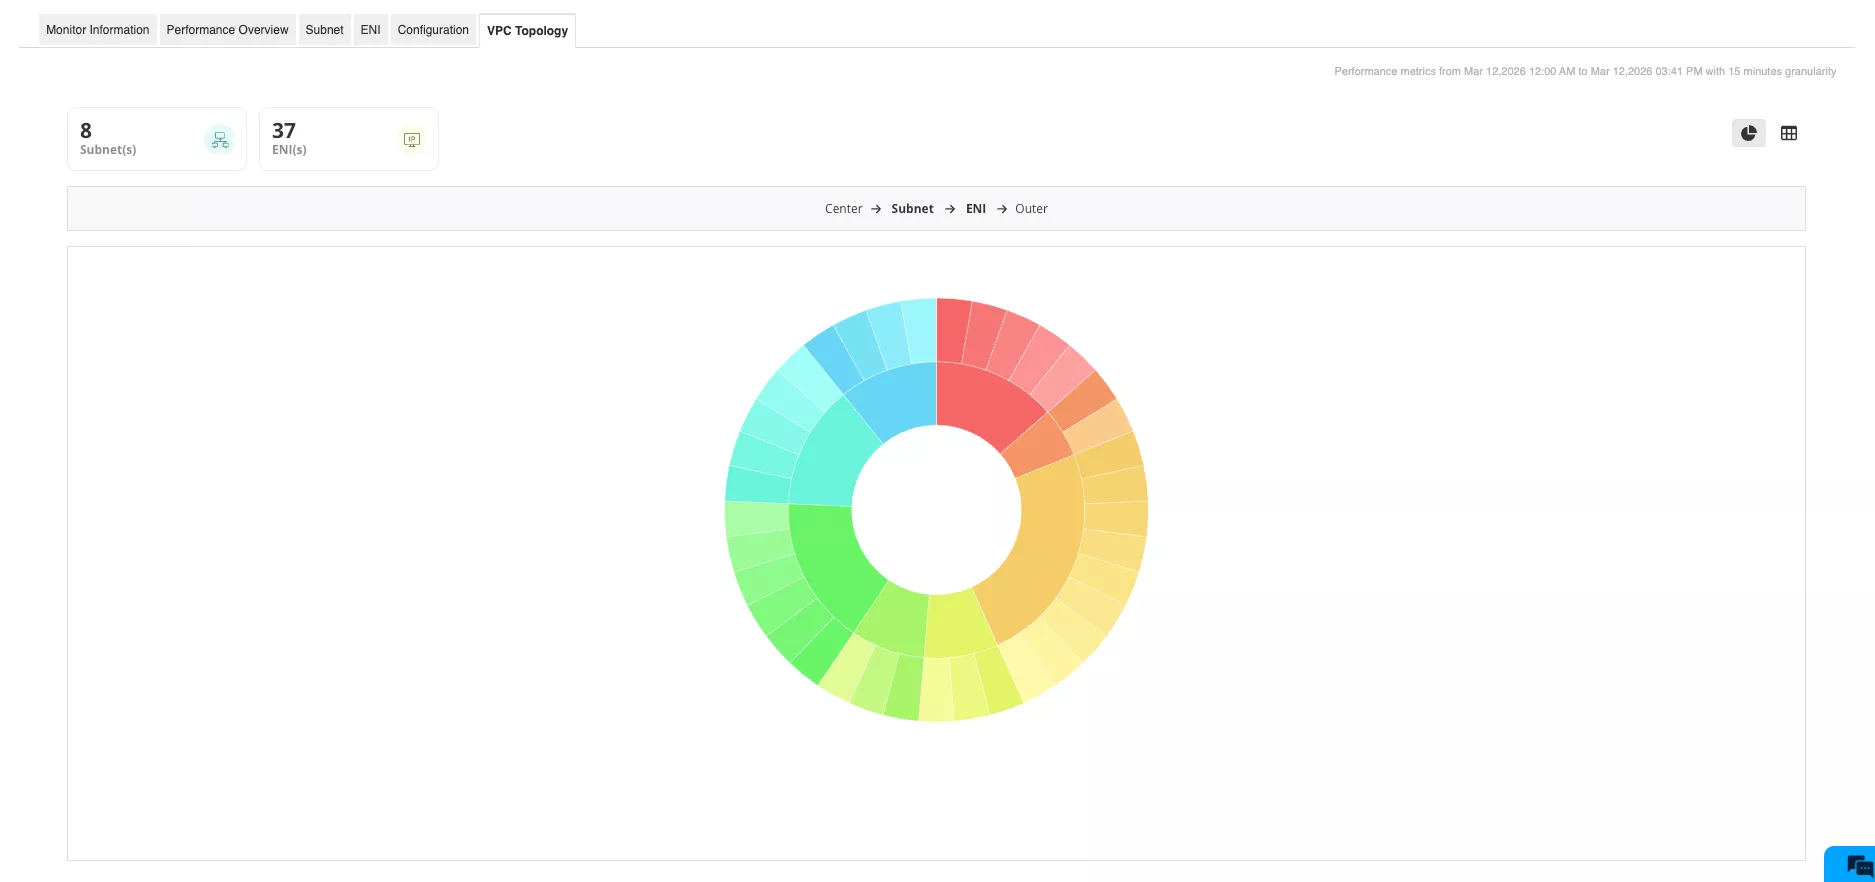
AWS VPC monitoring
Amazon Virtual Private Cloud (VPC) provides a logically isolated network environment within AWS where you control IP addressing, routing, and access boundaries. Applications Manager's VPC monitoring gives you continuous visibility into this environment, helping you maintain optimum operational efficiency across your cloud resources.
- Monitor infrastructure health and resource availability: Automatically discover and track the status of core networking components including Subnets and Elastic Network Interfaces (ENIs). Monitoring Subnet IP address utilization helps you predict resource and capacity exhaustion before it causes failures during auto-scaling events. ENI attachment tracking surfaces disconnected interfaces that can silently affect application responsiveness.
- Analyze traffic patterns and performance metrics: Track data throughput (bytes in/out) and packet metrics (packets in/out) to understand the volume and frequency of traffic across your network. These metrics help in identifying bandwidth bottlenecks, detecting issues that trigger throttling, and flagging abnormal traffic patterns that may indicate misconfiguration, or anomalies.
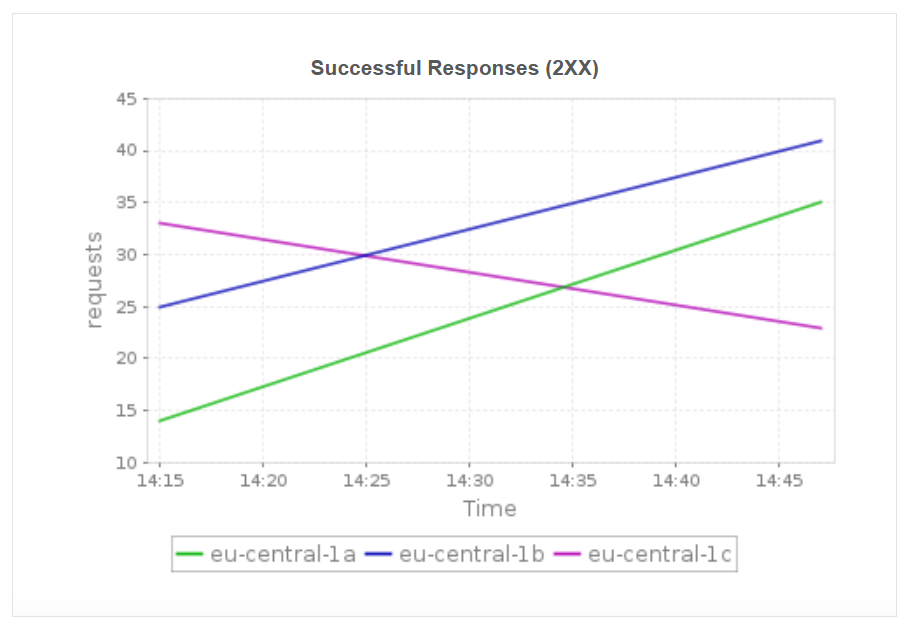
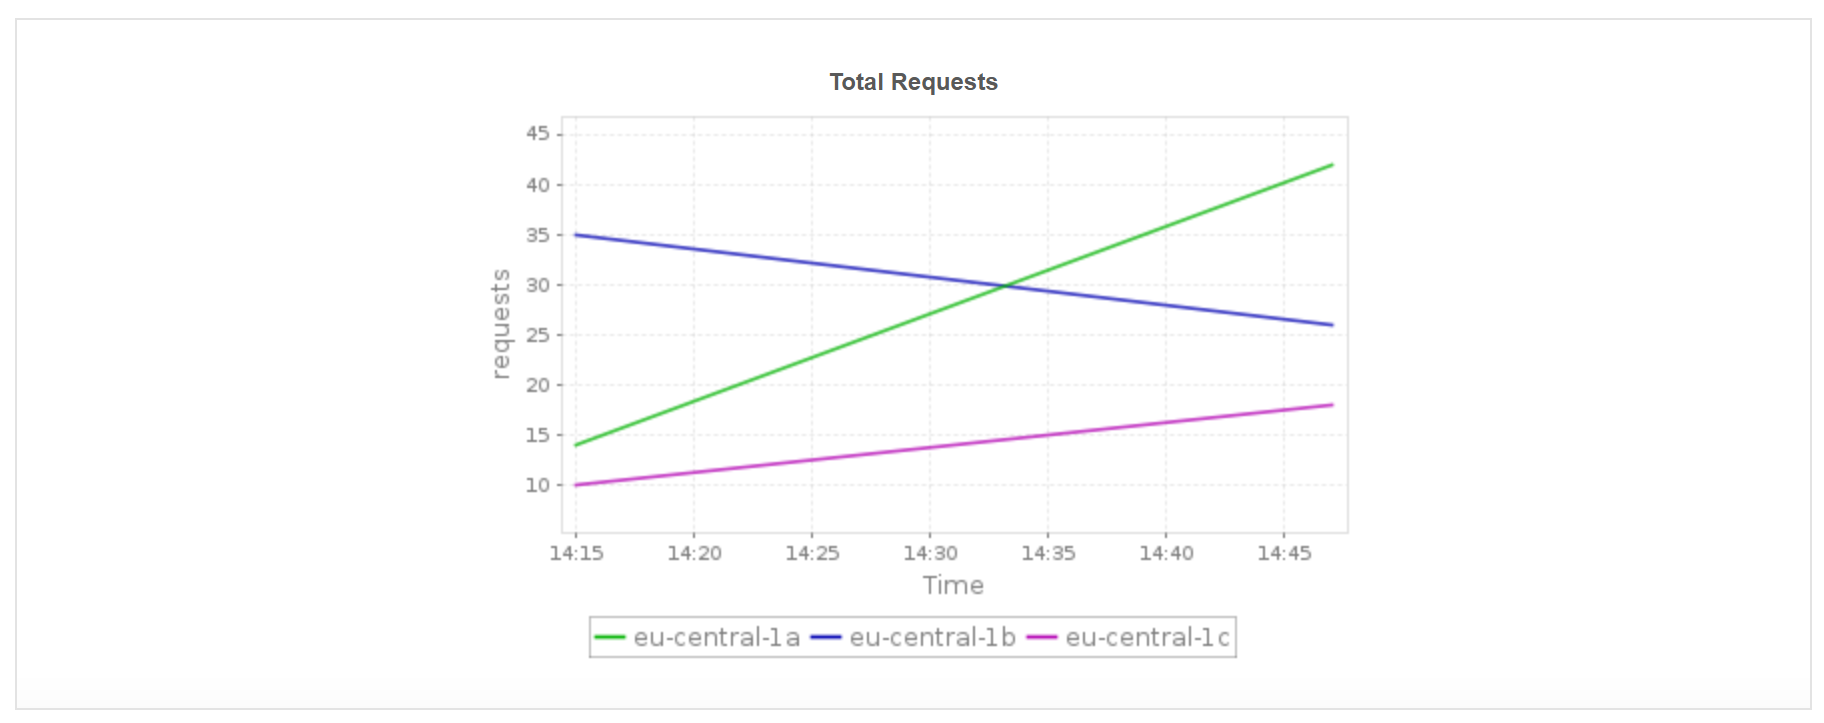
AWS VPC Lattice Services monitoring
Amazon VPC Lattice is an application networking service that helps connect, secure, and monitor services across multiple AWS accounts and VPCs. With Applications Manager, you can monitor key metrics of the VPC Lattice service to enhance availability troubleshooting, optimization, and compliance in distributed AWS environments.
- Monitor Lattice Status, Failure Code, and Failure Message to get instant diagnostic information, allowing operators to quickly understand . the cause of failures or degradations without extensive investigation. This significantly reduces mean time to resolution(MTTR).
- Track all HTTP Status Codes such as servers errors (5XX), client errors (4XX), redirect responses (3XX), and successful responses (2XX) by Availability Zone (AZ) to identify regional or zonal issues precisely. This is essential for traffic isolation, preventing cascading failures, and ensuring the application maintains high availability and resilience across the AWS Region.
- Analyze Request Metrics (Average Request Time and Timeouts) per Availability Zone to gain direct insight into application performance. Monitoring these metrics helps detect performance bottlenecks, validate service responsiveness, and guide scaling and load-distribution decisions to prevent service overload.


It's necessary to monitor all of the AWS services that are being used to keep your applications running at peak performance. Applications Manager's AWS performance monitoring supports popular services like:
Applications Manager is as an effective application performance monitoring tool that supports a wide range of other cloud and on-premise applications. You can download a 30-day free trial and start monitoring in a few minutes!
