AWS infrastructure and uptime monitoring: A practical guide
Category: Cloud monitoring
Published on: October 11, 2025
5 minutes
If you’ve ever run production workloads on AWS, you know that “set it and forget it” doesn’t exist. Infrastructure scales, services interact in unpredictable ways, and end users expect constant availability. To keep systems healthy and customers happy, you need two kinds of visibility: AWS infrastructure monitoring (how the pieces inside AWS are performing) and AWS uptime monitoring (whether your services are actually reachable by users).
On paper, these may sound similar. In practice, they answer two very different questions. Infrastructure monitoring tells you what’s happening under the hood, while uptime monitoring tells you what your users are experiencing. Together, they give you the full picture.
Why monitoring matters in the first place
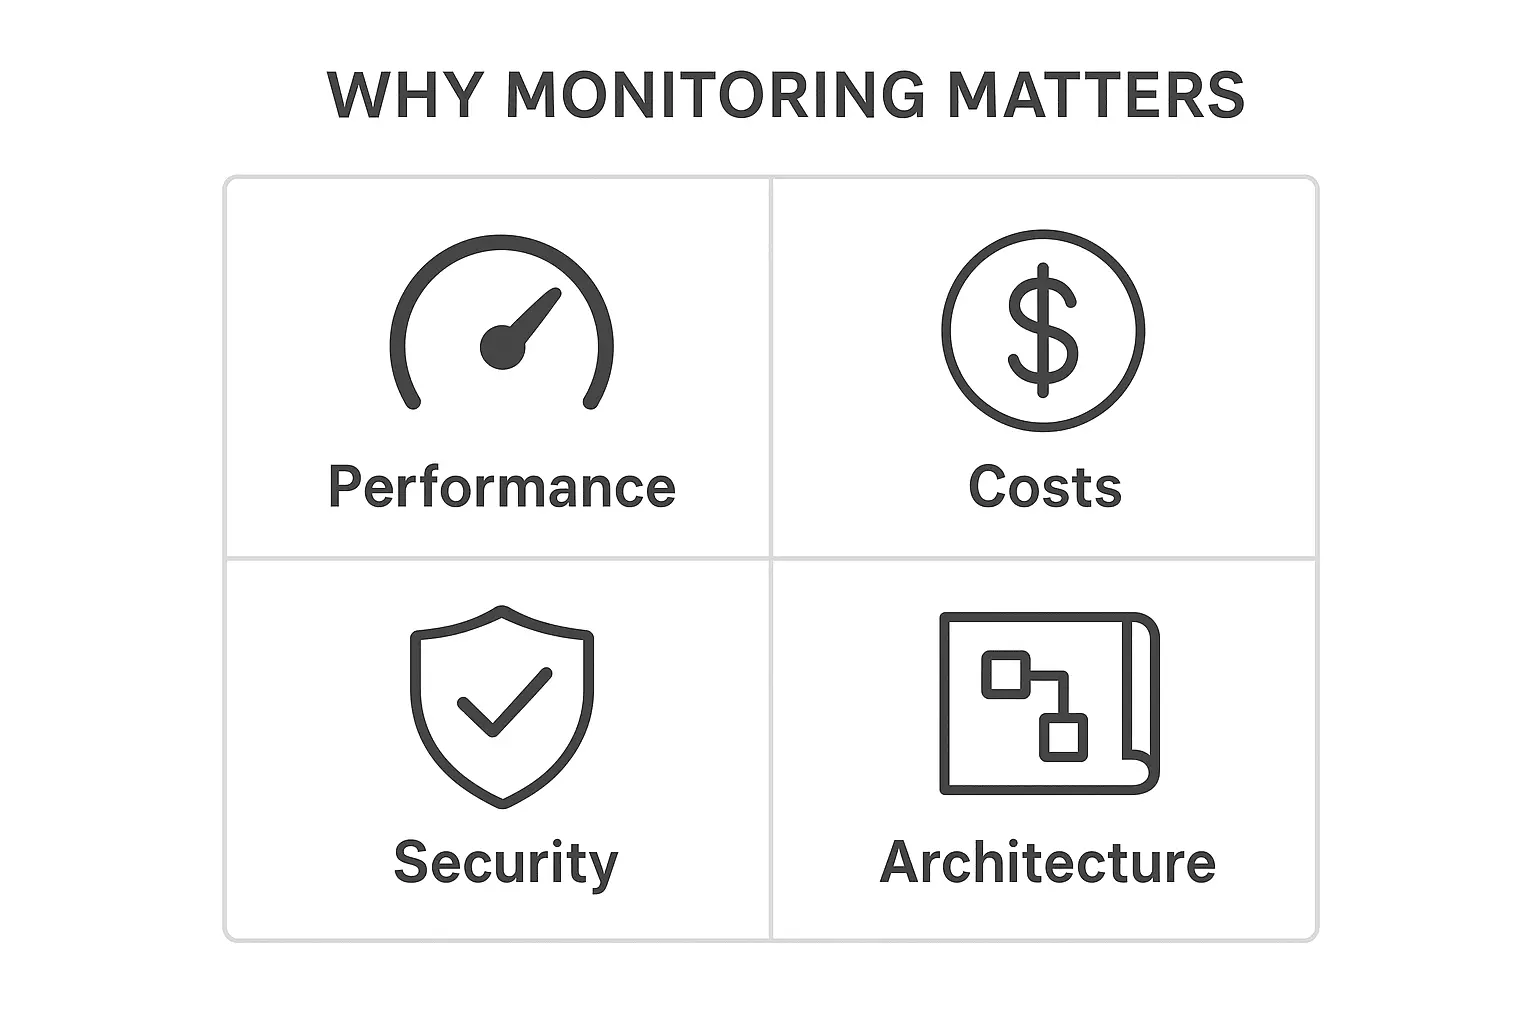
Monitoring is often treated as an afterthought, but in AWS it directly impacts business outcomes.

- Performance: Without metrics, you don’t know if your EC2 fleet is under stress or if your Lambda concurrency limits are creeping up. Bottlenecks tend to surface only when traffic spikes.
- Costs: AWS’s pay-as-you-go model rewards efficiency but punishes blind spots. Idle resources, unnecessary data transfers, or misconfigured scaling policies can quietly inflate your bill.
- Security: Unusual logins, rogue API calls, or unexpected resource creation are all signals you’ll only catch with monitoring in place.
- Better architecture decisions: Data from monitoring helps you evolve your design. Maybe you discover RDS is struggling with queries and it’s time to move to Aurora, or you realize caching layers need to be added.
In short, monitoring is the difference between reactively fixing problems and proactively shaping your architecture.
Monitoring AWS infrastructure
Infrastructure monitoring is about keeping an eye on the building blocks—compute, data, and networking.
The core AWS tools
- CloudWatch: The heartbeat monitor, collecting metrics, logs, and alarms across AWS services.
- X-Ray: Traces requests through microservices or serverless workflows
- CloudTrail: Keeps an auditable record of all API activity.
- Trusted Advisor: Flags cost, security, and performance risks.
- DevOps Guru: Surfaces anomalies using ML.
What to watch closely
- Compute: CPU/memory on EC2, Lambda cold starts and concurrency, container scheduling in ECS/EKS.
- Data: Query latency in RDS, hot partitions in DynamoDB, cache misses in ElastiCache, or object access patterns in S3.
- Network: Latency on load balancers, NAT gateway saturation, packet drops in VPCs.
Best practices that pays off
- Establish baselines so you know what “normal” looks like.
- Correlate metrics across services instead of looking at them in isolation.
- Centralize dashboards across multiple accounts and regions.
- Automate remediation where possible—let Lambda or Auto Scaling handle predictable fixes.
Monitoring uptime
Infrastructure may be running smoothly, but if users can’t access your service, none of it matters. That’s where uptime monitoring comes in—it validates availability from the outside in.
Native AWS options
- Route 53 health checks: Verify endpoints and trigger DNS failover if something fails.
- CloudWatch synthetics: Run scripted canaries to mimic user journeys or API calls.
- Global accelerator: Health-aware routing for global applications.
External tools
Most mature teams complement AWS tools with third-party uptime monitoring like ManageEngine Applications Manager to simulate access from multiple geographies. This uncovers regional outages or latency spikes AWS-native tools may not catch.
What to measure
- Availability percentage: The classic uptime number.
- Response times: How fast endpoints respond from different test locations.
- Error rates: Frequency of 4xx/5xx errors.
- Failover behavior: How quickly traffic reroutes during an outage.
How the two work together
Here’s the catch: infrastructure monitoring and uptime monitoring aren’t independent. They reinforce each other.
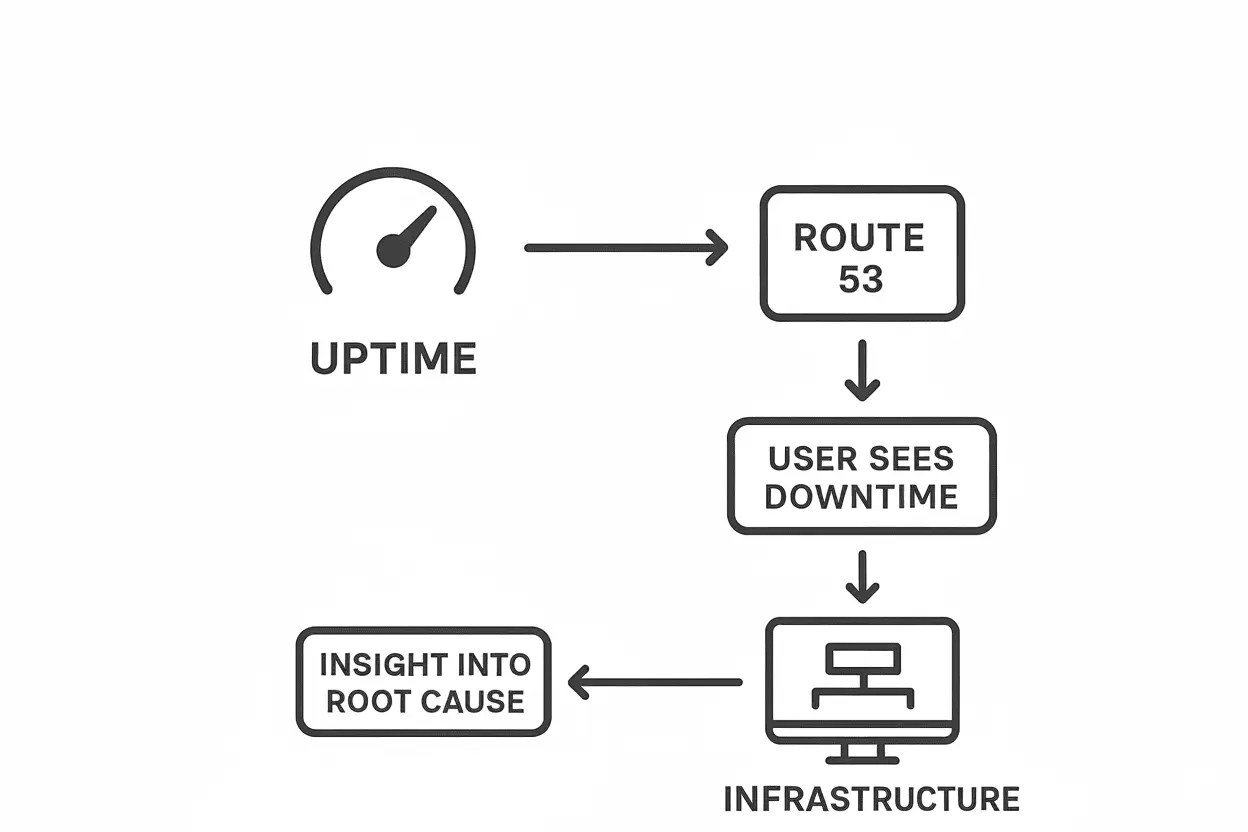
Imagine Route 53 canaries show that users can’t reach your app. Infrastructure metrics reveal that the issue isn’t EC2 or RDS—it’s a misconfigured load balancer.

Without infrastructure and uptime monitoring perspectives, troubleshooting becomes guesswork.
- Uptime tells you what the user sees.
- Infrastructure tells you why it’s happening.
That’s why the most effective monitoring strategies combine both.
Going beyond the basics
As environments scale, monitoring complexity grows.
- Multi-region setups: You need to validate not just availability but also DNS routing and replication lag across regions.
- Hybrid/multi-cloud: If workloads span AWS and on-prem, you’ll need OpenTelemetry or similar frameworks to tie metrics together.
- Predictive monitoring: Services like CloudWatch Anomaly Detection or DevOps Guru can forecast issues before they hit production.
- Compliance needs: For regulated workloads, logs and metrics need to be stored securely and exported to SIEMs for audits.
The bigger the architecture, the more monitoring becomes a governance strategy rather than a checklist.
Bringing it all together with Applications Manager
Monitoring in AWS isn’t about checking boxes—it’s about building confidence. Confidence that your infrastructure is scaling properly, that uptime is consistent across regions, and that costs or anomalies won’t catch you off guard. AWS gives you the core tools, but stitching them together into a seamless, actionable picture can be a challenge.
That’s where third-party AWS monitoring solutions like Applications Manager come in. By consolidating infrastructure telemetry, uptime checks, cost visibility, and security alerts into one platform, Applications Manager helps teams move from fragmented monitoring to unified observability.
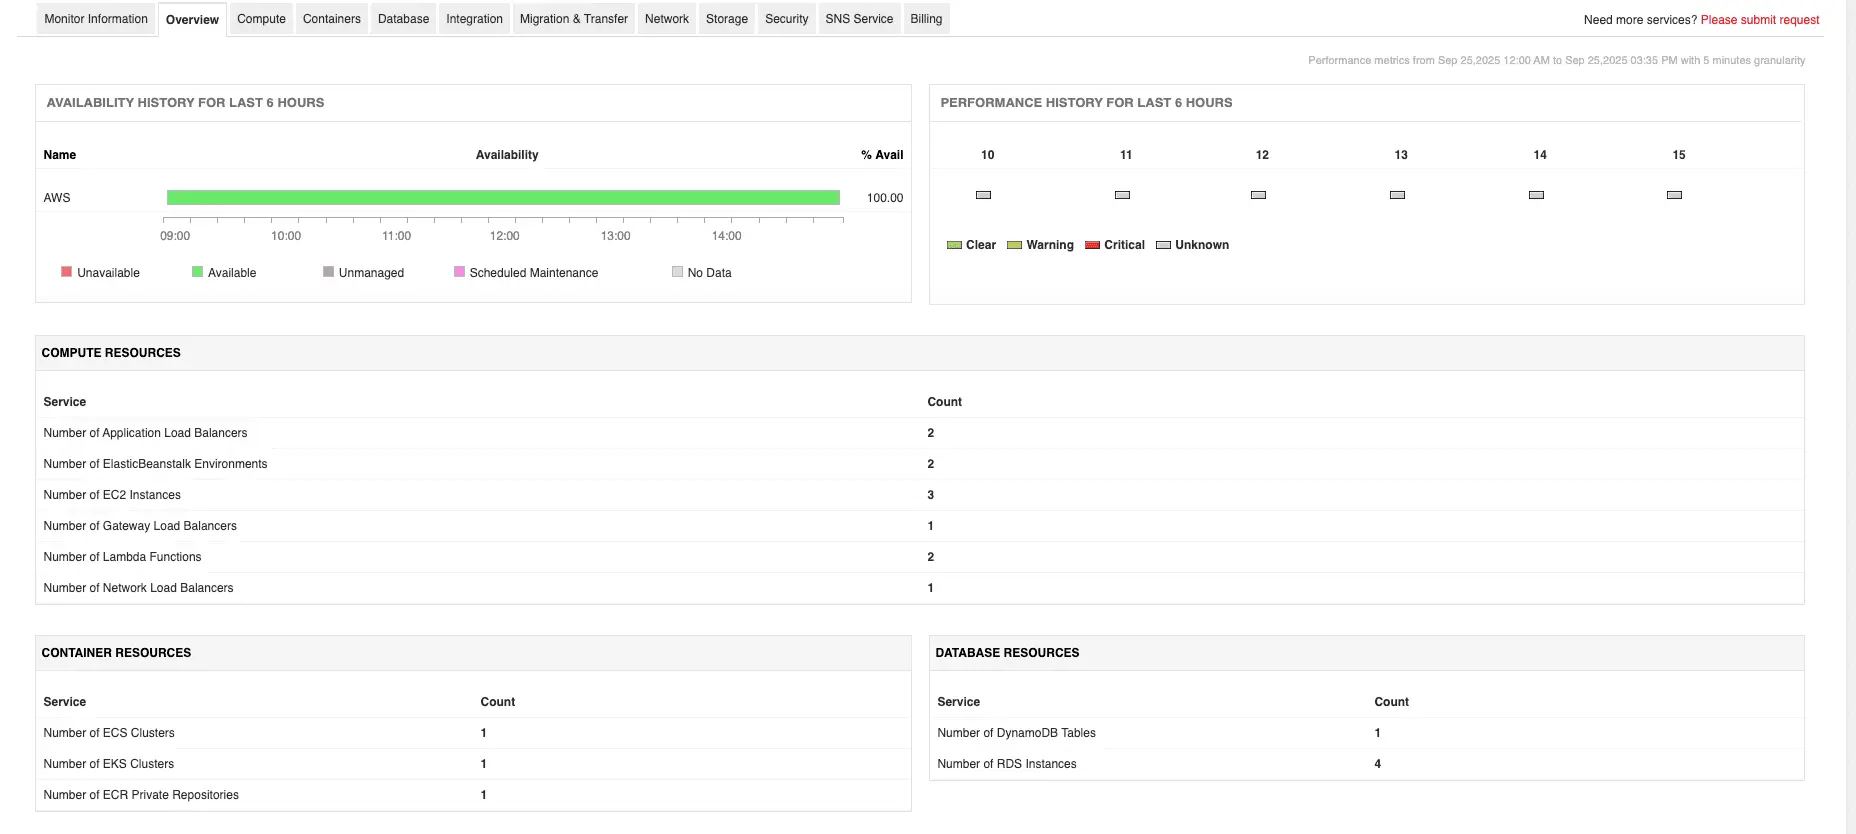
- Track multiple AWS services such as EC2, RDS, Lambda, EKS, S3, and more - alongside on-premise and multi-cloud workloads.
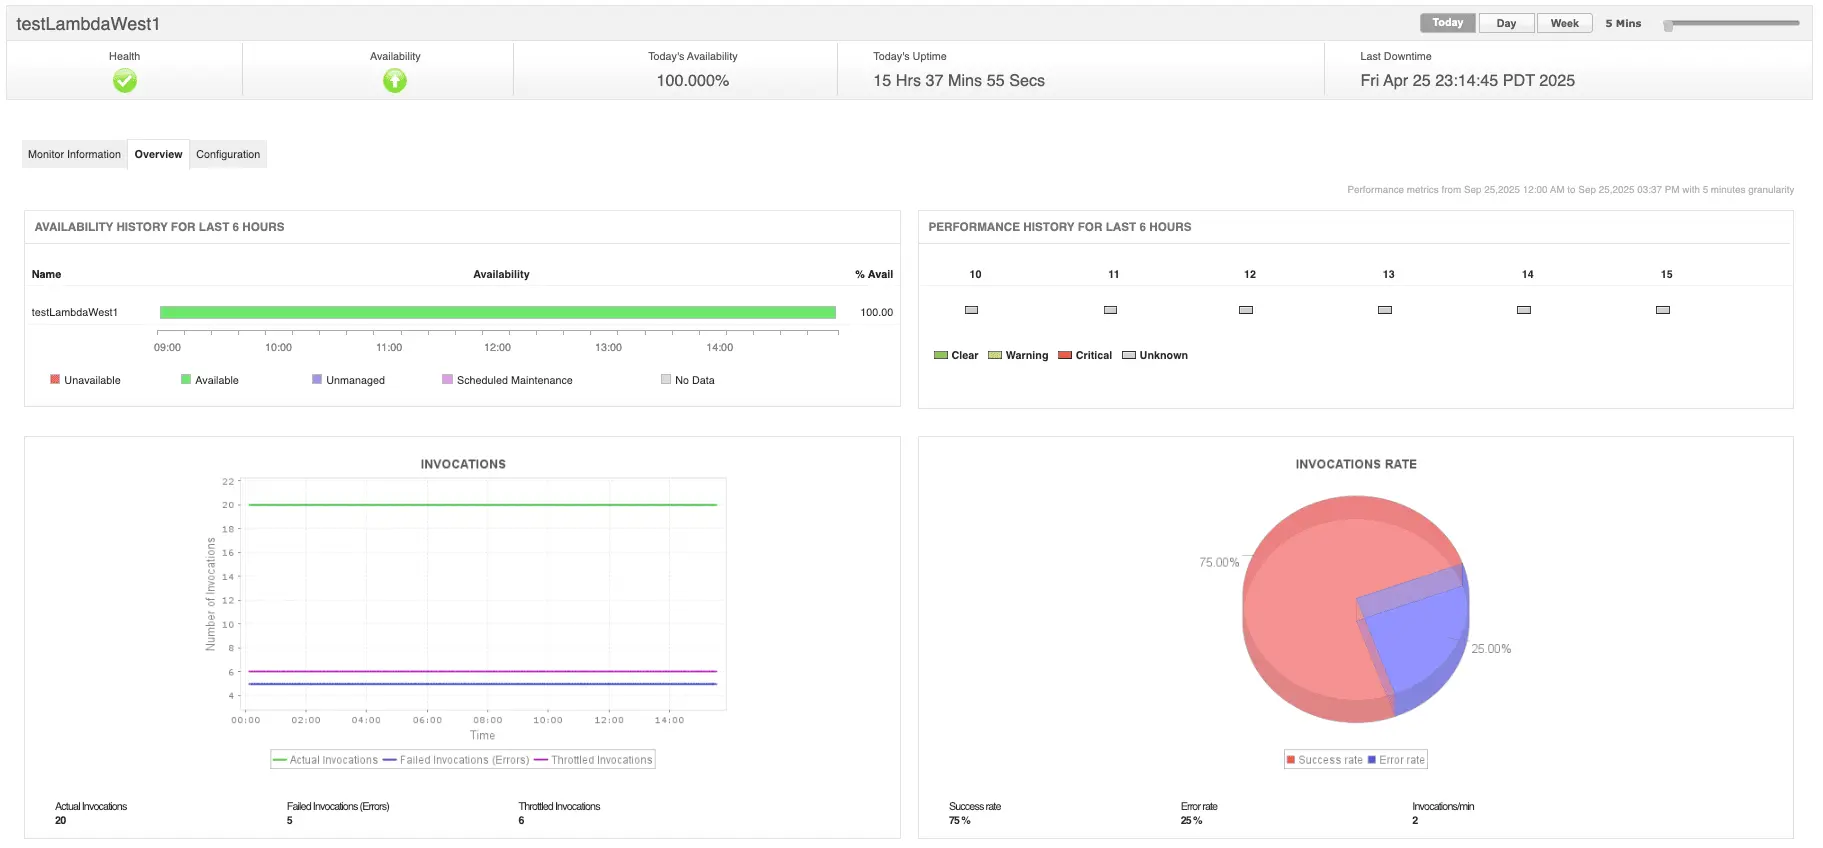
- Get deep performance insights into the applications deployed on AWS with application performance monitoring (APM). Correlate with synthetic monitoring and real user monitoring (RUM) for faster root cause analysis.
- Cloud cost monitoring, capacity optimization, AI-powered anomaly detection, and more.
The result? Fewer blind spots, faster root cause analysis, and a proactive rather than reactive approach to AWS operations.


Want to see it in action? You can schedule a personalized demo or download a 30-day free trial and experience what unified monitoring feels like.

