Mastering the cloud: Essential insights into cloud infrastructure monitoring
Category: Cloud monitoring
Published on: Sept 30, 2025
10 minutes
Cloud adoption is a standard practice in enterprise IT. It delivers agility and scale but introduces interdependent systems that traditional monitoring cannot fully address. Cloud infrastructure monitoring ensures digital services remain reliable and performant by maintaining availability, resilience, and operational clarity.
It involves tracking the health, performance, and availability of compute instances, storage systems, network components, and native cloud services. By continuously collecting and analyzing telemetry from these layers, teams gain visibility into resource behavior, identify risks before they escalate, and ensure the reliability of the environments that applications depend on.
How cloud infrastructure monitoring works

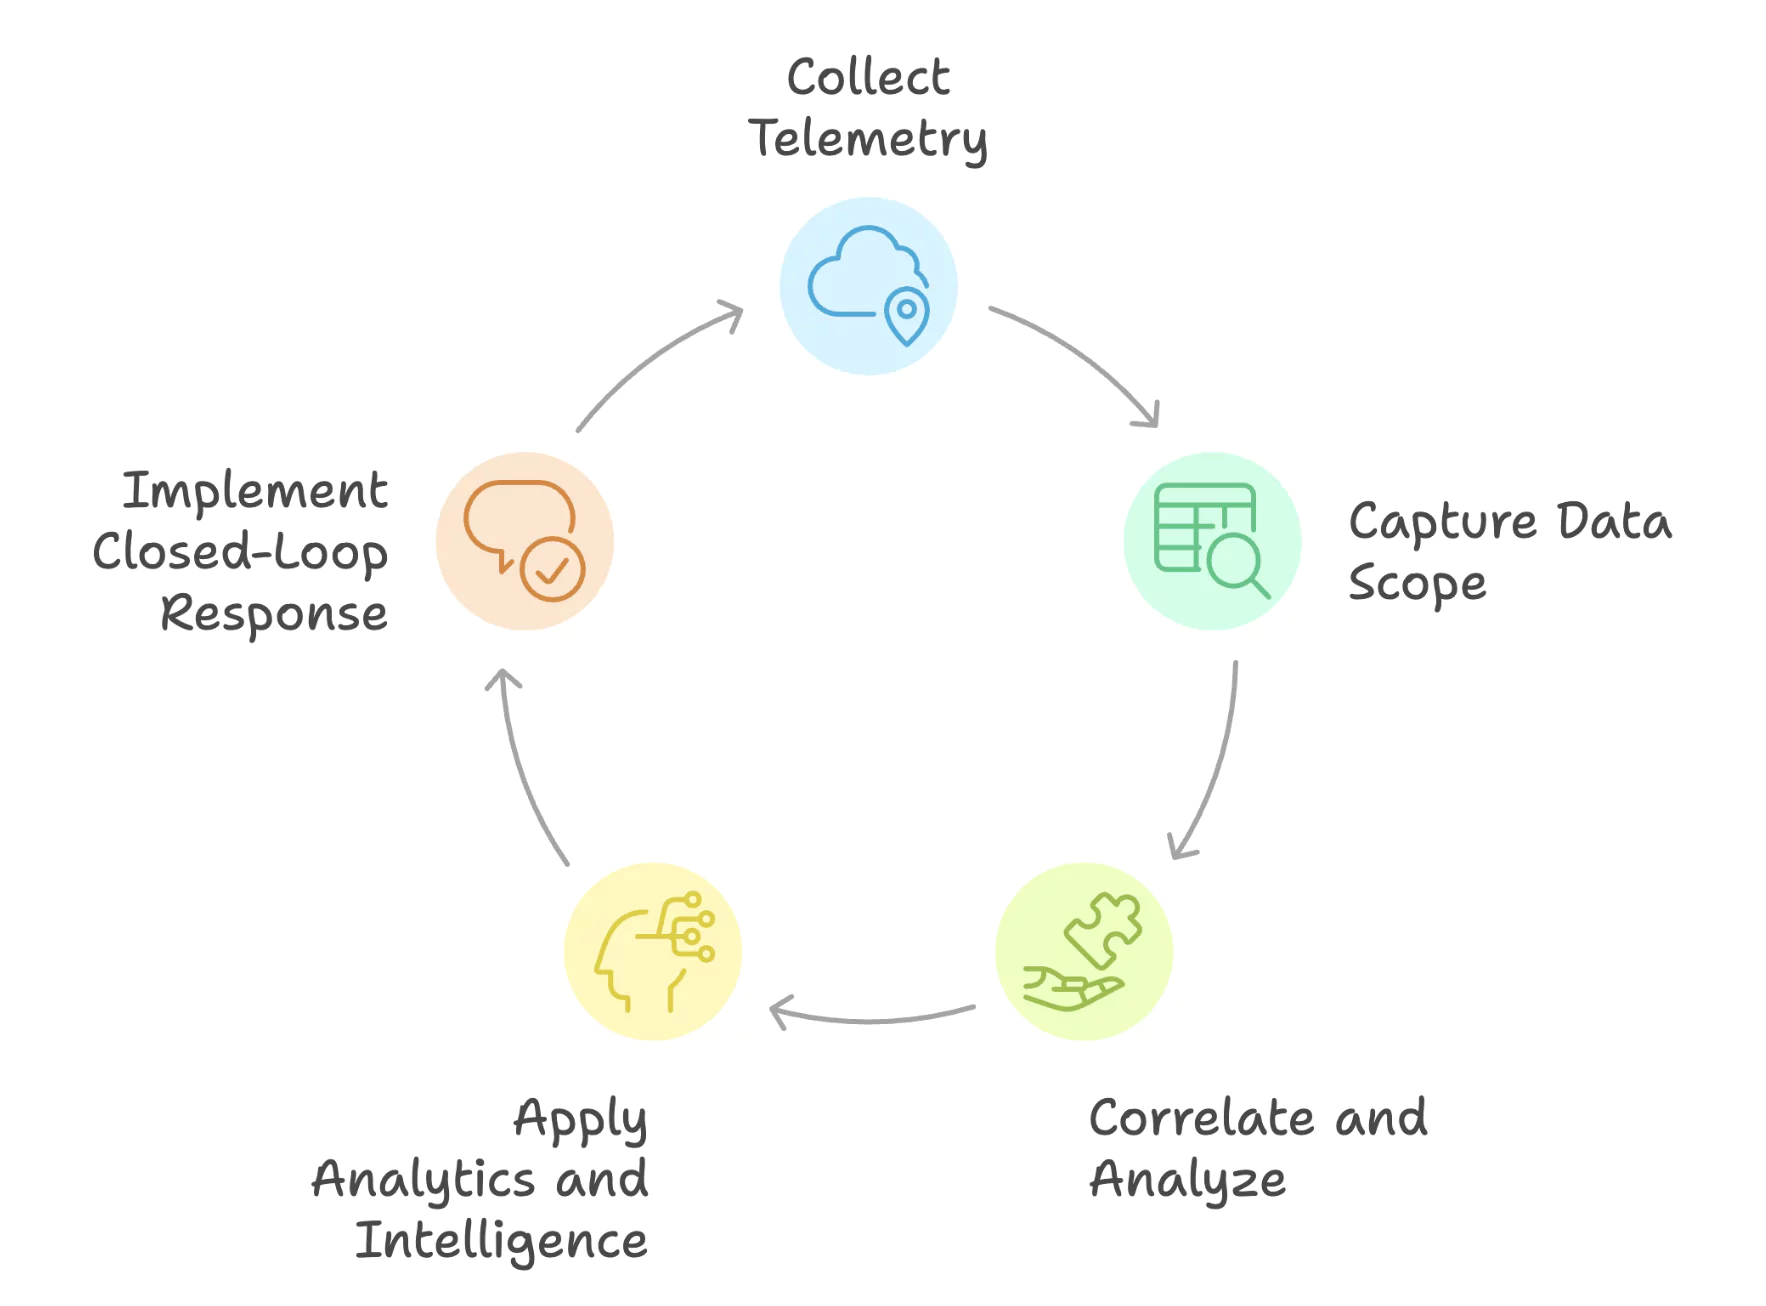
Telemetry collection
Monitoring begins with collecting telemetry from compute, storage, networking, and native services. Data is captured through VM agents, direct API integrations, or agentless methods using flow data and logs. Enterprises adopt hybrid models to balance visibility and overhead.
Data capture scope
Captured telemetry spans CPU utilization, memory allocation, and disk I/O, alongside health indicators such as latency, error rates, and packet loss. Logs add diagnostic depth, while distributed tracing maps transaction flows across services and regions.
Correlation and analysis
Metrics, logs, and traces are correlated to create a multi-dimensional performance view. High-cardinality metrics (per-user, per-pod, per-transaction) enable precision but increase volume and storage demands. Efficient cloud monitoring solutions balance depth with efficiency using performance forecasts, retention policies, and tiered storage.
Analytics and intelligence
Analytics engines apply thresholds, baselining, and machine learning to detect anomalies and forecast capacity. Because cloud workloads are elastic and dynamic, baselines vary continuously. Contextual intelligence associates anomalies with deployment events, configuration changes, or dependency failures.
Closed-loop response
Insights translate into action through smart alerts and automated issue resolution. Context reduces investigation time and improves resolution. Advanced systems trigger responsive actions such as scaling, restarts, or traffic rerouting, maintaining cloud uptime.
Core components and critical metrics in cloud monitoring
You can achieve cloud visibility by monitoring the following components with their associated performance and risk metrics:
- Compute (VMs, Instances): CPU utilization, memory, disk queue length, and system calls expose contention and scaling needs.
- Containers: Cluster health, scheduling efficiency, pod availability, and failure ratios ensure elasticity without stability trade-offs.
- Serverless functions: Invocation frequency, execution time, concurrency, and error breakdowns track workload responsiveness and efficiency.
- Databases: Query response, replication lag, throughput, cache hit ratio, and pool utilization prevent bottlenecks and maintain consistency.
- Networking: Latency, packet loss, jitter, congestion ratios, and flow logs define service quality and security posture.
- Storage systems: Latency, IOPS, throughput, error rates, snapshot durability, and utilization trends guide capacity planning.
- APIs and Gateways: Latency, error ratios, authentication failures, and request spikes monitor reliability and protect against overload.
- Load balancers: Request distribution, backend health, failover, and connection errors reduce risk of single-point failures.
- Native cloud services: Queue depth, throughput, cache performance, and IAM request patterns track managed services.
- Security metrics: Failed logins, privilege escalations, and policy misconfigurations strengthen compliance and resilience.
- Financial metrics: Cost per workload, efficiency, and budget variance connect infrastructure usage to business outcomes.
Challenges in cloud infrastructure monitoring
Ephemeral resources
Cloud-native architectures are built on containers, microservices, and serverless workloads, many of which exist for only a few seconds or minutes. Their short life cycles make failures hard to capture, as telemetry often disappears with the resource.
Use Case: In a data analytics pipeline, hundreds of containers work briefly to process workloads and terminate almost immediately. If an error occurs in one of these containers, traditional monitoring misses it, leaving engineers with no trace of the failure.
Solution: Modern monitoring tools must support continuous auto-discovery and automated retirement of resources. Record telemetry collection, along with short-term log retention, ensures dynamic workloads are still visible. This prevents diagnostic blind spots in highly elastic environments.
Multi-cloud and hybrid ecosystems
Workloads today span multiple providers like AWS, Azure, GCP, and on-premises systems. Each platform exposes its own APIs, metrics, and logging standards. These differences blur visibility and slow down troubleshooting.
Use Case: A financial services firm runs critical workloads across AWS, analytics in Azure, and compliance workloads on-prem. When a service degradation occurs, engineers must switch between multiple dashboards, delaying resolution.
Solution: Unified monitoring platforms populate KPI data from all providers into a normalized, centralized view. This enables end-to-end correlation of issues across heterogeneous environments without being tied to one vendor’s ecosystem.
Data volume
Cloud environments generate massive amounts of performance data, and dynamic scaling compounds the challenge. Without intelligent controls, monitoring teams drown in dashboards and miss meaningful patterns.
Use Case: During a holiday season spike, an e-commerce platform generates millions of metrics per minute across containers, APIs, and databases. Teams face alert flooding while customers experience failed checkouts.
Solution: Intelligent filtering, adaptive sampling, and ML-driven anomaly detection reduce noise. Monitoring platforms must distinguish between normal workload surges and genuine risks to digital experience, surfacing only signals that affect availability or revenue.
Monitoring cost
Telemetry ingestion, processing, and storage can grow faster than infrastructure costs themselves. Organizations that prioritize all KPI data equally often find monitoring bills overtaking compute spend.
Use Case: A SaaS company ingests logs from hundreds of microservices without retention controls, leading to monitoring costs higher than the infrastructure running the workloads.
Solution: Cost-aware monitoring enforces retention policies, prioritizes critical metrics, and applies tiered storage for historical data. This approach keeps compliance intact while controlling budgets.
Security and compliance
Visibility in the cloud cannot stop at performance; it must include governance, access, and configuration management. Security blind spots not only risk availability but also introduce regulatory non-compliance.
Use Case: A healthcare platform under HIPAA must validate that all sensitive data is encrypted in transit and that access privileges are tightly scoped. Manual audits leave gaps that expose the organization to compliance risk.
Solution: Automated compliance monitoring validates IAM configurations, encryption standards, and policy changes in real time. Audit-ready reporting strengthens both operational security and regulatory posture.
Alert fatigue
Excessive alerts from static thresholds overwhelm teams and reduce incident response effectiveness. This leads to misaligned priorities while escalating alarms; affecting response time and cloud availability.
Use Case: An enterprise configures identical CPU thresholds across hundreds of VMs. Overnight, thousands of non-critical alerts bury the single critical one signaling database failure.
Solution: Dynamic thresholds, dependency-aware correlation, and contextual updates ensure only high-impact alerts reach on-call engineers. This reduces noise, improves focus, and strengthens mean-time-to-resolution (MTTR).
Best practices for cloud infrastructure monitoring

Auto-discovery and multi-layer monitoring
Implement automated service discovery to ensure every new instance, container, or workload is monitored from the start. Extending monitoring across compute, storage, network, and vendor-native services builds a complete performance monitoring interface; eliminating blind spots in complex cloud environments.
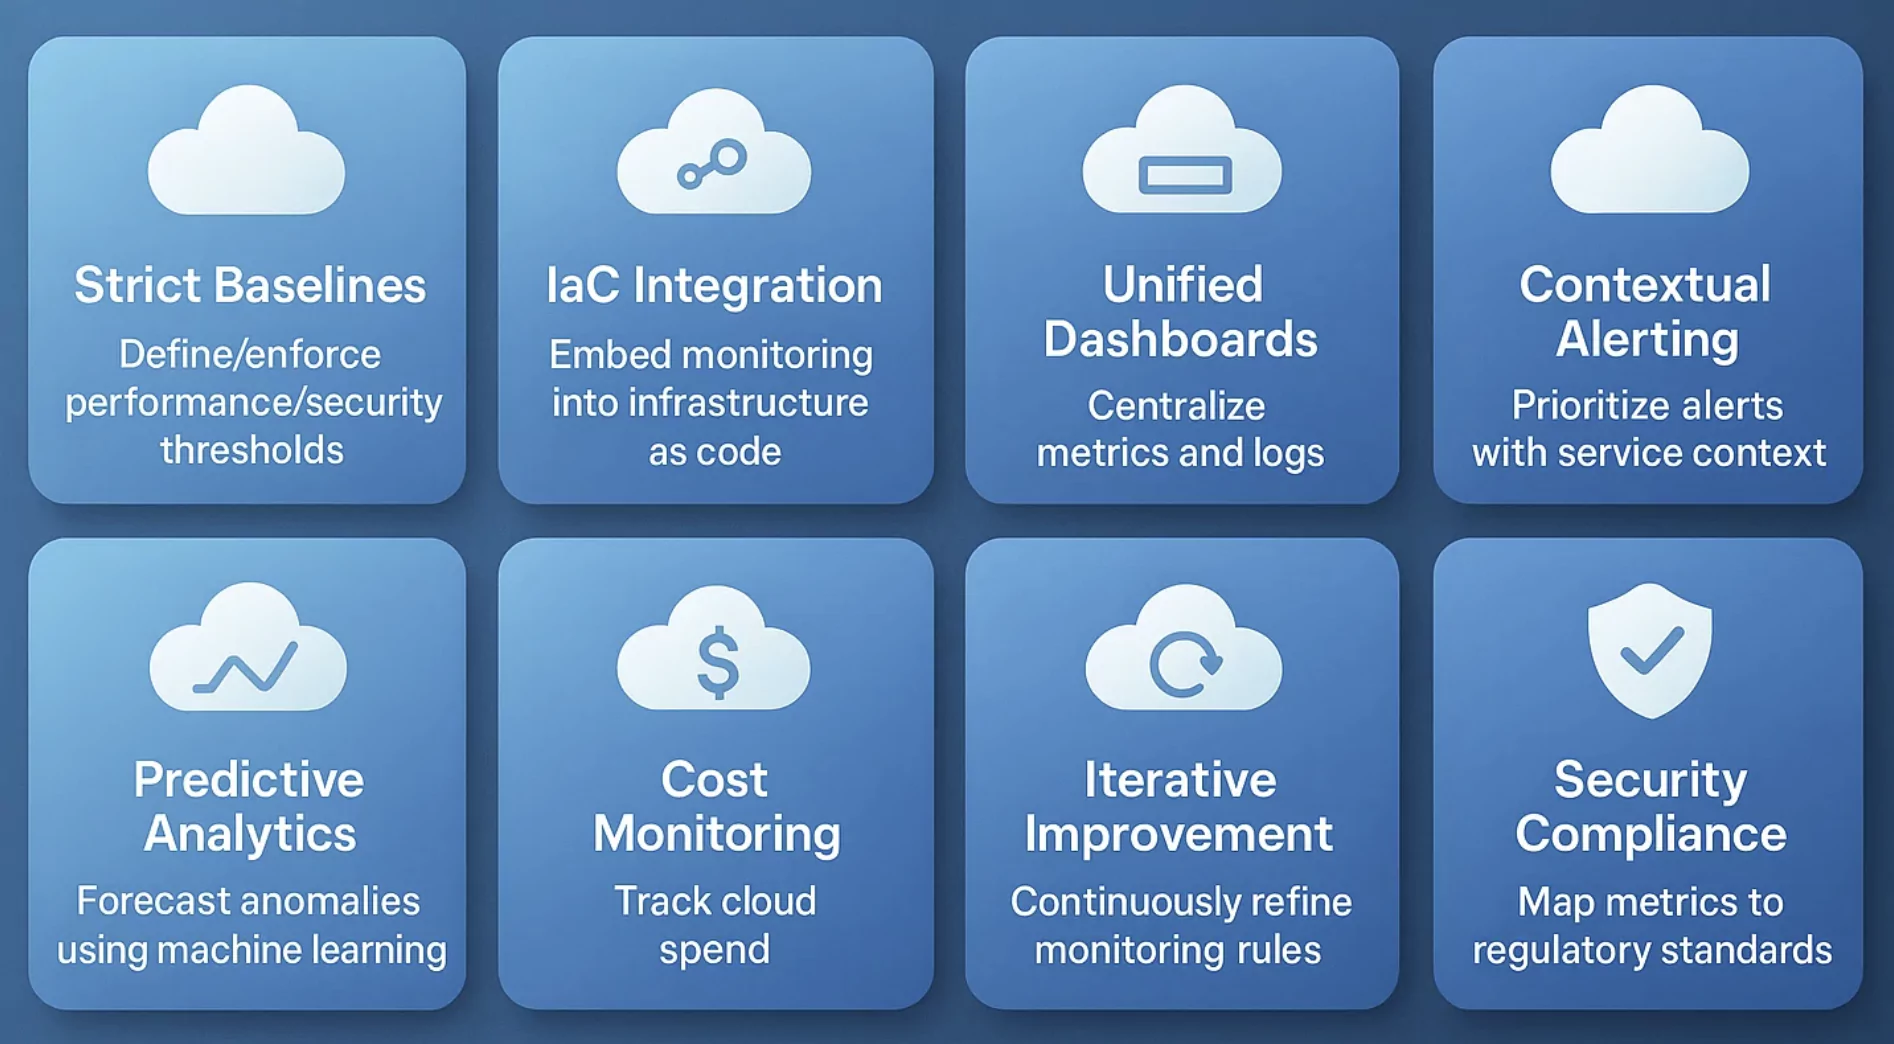
Establishing strict baselines
Configuring adaptive thresholds allows accurate anomaly detection and trend forecasting. They differentiate genuine anomalies from routine fluctuations, reducing false positives. They also form the foundation for SLA tracking and performance assurance.
Infrastructure as Code (IaC) integration
Embedding monitoring in IaC templates standardizes observability across environments. Every new resource inherits consistent metric coverage, reducing gaps caused by manual setup. This accelerates troubleshooting, prevents anomalies, and ensures compliance across dynamic deployments.
Unified dashboards
Centralized visibility across hybrid and multi-cloud environments reduces operational complexity. Single-pane dashboards enable correlation between systems and provide customized views for operations, developers, and finance. They directly support capacity planning, SLA enforcement, and executive reporting.
Contextual alerting
Alerts along with dependency maps and remediation tips provide actionable intelligence rather than raw signals. Teams gain context on the root cause and recommended next steps, reducing MTTR and preventing cascading failures.
Predictive analytics and remediation
Machine learning applied to historical performance data provides saturation points, cost spikes, and performance degradation. Predictive capabilities allow teams to act before service impact occurs. In layered environments, automated remediation closes the loop by executing fixes such as rightsizing, scaling, or routing adjustments.
Real-time monitoring and dashboards
Dynamic cloud environments demand continuous visibility. Unified dashboards bring together metrics, logs, and traces across providers, offering customizable views for operations, development, and business teams. This consolidated perspective reduces context switching and accelerates detection and response.
Integrated cost monitoring
Mapping resource utilization directly to cloud spend provides financial visibility. Monitoring detects underutilized resources, oversized configurations, and idle workloads. Such insights help organization with rightsizing infrastructure and enable cost governance. This transforms monitoring into a governance tool that aligns technical operations with business priorities.
Iterative improvement
Monitoring strategies must evolve with infrastructure changes. Dashboards, thresholds, and alert rules need regular updates as workloads and regulations vary. Frequent review cycles ensure cloud monitoring data comes in relevant for performance optimization, compliance, and threat detection.
Security and compliance monitoring
Continuous observation of IAM activities, encryption states, and policy adherence prevents misconfigurations and strengthens security. Automated alerts locate blindsided anomalies such as privilege escalations or drift from regulatory requirements. This ensures readiness for audits and resilience against attacks.
Choosing a cloud infrastructure monitoring tool
Selecting a cloud infrastructure monitoring solution directly affects operational efficiency and service continuity. Key evaluation criteria include:
ManageEngine Applications Manager addresses these requirements in a unified platform. It delivers agentless monitoring for AWS, Azure, Openstack, Oracle, Microsoft 365 and GCP services alongside on-premises systems. From a single console, IT teams gain deep insights into virtual machines, containers, databases, storage, networking, and serverless workloads. Key capabilities include:
- Unified monitoring across multi-cloud and hybrid environments.
- AI-driven baselining and anomaly detection.
- Granular application performance insights for precise troubleshooting.
- End-user monitoring and digital experience monitoring to validate real-world responsiveness.
- Configurable, context-rich alerts with escalation workflows.
- Cost insights to detect underutilized or oversized resources.
- Ready-to-use dashboards and reports for trend analysis and health tracking.
Conclusion
Cloud infrastructure monitoring underpins availability, efficiency, and compliance in modern digital ecosystems. By continuously tracking the health and performance of compute, storage, network, and provider-native services, organizations can detect risks early, optimize resources, and maintain regulatory standards without gaps. Effective cloud and infrastructure monitoring strategies convert operational complexity into competitive advantage through unified visibility, predictive analytics, and cost optimization.
With ManageEngine Applications Manager, enterprises gain this maturity faster. Its unified coverage, AI-driven insights, and cost-efficient model enable IT teams to move from reactive firefighting to proactive, predictive operations. By aligning infrastructure health with business outcomes, Applications Manager strengthens resilience, elevates end user experience, and maximizes the return on cloud investments.

