Using Real User Monitoring (RUM) for A/B testing and feature rollouts
Category: Digital experience monitoring
Published on: October 17, 2025
5 minutes
Every new feature release or design change in a web application comes with a familiar tension: will it make things better for users—or accidentally slow them down?
Modern teams deploy updates rapidly, often multiple times a day. While A/B testing helps measure how users respond to changes, it typically looks at behavioral outcomes—like conversion rates or engagement—without considering how performance differences between variants might influence those results.
That’s where Real User Monitoring (RUM) changes the equation. By tracking how real users experience each version of your site, RUM helps you see the complete story—not just which version converts better, but why. It connects front-end performance with user behavior, helping you make smarter, data-backed rollout decisions.
By connecting performance data to business outcomes, RUM turns what used to be guesswork into a science of precision-driven optimization.
Why performance needs to be part of every experiment
Traditional A/B testing tools are excellent for measuring business KPIs. But they often miss a crucial factor—how fast each version actually feels to the end user.
Let’s say you’re testing two designs for a product page. Version A is the current one, and Version B adds a new widget and some animation. If conversions drop in Version B, is it because users dislike the new design—or because the page now takes 1.5 seconds longer to load on mobile?
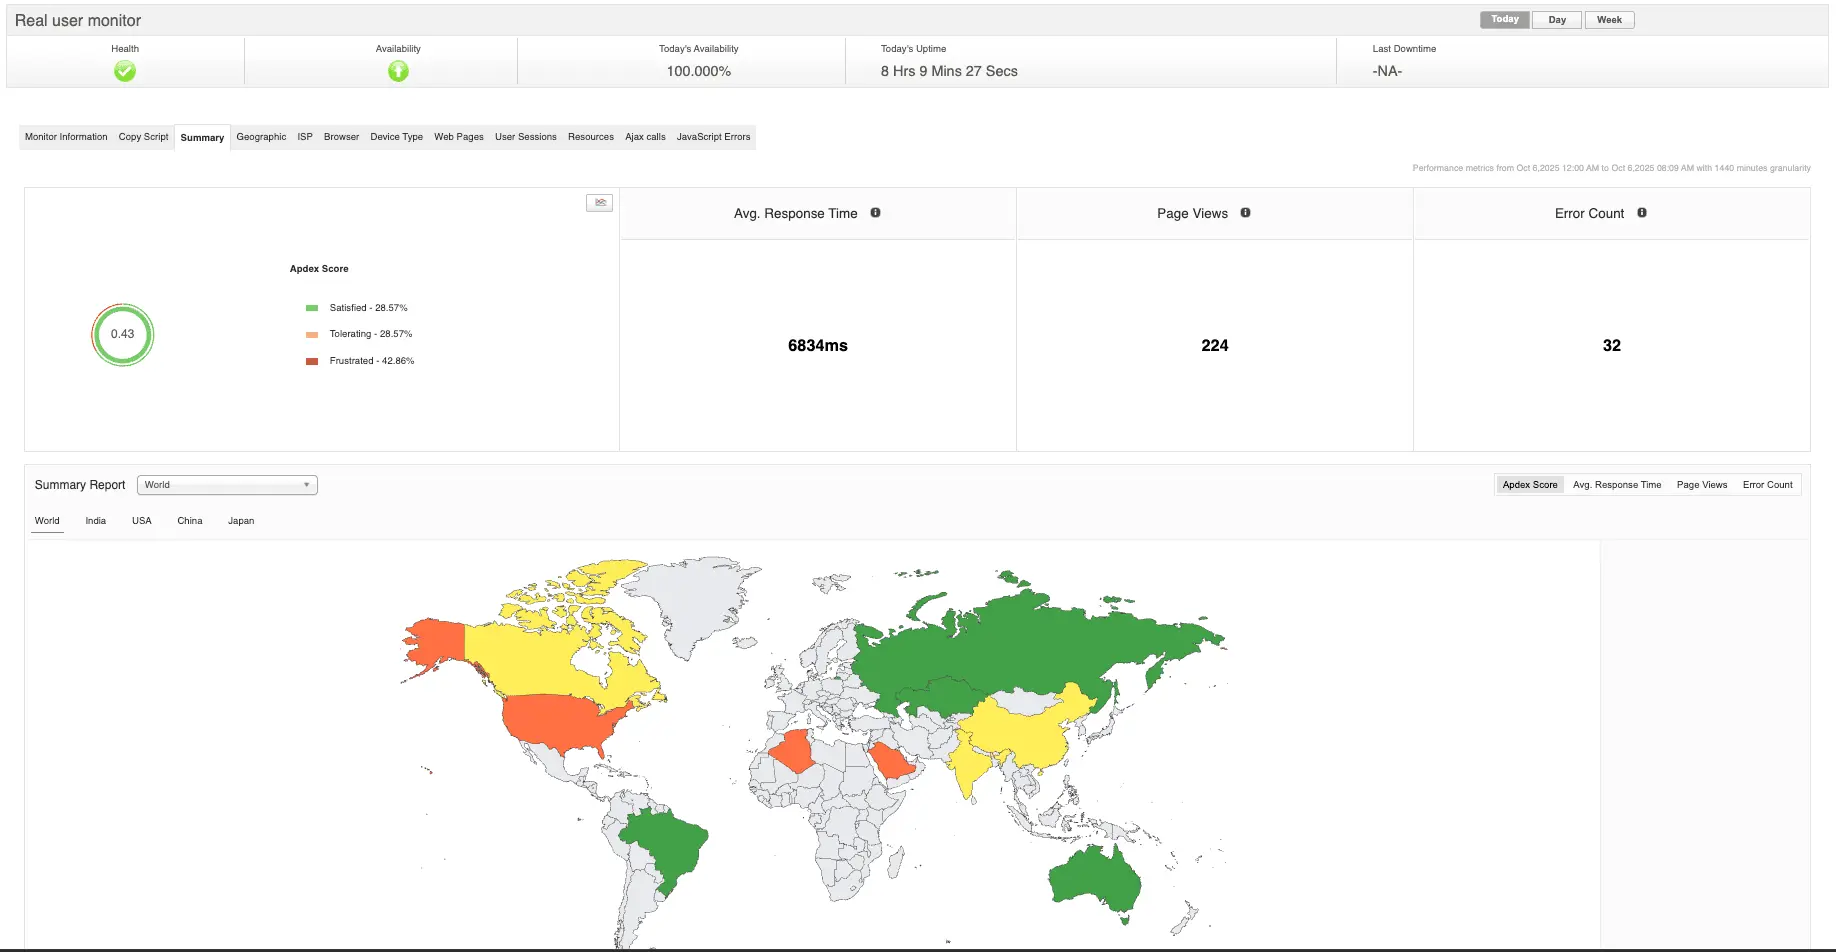
RUM brings that missing context. It records what users actually experience—page load times, layout shifts, input delays, network performance, and more. By correlating that with engagement and conversion data, you can separate performance issues from user preference.
In other words, RUM helps you avoid false conclusions and make decisions that reflect real user experience.
How RUM fits into A/B testing workflows
Integrating RUM into your A/B testing process adds a powerful new layer of visibility. Here’s how it typically works:
- Tag each variant: Every experiment version (A or B) is tagged in the RUM instrumentation so that data can be compared accurately.
- Capture real-world data: RUM collects Core Web Vitals (LCP, INP, CLS, etc.), navigation timings, and device/network context for each variant.
- Correlate performance and outcomes: These metrics are matched against business KPIs like click-throughs, signups, or purchases.
- Analyze patterns: You can then see not just which version wins, but how performance differences contribute to that win—or loss.
This approach bridges two traditionally separate perspectives—user experience analytics and technical observability—into one cohesive framework for decision-making.
What to measure when combining RUM and experiments
Performance influences how people interact with your site at almost every level. When you combine RUM data with A/B testing, there are three main aspects to look at:
1. Checking for performance parity
Before declaring one variant a winner, you need to ensure both versions perform similarly. If one is heavier, slower, or less stable, it can distort your results.
For instance, if Version B’s Largest Contentful Paint (LCP) is consistently 30% slower on mobile, it might appear to perform worse in engagement—when the real issue is loading speed, not design. RUM helps you catch this early, ensuring your tests remain fair.
2. Understanding conversion behavior under real conditions
By grouping user sessions by load speed or interaction time, you can see how conversion rates shift across performance thresholds. Maybe conversions stay stable until a page takes longer than 3 seconds to load, after which they drop dramatically.
This kind of insight helps you determine not just which design performs better, but which one holds up under real-world network variability.
3. Accounting for user context
Different environments reveal different truths. A page that loads fine for desktop users in the U.S. might struggle for mobile users in Asia on slower networks. RUM lets you break down performance by region, device, or browser so you can see where each variant performs best—or worst.
This contextual visibility is especially useful for global applications with diverse audiences.
How RUM supports smooth feature rollouts
Beyond experiments, RUM plays a vital role during feature rollouts—especially when using progressive delivery or canary deployments. It ensures new releases don’t degrade user experience as exposure increases.
Here’s how RUM fits into the rollout process:
- Before the rollout: Use RUM to benchmark the performance of your current stable version. This gives you a baseline to compare against as new features go live.
- During controlled rollout: As you gradually expose a feature to a small percentage of users, RUM tracks its real-time performance. If it detects issues—like rising layout shifts or input delays—you can pause or rollback before they impact the entire user base.
- After full release: RUM continues to monitor user experience to ensure long-term stability. If performance dips after scaling (due to cache misses, load balancing changes, or third-party dependencies), it helps catch those issues early.
In short, RUM provides the safety net that allows teams to move fast without breaking performance.
Turning data into meaningful decisions
RUM generates a wealth of performance data—sometimes too much to digest without structure. To make sense of it, teams typically rely on focused analytical models, such as:
- Correlation analysis to link performance metrics with conversions
- Segment-based comparisons to analyze different user groups
- Anomaly detection to flag unexpected slowdowns during rollouts
- Performance heatmaps to visualize how load times vary by geography or device
These insights help teams understand not only which version performs better, but also why. That makes RUM an essential part of an intelligent experimentation strategy, rather than just a monitoring add-on.
Challenges to keep in mind
While powerful, integrating RUM with A/B testing and rollout systems does come with challenges:
- Data overload: RUM captures millions of data points; without proper aggregation, analysis can become unwieldy.
- Browser differences: Not all browsers report metrics the same way—normalizing this data is essential for accurate comparison.
- Variant attribution: Mapping RUM data back to experiment variants requires precise tagging and session management.
- Statistical rigor: Correlation doesn’t always equal causation. Teams need to combine performance data with proper A/B test methodologies to make valid conclusions.
Solving these challenges requires collaboration between engineering, analytics, and product teams—ensuring technical and behavioral data tell a consistent story.
Bringing it all together with Applications Manager
Analytics tools like AWS CloudWatch RUM or Google Analytics give you raw data, but they often operate in silos—tracking performance separately from user behavior or feature rollout metrics.
That’s where a unified platform like ManageEngine Applications Manager helps. Applications Manager connects RUM data with synthetic monitoring,APM traces, and experimentation results in a single view. Teams can drill down from a conversion drop to the exact latency issue behind it, or from a slow rollout metric to the specific API responsible.


By combining technical visibility with business impact, Applications Manager enables what you could call performance-aware experimentation—where every rollout, feature test, and user experience improvement is guided by real, measurable data from your users. With Applications Manager, RUM becomes more than a diagnostic tool—it becomes a feedback engine that keeps your releases fast, stable, and data-driven.
Want to see it in action? You can schedule a personalized demo or download a 30-day free trial and experience what unified monitoring feels like.

