How Real User Monitoring (RUM) helps identify high drop-off pages
Category: Digital experience monitoring
Published on: October 17, 2025
7 minutes
In the world of digital experiences, small delays can have big consequences. A few hundred milliseconds can decide whether a visitor stays on your site or leaves. While most optimization efforts focus on design or messaging, there’s another layer that quietly influences conversions—how fast and smooth your application feels to real users.
That’s where Real User Monitoring (RUM) comes in. It provides live, field-level data about what actual users experience when they interact with your website or app. Beyond simple performance tracking, RUM helps you identify where users are leaving and why—especially when those exits are tied to technical performance issues rather than design or content flaws.
By connecting performance data to business outcomes, RUM turns what used to be guesswork into a science of precision-driven optimization.
Understanding what really causes drop-offs
A “drop-off” happens when users abandon a specific step in your digital journey—be it a landing page, a signup form, or a checkout process. Tools like Google Analytics can show where those exits occur, but they can’t explain why they happen.
The missing piece is user experience under real-world conditions. Slow load times, input delays, layout shifts, or network bottlenecks can frustrate users enough to leave, even if your content or design is perfect.
RUM closes this gap. It links user behavior (exits, bounces, conversions) with technical data (load times, interaction delays, rendering metrics), giving teams a full picture of the conditions that lead to abandonment.
How RUM captures and connects experience data
RUM works by embedding lightweight monitoring scripts into your website or application. These scripts collect real-time data directly from users’ browsers or devices as they interact with your pages.
The key data points typically include:
- Core Web Vitals: Largest Contentful Paint (LCP), First Input Delay (FID), Interaction to Next Paint (INP), and Cumulative Layout Shift (CLS)
- Timing metrics: Time to First Byte (TTFB), DNS resolution, connection setup, and resource download durations
- Error events: JavaScript errors, failed resource loads, and timeout occurrences
- Session context: Browser type, operating system, network conditions, and device category
Once collected, these signals are processed and correlated with engagement and conversion data. This cross-layer correlation helps teams uncover how real-world performance conditions affect behavior—for instance, how a one-second delay on a product page reduces conversions by 20%.
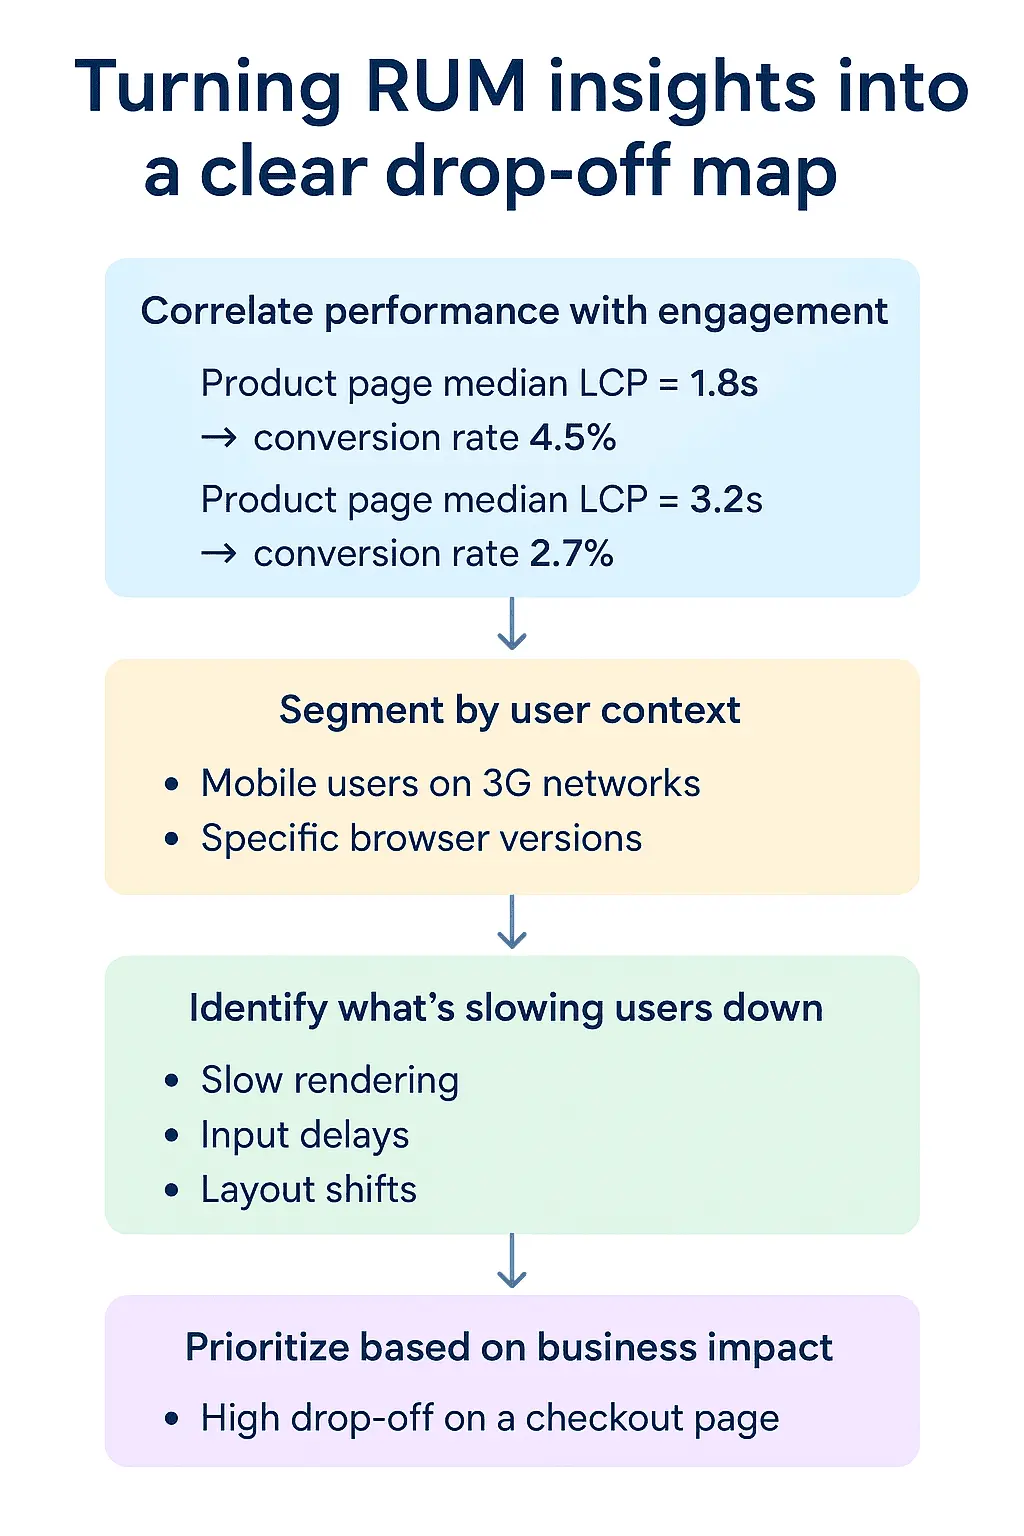
Turning RUM insights into a clear drop-off map
RUM’s real power lies in its ability to show not only where users drop off, but why. To make that connection, teams generally follow a structured process:
1. Correlate performance with engagement
Start by comparing performance metrics against user engagement. For example, a product detail page with a median LCP of 1.8 seconds may see a 5% conversion rate, while one loading at 3.5 seconds drops to 2.5%.
This kind of correlation directly links latency to conversion loss—quantifying the cost of slowness.
2. Segment by user context
Performance issues often affect some users more than others. RUM allows you to break
down metrics by device type, location, or network condition.
For example:
- Mobile users on slow 3G networks may see drastically higher abandonment rates.
- Users in certain regions may experience server latency or CDN issues.
- Older browsers might render heavy JavaScript bundles poorly.
By segmenting in this way, you can focus optimization efforts where they matter most.
3. Identify what’s slowing users down
RUM data lets you trace where in the page lifecycle users get frustrated—whether it’s during loading, rendering, or interaction. Common patterns include:
- Slow rendering: Users leave before content is visible.
- Input delays: The interface feels sluggish due to JavaScript blocking.
- Layout shifts: Visual instability causes misclicks or confusion.
By analyzing timing events, teams can isolate the exact technical issue causing the behavioral drop.
4. Prioritize based on business impact
Not every page carries the same weight. A high drop-off on a blog post is less critical than one on a checkout page. Integrating RUM with business KPIs—like revenue contribution or lead value—helps rank optimization priorities by impact.
In this way, RUM transforms raw telemetry into business intelligence, quantifying every performance fix as a measurable gain in conversions or revenue.

Diagnosing performance-related drop-offs
After identifying high drop-off pages, RUM helps diagnose the underlying cause. Common culprits include:
- Unoptimized assets: Oversized images or uncompressed scripts slowing load times
- Third-party integrations: Marketing pixels, chatbots, or analytics scripts blocking rendering
- Server latency: High TTFB pointing to slow API responses or backend inefficiencies
- Heavy client-side processing: Large JavaScript bundles blocking the main thread
- Edge delivery gaps: Poor CDN caching or geographic replication
Because RUM captures actual user sessions, you can trace the issue from the user’s perspective—seeing exactly what went wrong and when.
Putting RUM insights into action
Detecting the problem is just the beginning. The real advantage comes from integrating RUM data into your optimization workflows.
- Developers can use RUM dashboards to monitor regressions after every release.
- UX designers can understand how page stability and responsiveness affect engagement.
- Product managers can track how performance improvements translate to conversion gains.
- Business analysts can measure ROI by linking speed improvements to revenue lift.
BRUM, when integrated into agile or DevOps pipelines, ensures performance optimization becomes a continuous discipline rather than a one-off fix.
Building continuous optimization loops
In more advanced organizations, RUM doesn’t just sit in dashboards—it actively feeds into deployment pipelines and monitoring workflows.
Some of the most common applications include:
- Regression detection: Automatically flagging pages that slow down after code changes
- SLO monitoring: Ensuring 95% of sessions meet defined load time objectives
- A/B validation: Measuring whether new UI variants affect performance and conversion differently
- Roadmap prioritization: Guiding development focus using data-backed user impact
This feedback loop keeps performance tied to both technical reliability and business growth.
Turning insight into action with Applications Manager
While native RUM tools provide valuable data, they often focus narrowly on performance metrics. The real challenge is connecting those metrics with business performance—and that’s where integrated platforms like Applications Manager come in. It helps you unify RUM data with synthetic monitoring,APM traces, and conversion analytics, all within a single pane of glass. This end-to-end visibility allows you to move seamlessly from identifying a high drop-off page to quantifying its business cost and validating the ROI of your fix.
With Applications Manager, it’s no longer about just finding which pages are slow—it’s about understanding how much that slowness costs your business. It connects technical data to real outcomes, allowing engineering, product, and business teams to align on one truth: faster experiences drive stronger results. Tools like Applications Manager turn that visibility into tangible growth. When every second matters, that kind of insight isn’t just valuable—it’s transformative.


Want to see it in action? You can schedule a personalized demo or download a 30-day free trial and experience what unified monitoring feels like.

