Windows Desktop Application Monitoring
Monitor your stand-alone Windows desktop applications developed in the .NET platform with the APM Insight .NET agent from Applications Manager. Gain visibility into your console applications as well as the performance of your method calls.
How it works
In general, the APM Insight .NET agent monitors .NET applications hosted in IIS Servers. By default, contextual information is instrumented and reported for HTTP requests from these applications' web transactions.
Since Windows desktop and console applications don't communicate via HTTP requests, their default methods are monitored with the help of custom instrumentation to track their application performance.
With the help of Custom Instrumentation Manager, you can monitor exceptions, database calls, web service calls, and third-party packages like loggers, caching, and NoSQL calls. To view the performance of each individual transaction, use Custom Instrumentation Manager to add additional methods from application-dependent dynamic-link library (DLL) files.
Configuration instructions
- Log in to your Applications Manager account, navigate to APM Insight tab and download the .NET Agent. For details, refer these installation instructions.
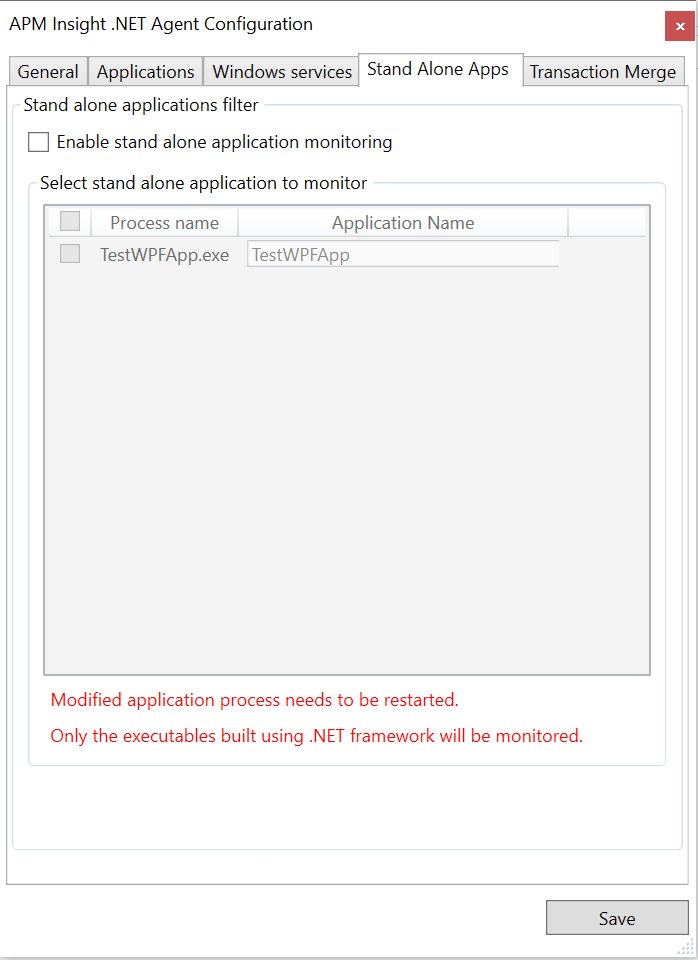
- After installing the agent, select the Enable standalone application monitoring checkbox in the Edit configurations dialogue box and click Save.
- Select the standalone applications to be monitored.
- Provide a unique name for each application selected in the text box under the column Application Name and Click Save.
- Restart the standalone applications to be monitored.
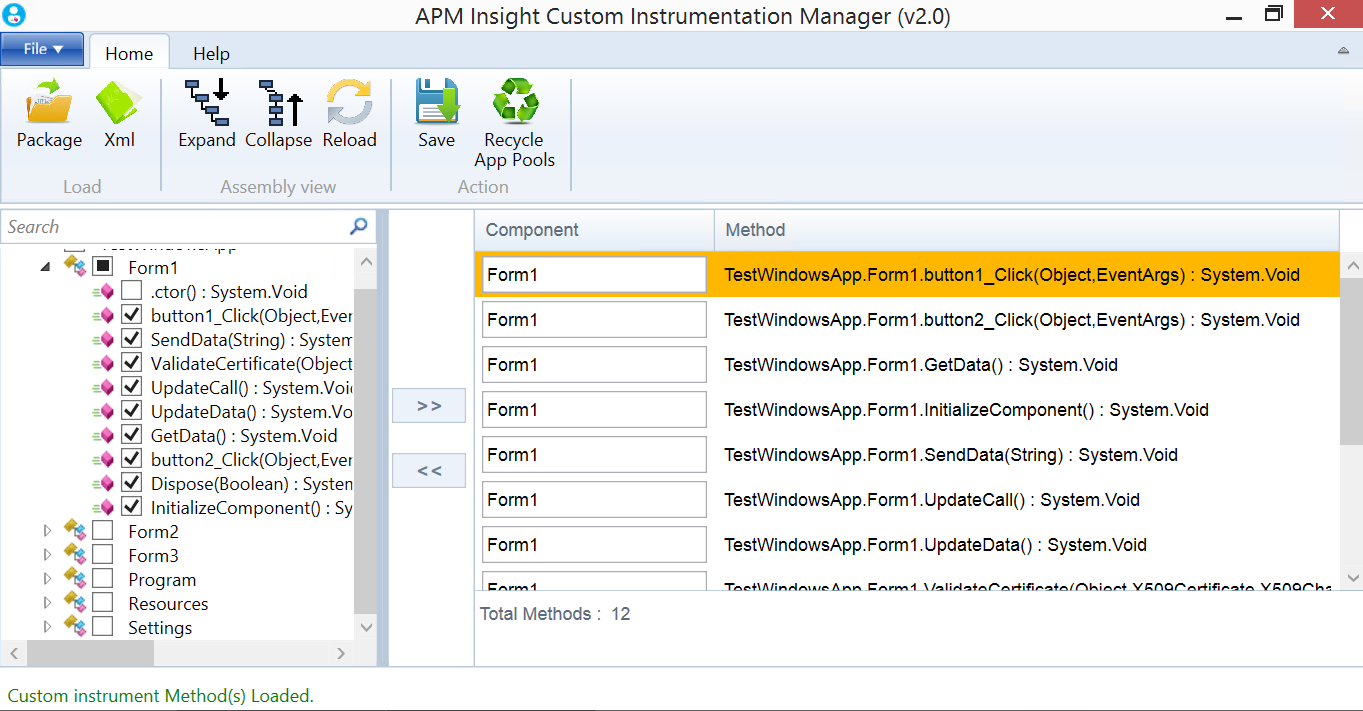
- To monitor more methods, add the add the corresponding DLLs of the standalone apps in Custom Instrumentation manager and select the frequently called primary methods.
- Restart the application.
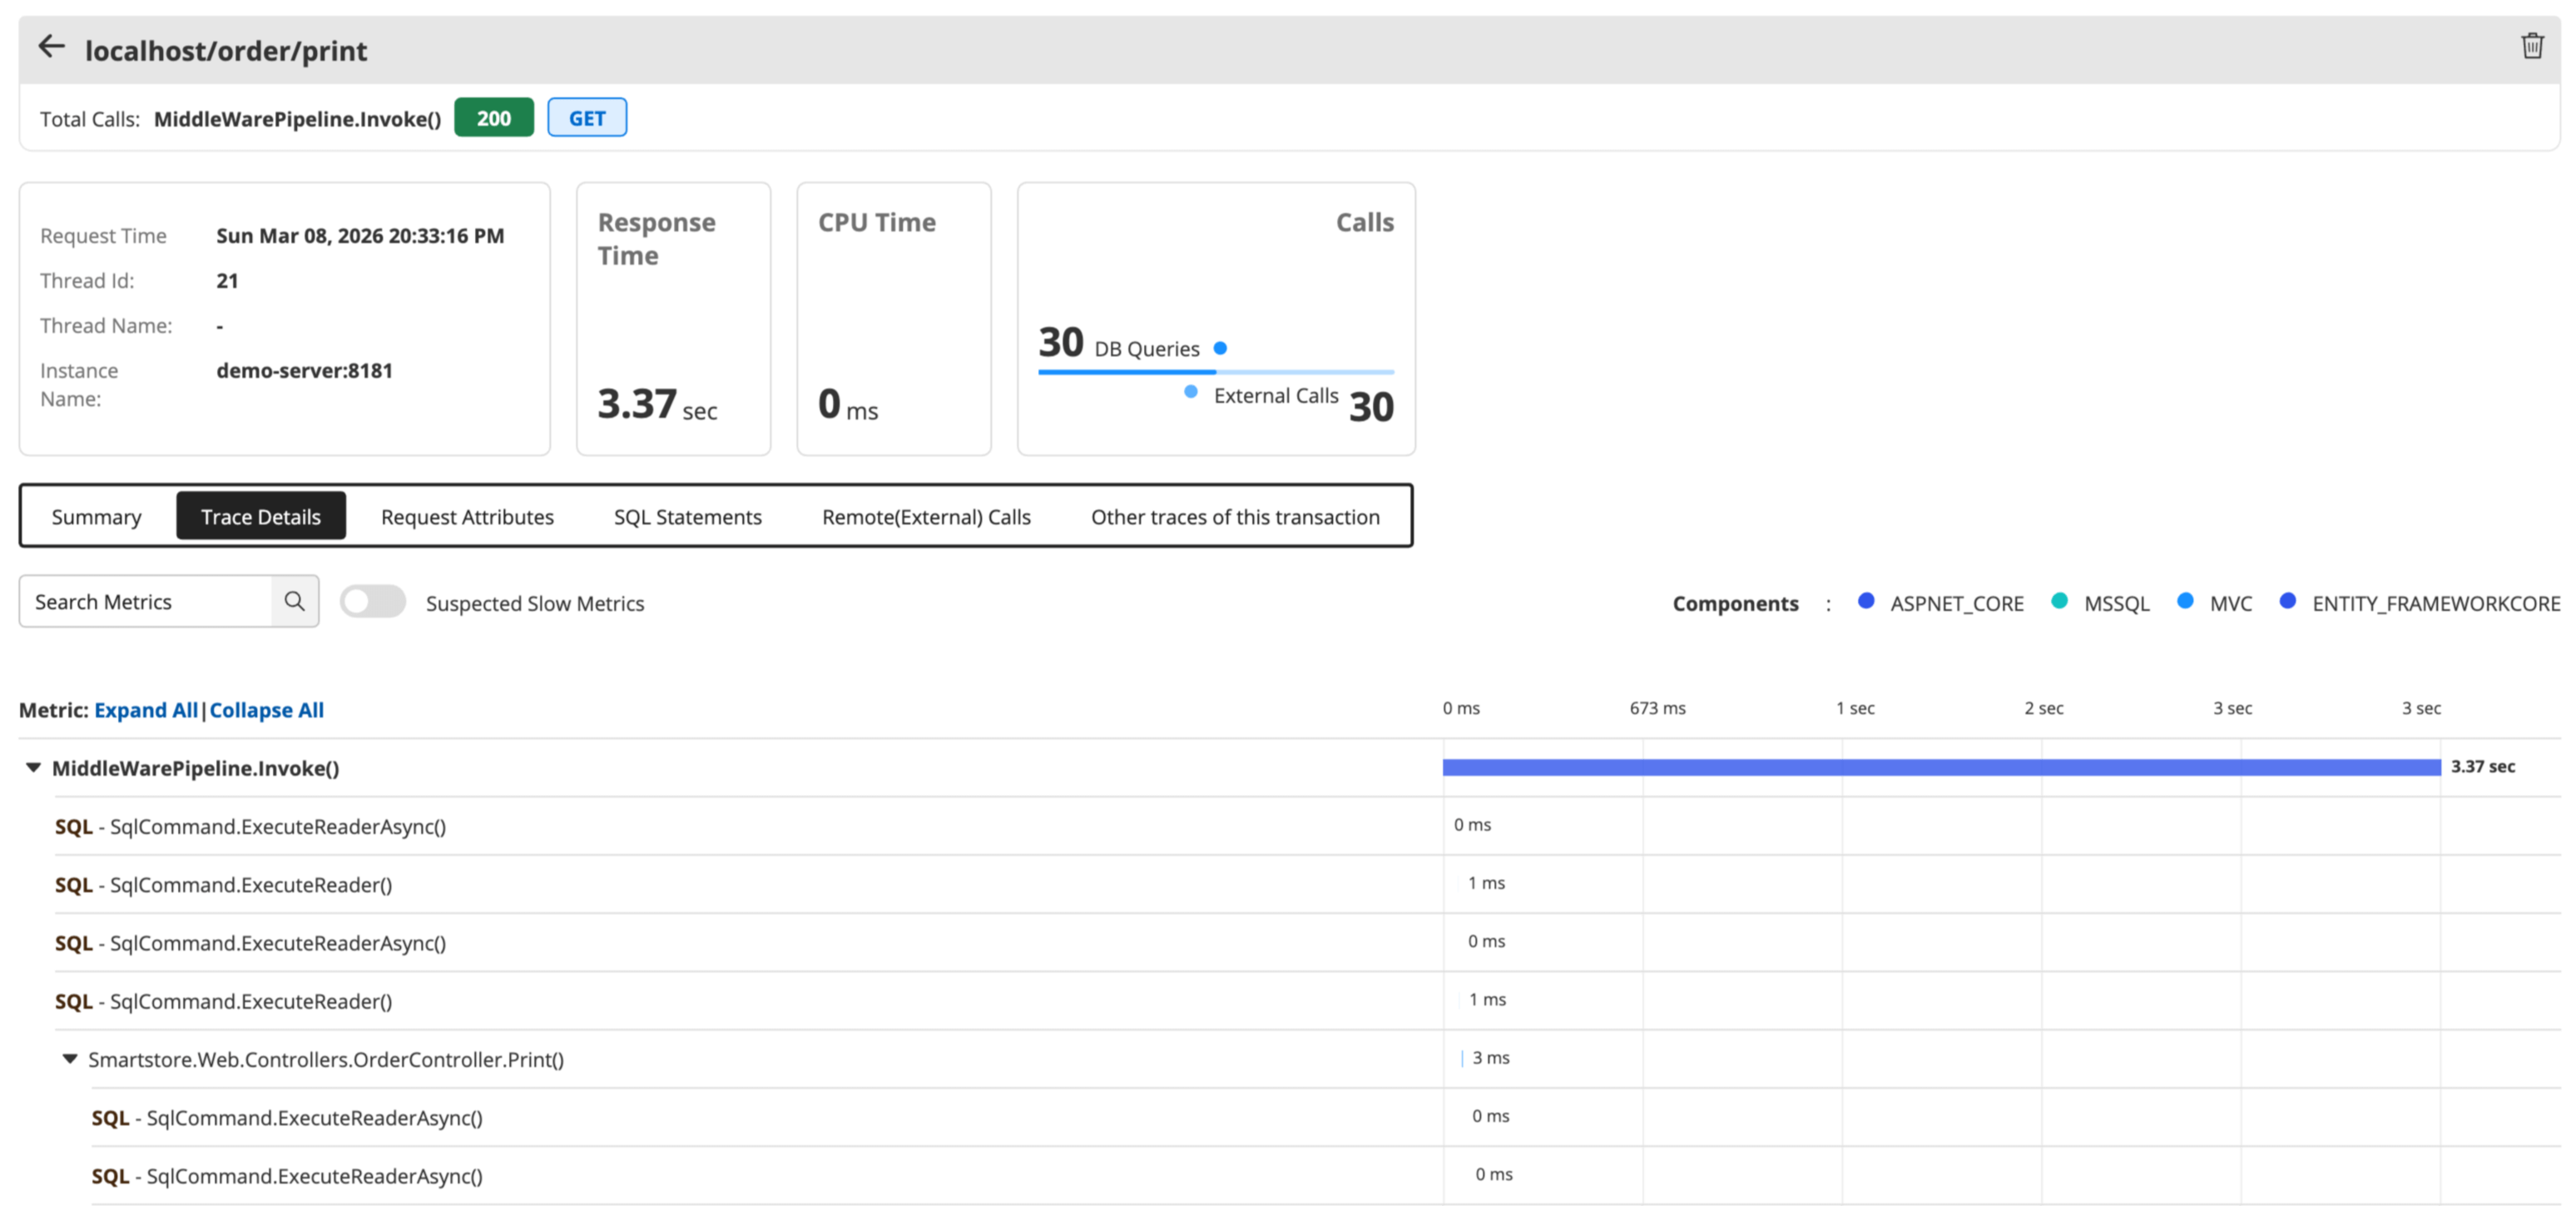
Output
To view the output of monitored methods, navigate to APM → Your APM Insight DOTNET Application/Instance → Transactions → Recent 5 Traces of this Transaction → Trace details.