Service Maps
Service Maps give you a complete overview of your application infrastructure along with its connection to other dependent resources. With Service Maps, you can view:
- The status of your application and instances
- Key metrics like Response time, Throughput and Status of connection
- Number of failed request count
This helps you to detect and troubleshoot your application problems before your customers are impacted.
Viewing Service Maps
To view Service maps:
- Log into your Applications Manager account and go to APM tab.
- Choose your application or instance.
- Click on Service Maps tab for topological view of your application infrastructure.
Note:
- Service maps do not need any configuration.
- Service map is not supported for Ruby agent.
Metrics and Inference
Service maps can be visualized in the following views:
Map View
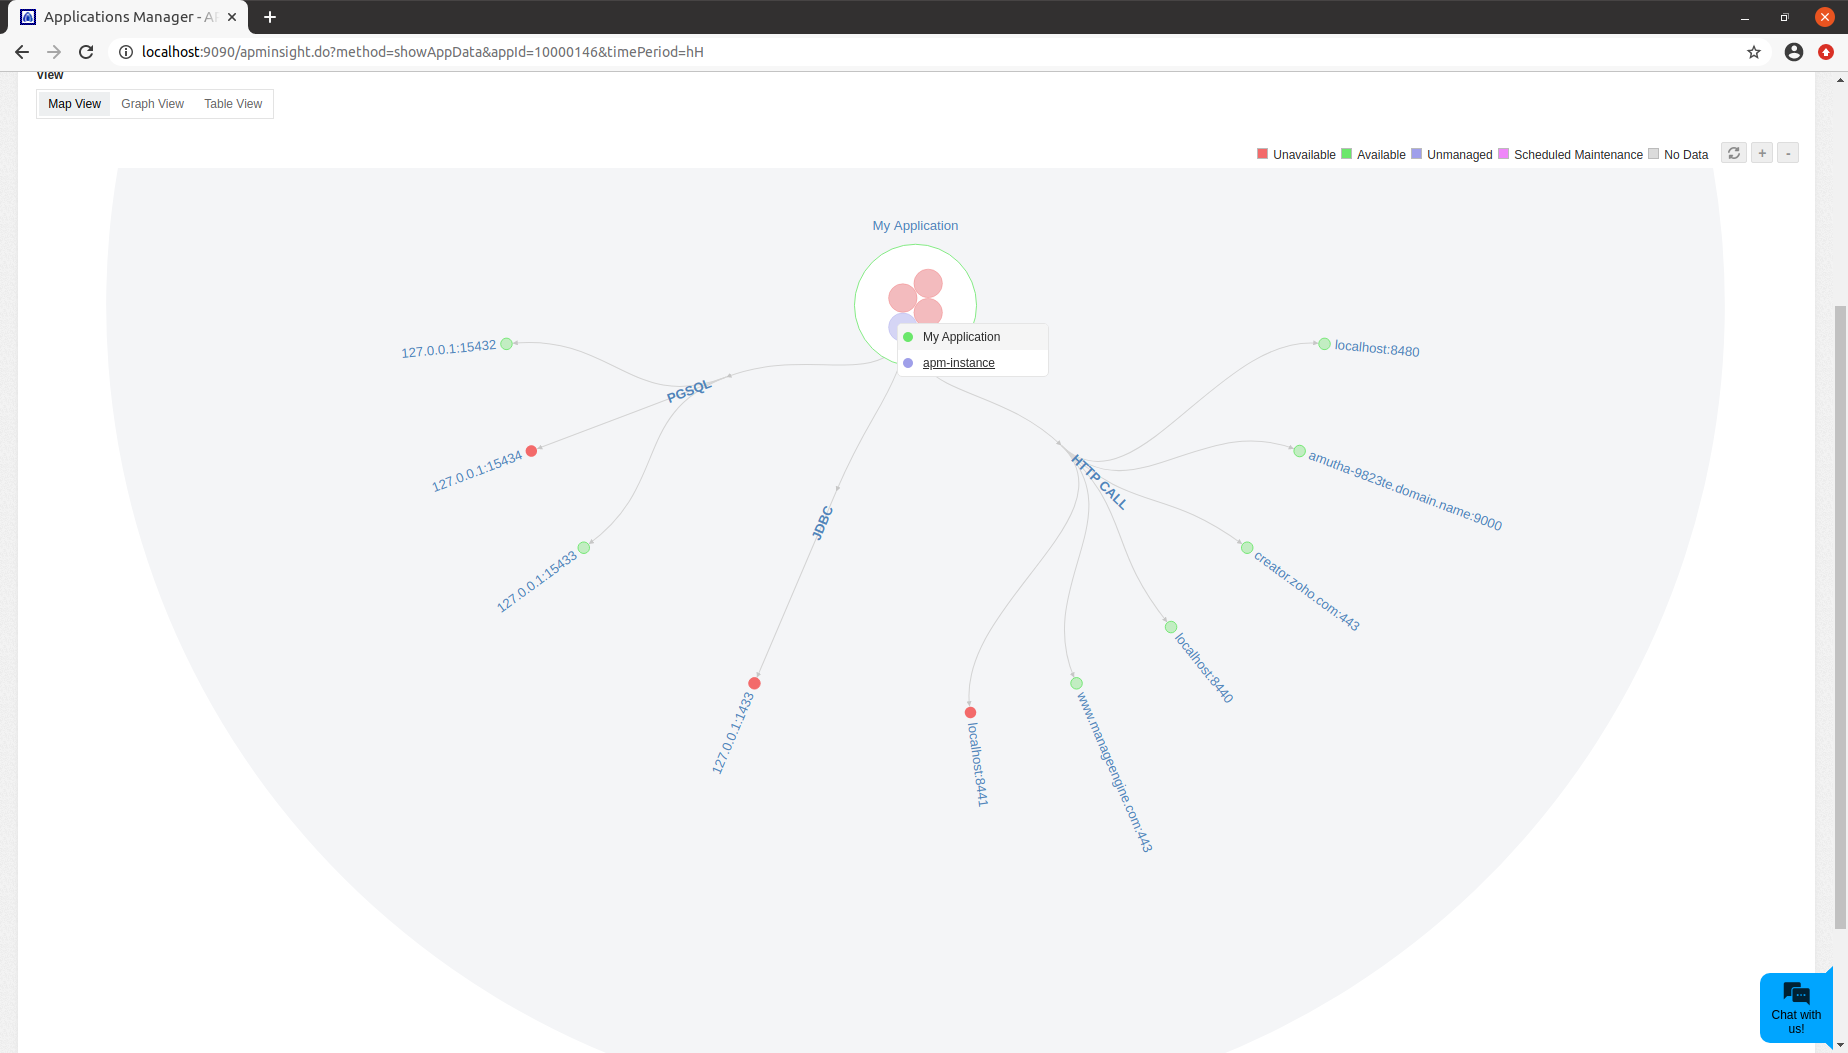
- Map View provides the way of analyzing the topological view of your application.
- In Map view, application along with their instances are represented in the central node.
- The outer fully enclosed circle in the center of the semi circle represents the Application.
- The inner enclosed circle represent each of the application instance.
- Green indicates application/instance is UP.
- Red indicates application/instance is DOWN.
- Purple indicates application/instance is Unmanaged.
- Pink indicates application/instance is under Scheduled Maintenance.
- On hovering the outer enclosed circle displays the application name.
- On hovering the inner enclosed circle displays the instance name.
- On clicking the Instance name in the tooltip,it redirects to the particular Instance.
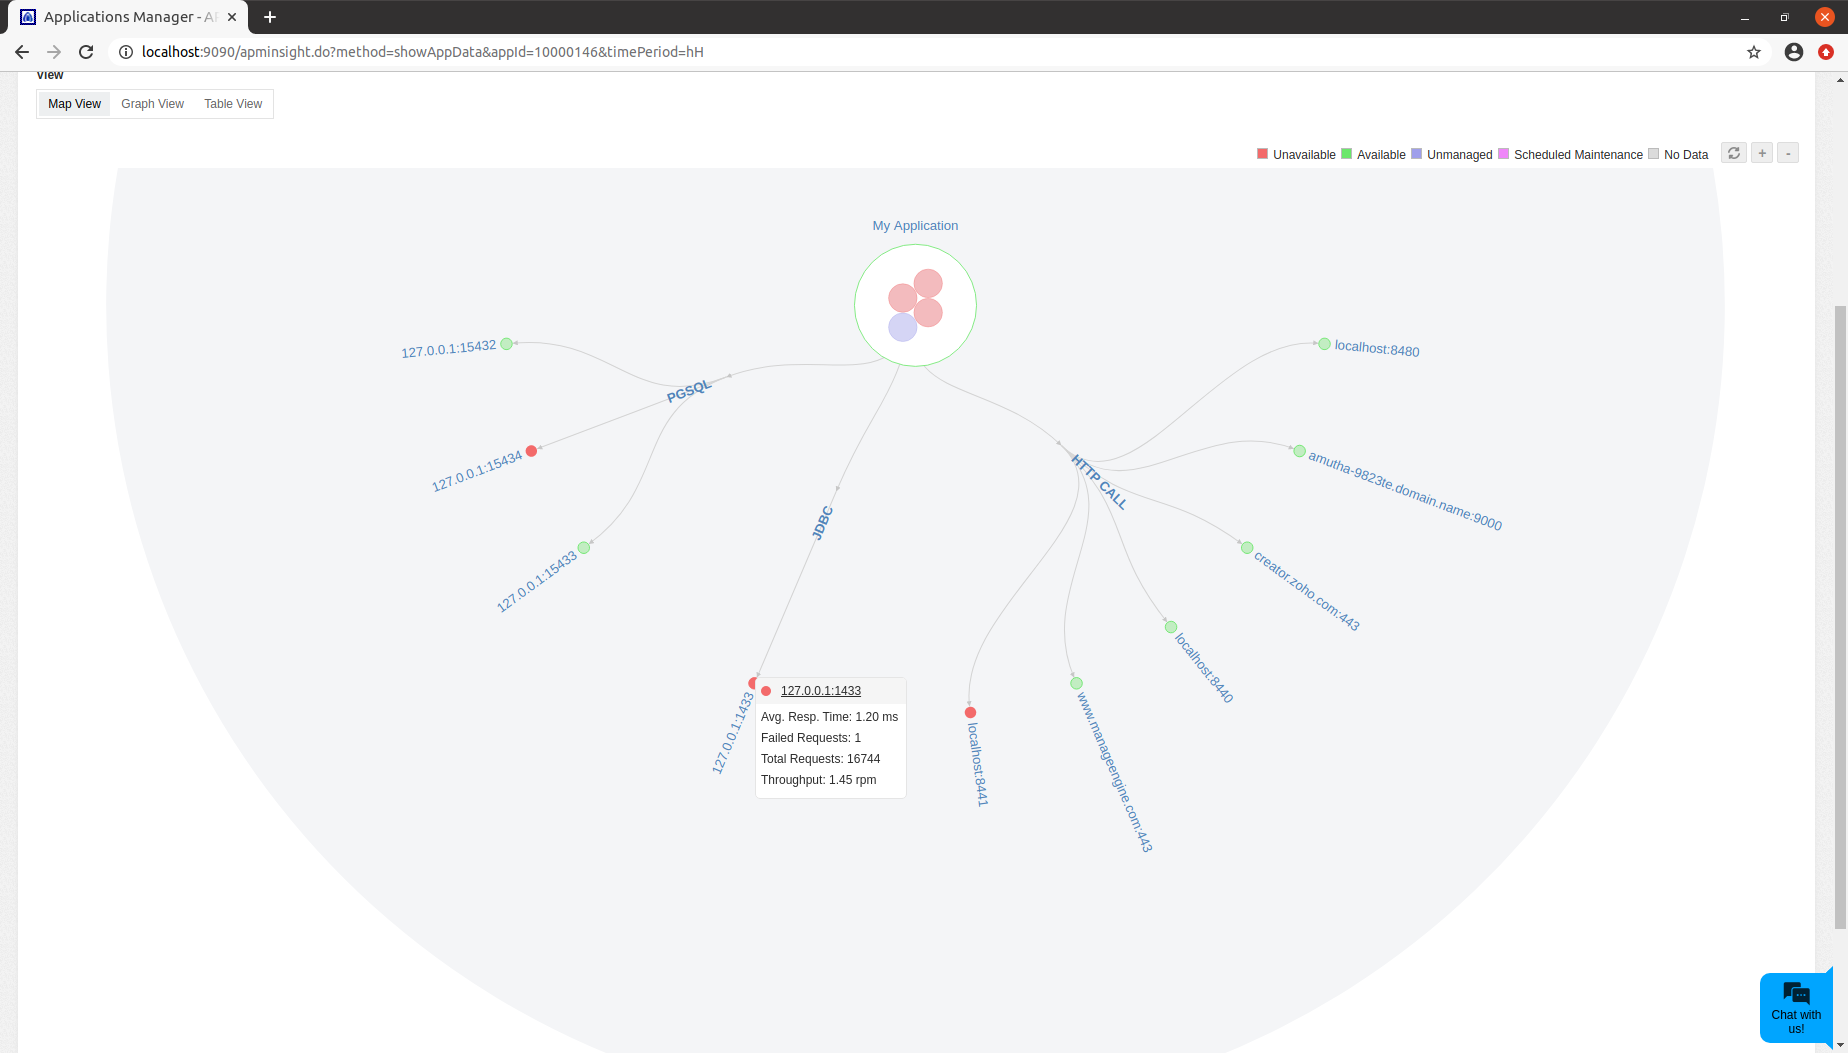
- On hovering each of the components, displays the status of that component with the metrics mentioned below:
- Average Response Time
- Failed Requests
- Total Requests
- Throughput
- In case of Failed Request,the component status indicated in Red.
- On clicking the component name in the tooltip,it redirects to its graph view.
Graph View
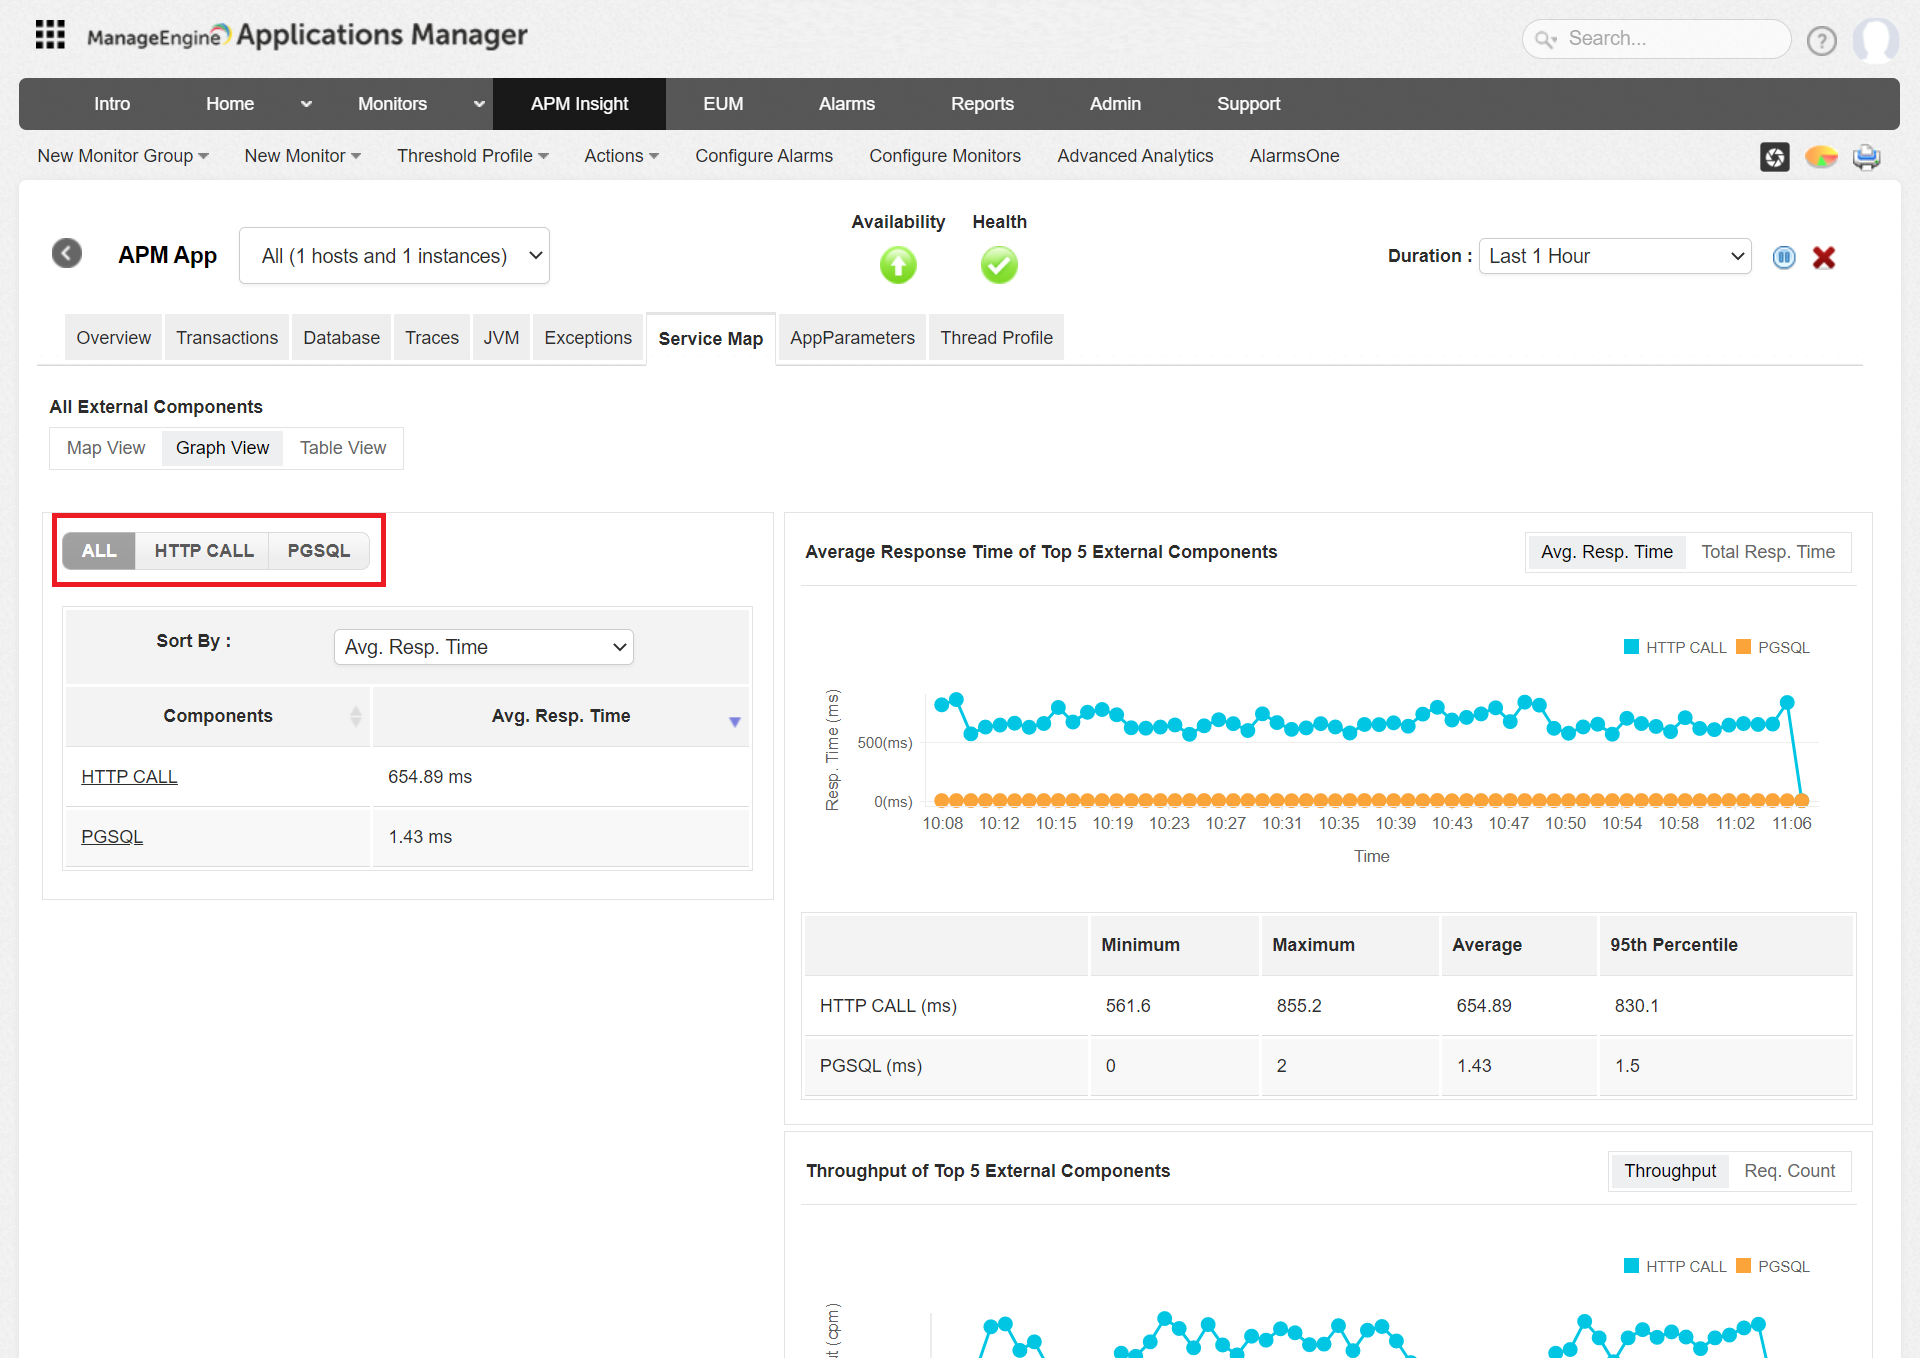
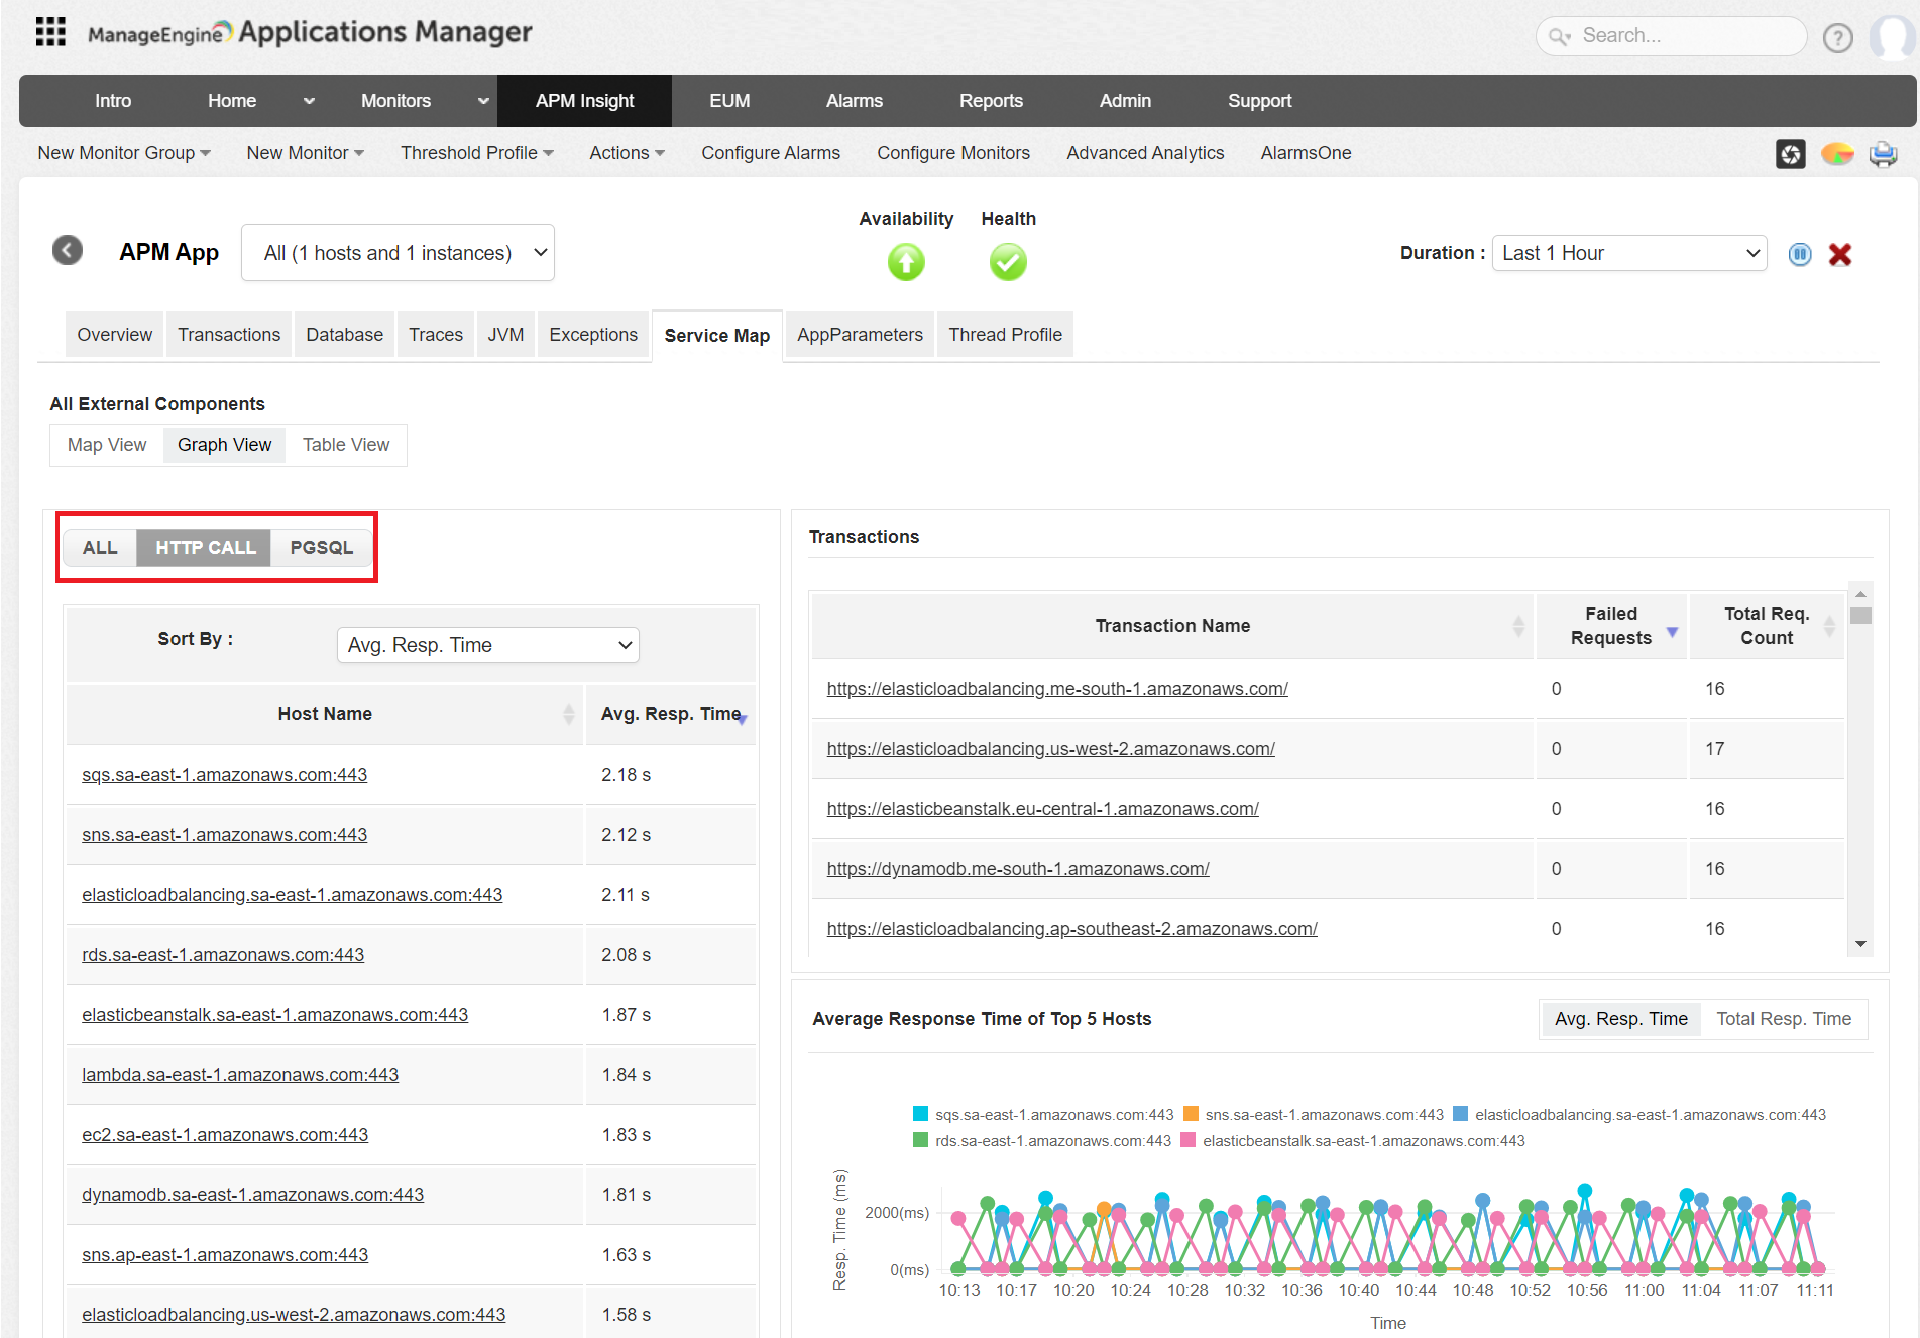
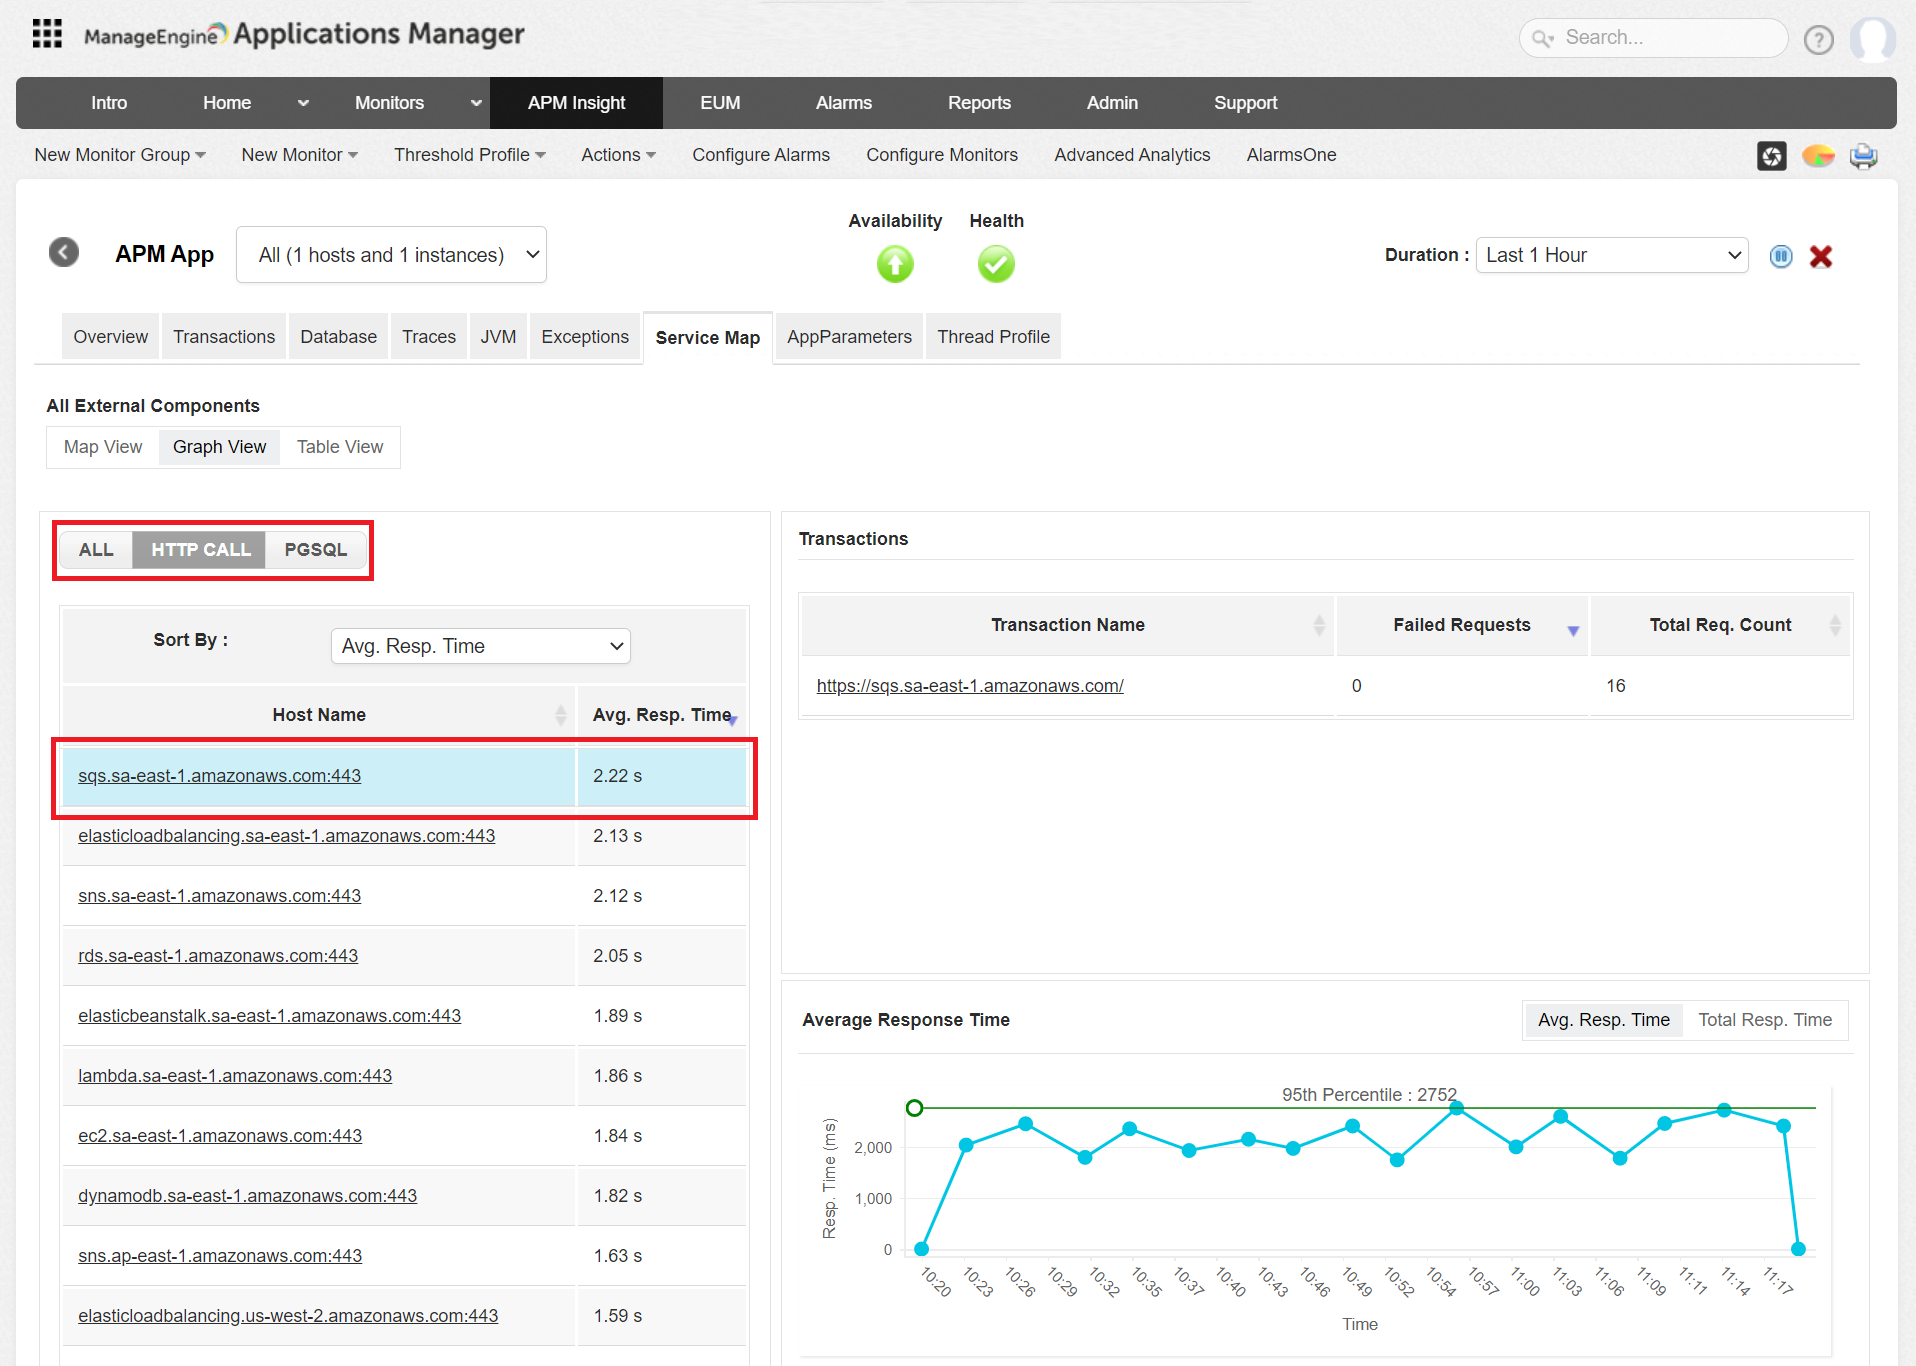
The graph view lists out parameters like average response time,total response time, throughput, total request count, error count and error rate. These metrics can be viewed for all components, for all hosts corresponding to individual components and for individual hosts.
- Graph view showing all metrics for all components
- Graph view showing all metrics of all hosts for a particular component.
- Graph view showing all metrics of a particular host for a particular component.
Tabular View
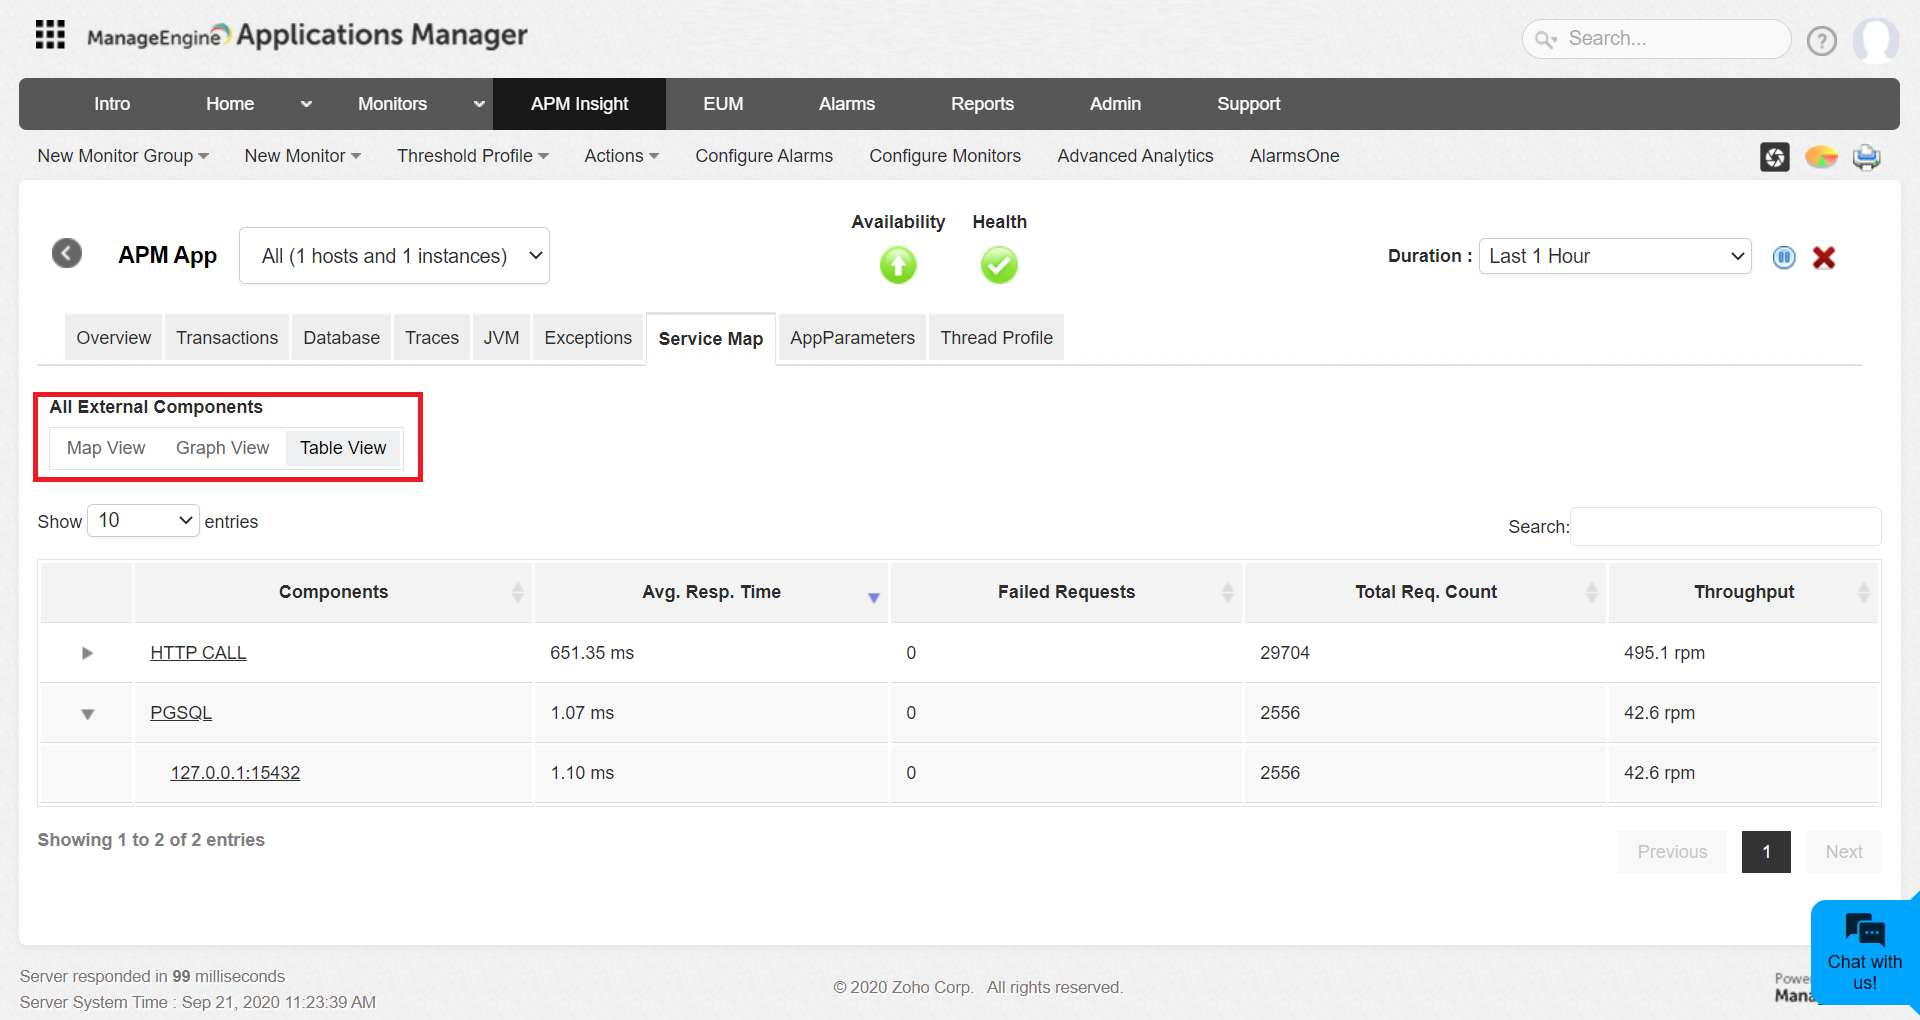
The Tabular view lists down all components along with their respective hosts. Clicking on individual component or host takes you to the corresponding graph view.
Thank you for your feedback!


