Chrome Recorder for Real Browser Monitoring (RBM)
- What is a Chrome Recorder for RBM?
- Adding the extension to your browser
- Enabling Incognito mode
- Logging into the extension
- Creating a new monitor
- Working with the recorder extension
What is a Chrome Recorder for RBM?
It is a browser extension that will allow you to record your actions on a website or a web application and monitor them using Real Browser Monitor. The extension is supported for the Google Chrome browser.
Minimum Requirements:
- Google Chrome Browser v74 and above
- Applications Manager v14870 and above
Adding the extension to your browser
- Go to the link and click on Add to Chrome, this will add the extension to your Chrome browser. Alternatively, you can go to Chrome Web Store and search for "Applications Manager Web Transaction Recorder" and click on "Add to Chrome".
- You can verify that the extension is installed by going to the Extension Management page using chrome://extensions/ link or by navigating to Settings → Extensions.
Enabling Incognito mode
Enable incognito mode to ensure that your transaction recordings are not impacted by cookies from previous sessions or other cached data. To enable the mode, follow the steps given below:
- Click on the Extensions icon (
 ) on the Menu bar.
 - Click on the kebab menu icon (
 ) next to Applications Manager Web Transaction Recorder.
 - In the pop-up that opens, select the Manage extension option.
- In the new Extensions page that opens, enable the toggle button next to Allow in incognito.
Logging into the extension
- At the top right corner, click Extensions ().
- Click on Applications Manager Web Transaction Recorder.
- A new window prompting you to log in will open up. Enter the Application Manager's hostname, port, and the admin user's API key in the login window.
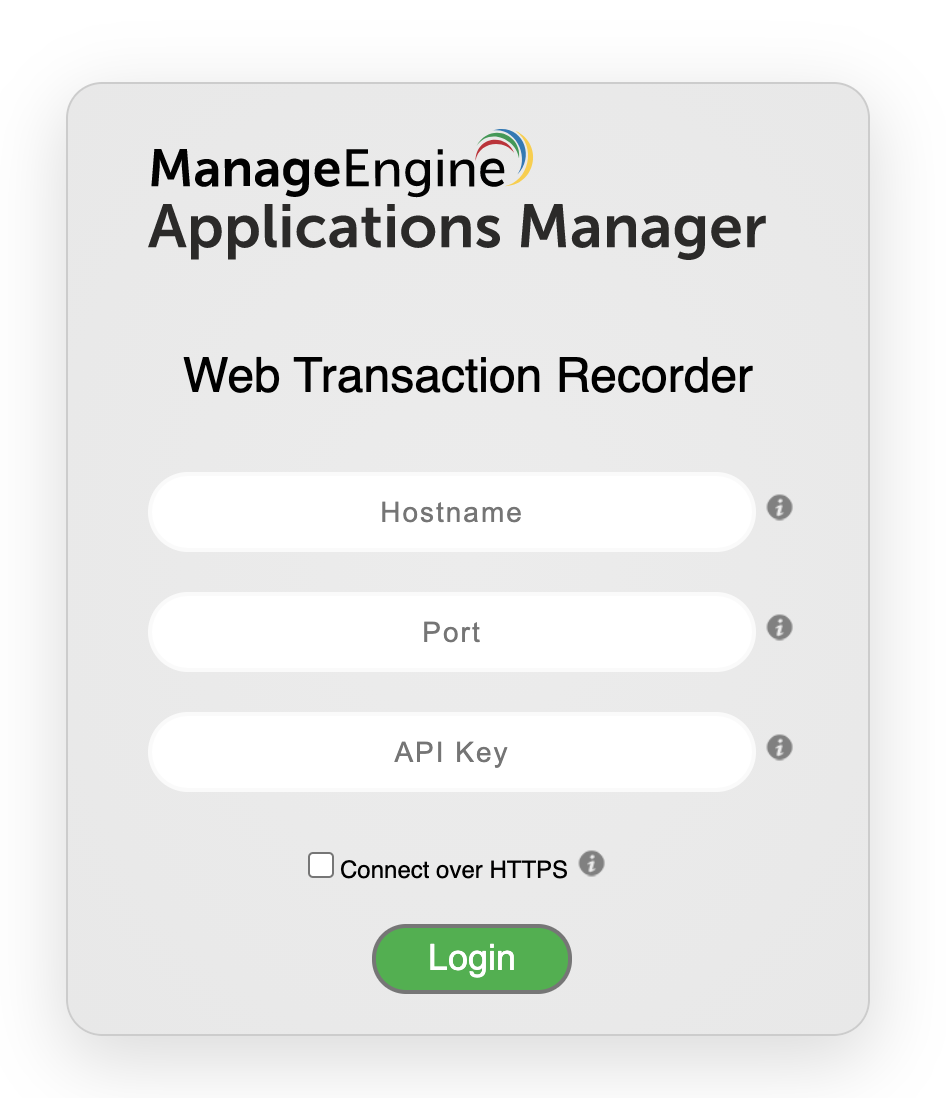
- Only admins and delegated admins are allowed to create a monitor through this extension. Hence, logging in with any other user's API key will not be successful.
- On entering the hostname and port, an option to Fetch API Key will be shown above the login button, which will take you to Applications Manager to fetch the API key.
- Check the Connect over HTTPS option if you've entered the SSL port of your Application Manager's instance.
- After entering the details, click on Login.
Note: Monitors from the extension will get created in the Application Manager's instance that you use to log into the extension.
Creating a new monitor
- After successfully logging into the extension, you will see a pop-up asking "What would you like to do?". Choose any of the following actions that you want to perform:
- Record a new transaction: Allows you to create a new recording. If you are a first-time user, you can use this option. On choosing this option,
- You will be asked to enter the URL to start recording. This URL will be the "Base URL" of the transaction. You are expected to enter the full URL. For example, https://www.appmanager.com/
- Click Start Recording to begin the recording, and this will launch a new browser window. Perform the transaction in this window. When you're done, close this window.
- After closing the window, click on the (
 ) icon on the top right to stop the recording. You will now see all the steps recorded in the window.
 - From here, you can click on Playback and Save to continue with the monitor creation process.
- Open a recorded transaction: Allows you to open a recorded transaction if you have used this extension earlier to create a recording and have saved it locally. You will be prompted to choose the existing recording from your local storage. On choosing this option,
- You will be prompted to choose the recording from your files. Choose the recording you want to load.
- The steps in the selected recording will show up in the recording window.
- From here, you can click on Playback and Save to continue with the monitor creation process.
- Import a Selenium Script: Allows you to import an existing selenium script. On choosing this option,
- You will be prompted to choose the Selenium script from your files. Choose the script you want to load.
- The steps in the selected script will show up in the recording window.
- From here, you can click on Playback and Save to continue with the monitor creation process.
- Record a new transaction: Allows you to create a new recording. If you are a first-time user, you can use this option. On choosing this option,
- Clicking on Next takes you to the Preferences page. If you want to configure settings for a test playback, you can do so here. However, test playback is not mandatory to create a monitor, so you can click on Next to proceed to skip test playback and proceed with monitor creation directly. Jump to how to create a monitor.
- Performing test playback: To perform test playback, follow the steps given below.
- In the Preferences page, configure the following details:
- Page Load Timeout: This is the maximum amount of time in seconds it should take to load a webpage completely.
- Delay Between Requests (Think Time): It is the time to wait before initiating the next step in the transaction while running the test. This is useful if your page needs extra time to get all components to load correctly.
- Select Browser For Test Playback: The selected browser will be used for test playback.
- Select Agent for Test Playback: Select the agent in which the Test playback should be performed.
- Block Domains: Domains that have to be blocked while loading the Web Page. Provide a comma-separated value. For example, sampledomain.com, testdomain.in
- Accept Untrusted Certificate: Enabling this option will ignore any certificate error while doing playback in the browser.
- After configuring these details, click on Do Test Playback. This will start the test playback in the selected agent.
- Upon completion of playback, you will be shown the playback status (Success/Failure). A successful playback means that all the configurations are correct. A failed playback means that some configuration needs to be modified. You can determine that based on the error message displayed. For example, if the playback failure error message says page load timeout, then you need to increase the page load timeout value in the preferences.
- After the completion of playback, click on Next to create the monitor.
- In the Preferences page, configure the following details:
- Creating the monitor: Clicking on Next will open the Save Real Browser Monitorpage, where you can configure the settings for the monitor and its playback. All values will be pre-selected for you. However, you can modify the following:
- Monitor Name: The name with which the monitor should be created in Applications Manager.
- Poll Interval: Frequency with which the monitor should do data collection. The default value is 10 mins.
- Select Browser For Monitoring: The selected browser will be used for playback while doing data collection.
- Select Agent: Select agent(s) in which the data collection should be performed.
- Associate with Monitor Group: Select the monitor group with which the monitor should be associated.
- Show Screenshots: Enabling this option will show screenshots taken during the data collection playback. If your transaction contains sensitive data that you do not want to screenshot, then uncheck this option.
- Show Performance Metrics: Enabling this option will show network performance metrics collected during data collection, like the waterfall graph, resource type graph, etc.
- Click on Save Monitor to create the monitor in Applications Manager.
Working with the recorder extension
Refer to this help page to learn how to work with the Recorder Extension.
