Gain complete visibility into IIS performance and availability
With Applications Manager, get comprehensive insights into IIS server performance metrics and availability. Track IIS KPIs and ensure smooth operation of all hosted websites. Monitor IIS with or without an agent, using WMI, WinRM, or the FSO Agent running on the Windows host.
Monitor IIS with the FSO Agent and skip the credential setup
Apart from agentless monitoring using WMI and WinRM, Applications Manager can now monitor IIS servers using the FSO Agent running on the Windows host. Once the agent discovers IIS on the host, the IIS monitor is added automatically, and there is no need to configure credentials.
Already monitoring an IIS server in agentless mode? You can switch an existing monitor between Agent and Agentless mode at any time after installing the FSO Agent.
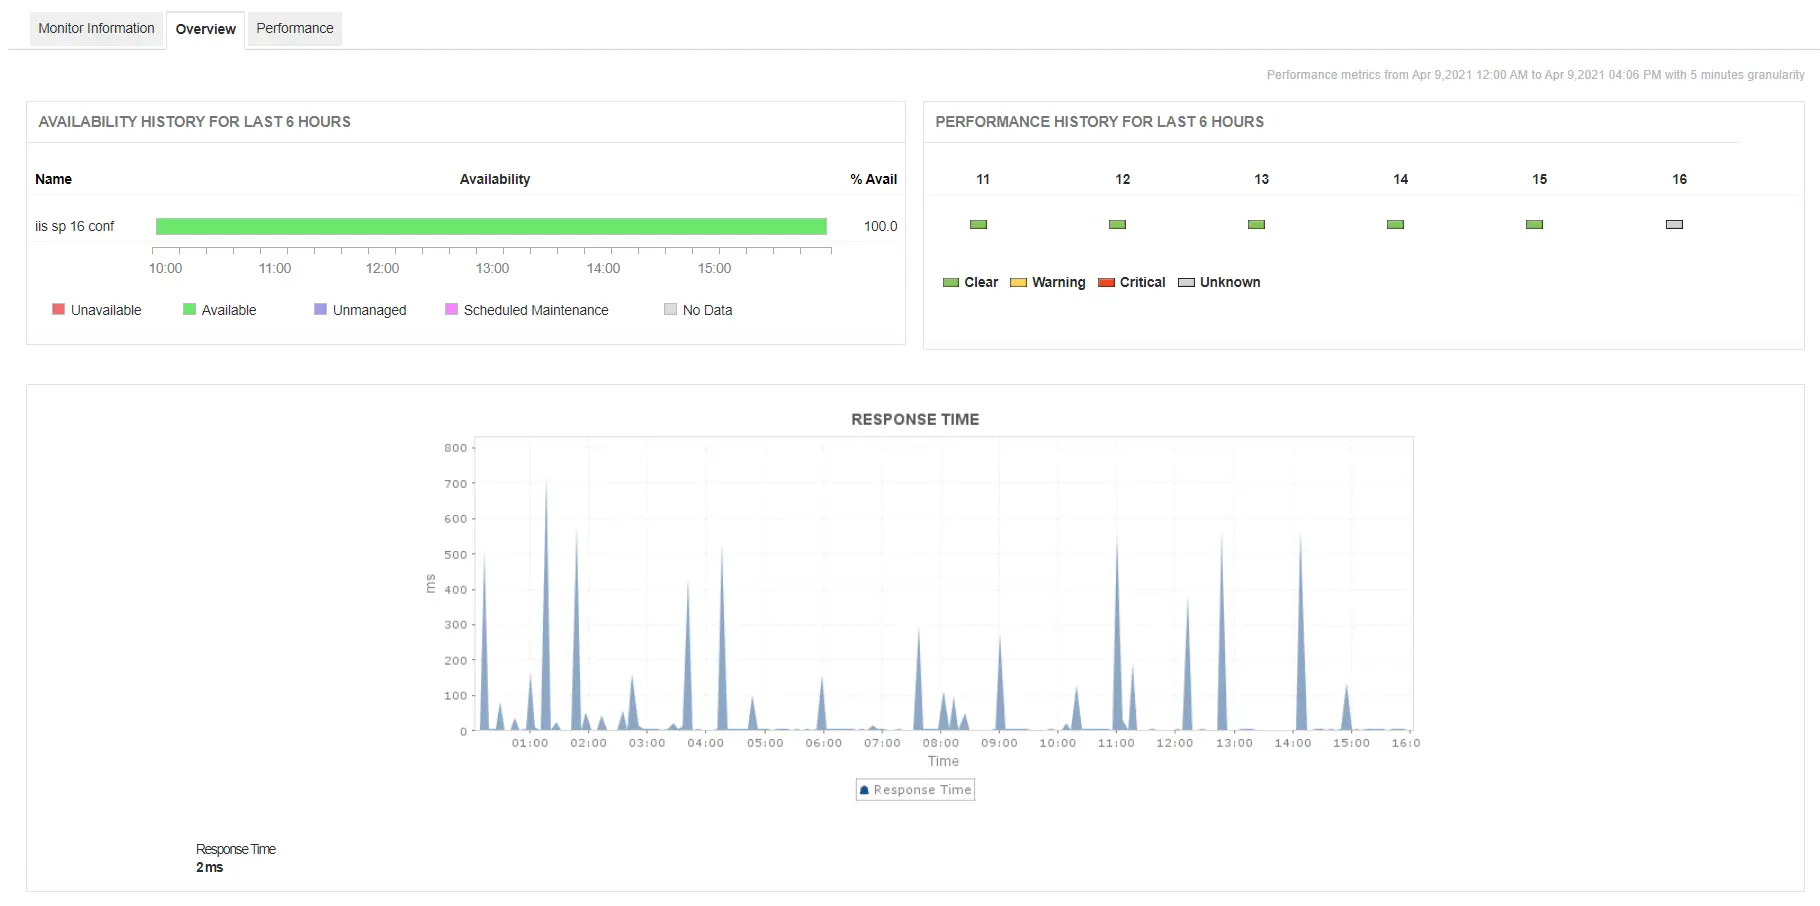
Track IIS response time in real time to detect slowdowns early
With Applications Manager's IIS monitoring software, become aware of the response time of the IIS server and get notified when its value crosses beyond a specified threshold. A constant increase in response time might indicate a problem with the web server, host, or website resources.
Monitor IIS application pool health to prevent process failures
Application pools consist of worker processes. A worker process depicts work being done for a website, web application, or web service. IIS performance monitoring tools like Applications Manager are capable of tracking crucial application pool metrics such as CPU Usage, Memory Usage, No. of Worker Processes, and Queue length.
An increase in CPU usage may indicate high traffic or unwanted garbage collection. The No. of Worker Processes attribute indicates the load that an application pool is handling. With Applications Manager's IIS application pool monitoring capabilities, you can detect worker process crashes and memory leaks before they disrupt service.
Applications Manager also tracks the .NET CLR behavior of your application pools. Keep an eye on GC Time % and the total, Gen 0, Gen 1, Gen 2, and Large Object Heap sizes to spot memory pressure and excessive garbage collection. Watch Exceptions/sec to catch rising application errors, and track physical, logical, and queued threads to identify thread contention. Worker process details such as private memory, private bytes, IO operations per second, and thread count give you a closer look at what each pool consumes.

Analyze website performance metrics to ensure seamless user experience
Applications Manager's acts as an effective IIS monitoring tool that gives in-depth insights about the websites hosted on the web server. It tracks numerous crucial metrics that give you an idea about how well your hosted website is performing.
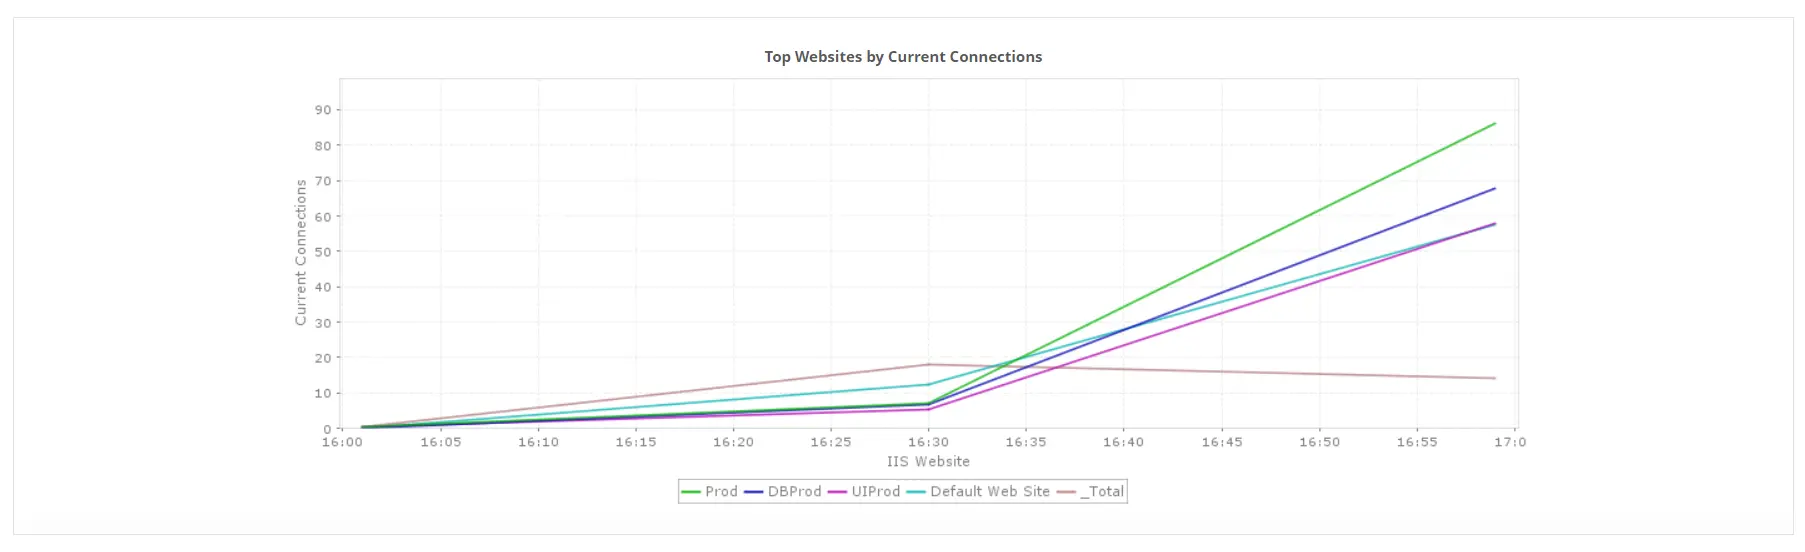
- Get to know the current and maximum connections established in your IIS server. This can give you an idea of how loaded your server is.
- Keep track of the bindings configured for each website.
- Become aware of bytes sent, received, and transferred on your website every second to get to know how much traffic your website is handling. Details about files sent, received, and transferred on your website are also available at your disposal.
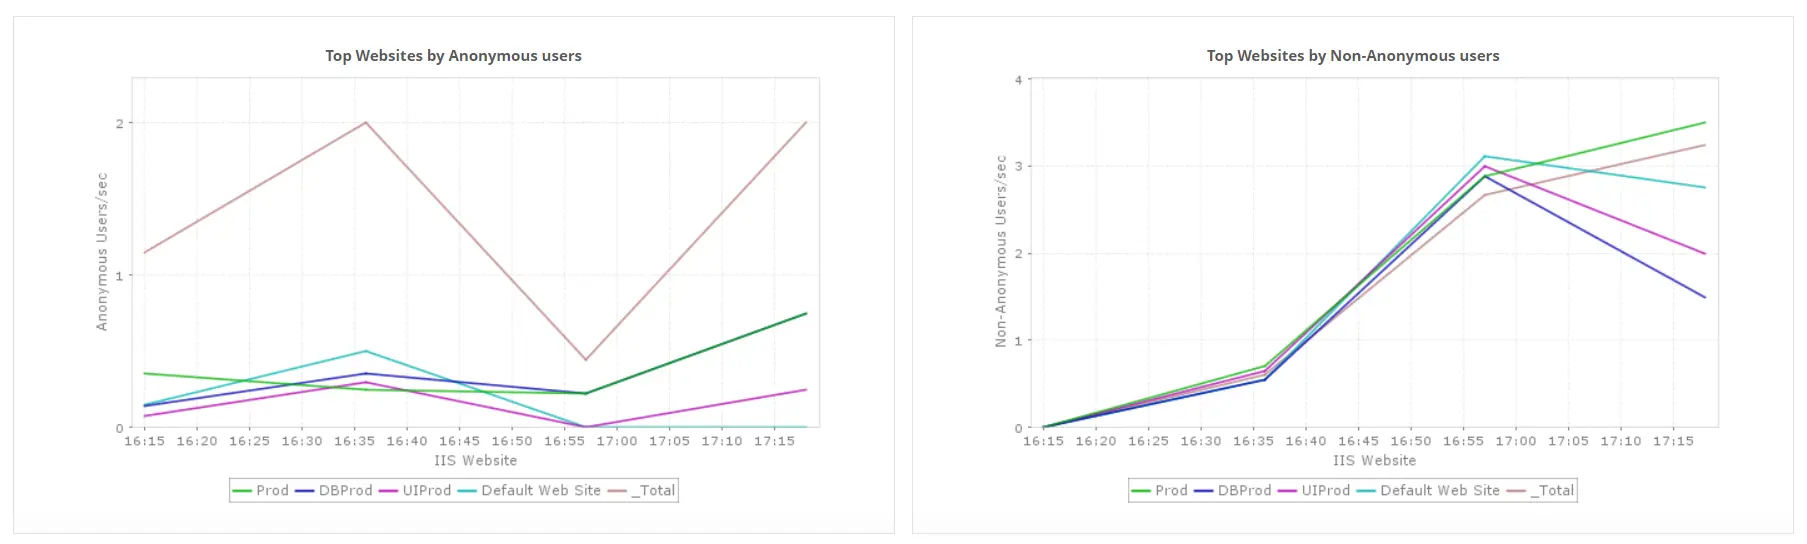
- Analyze the number of anonymous and non-anonymous users connected to the website.
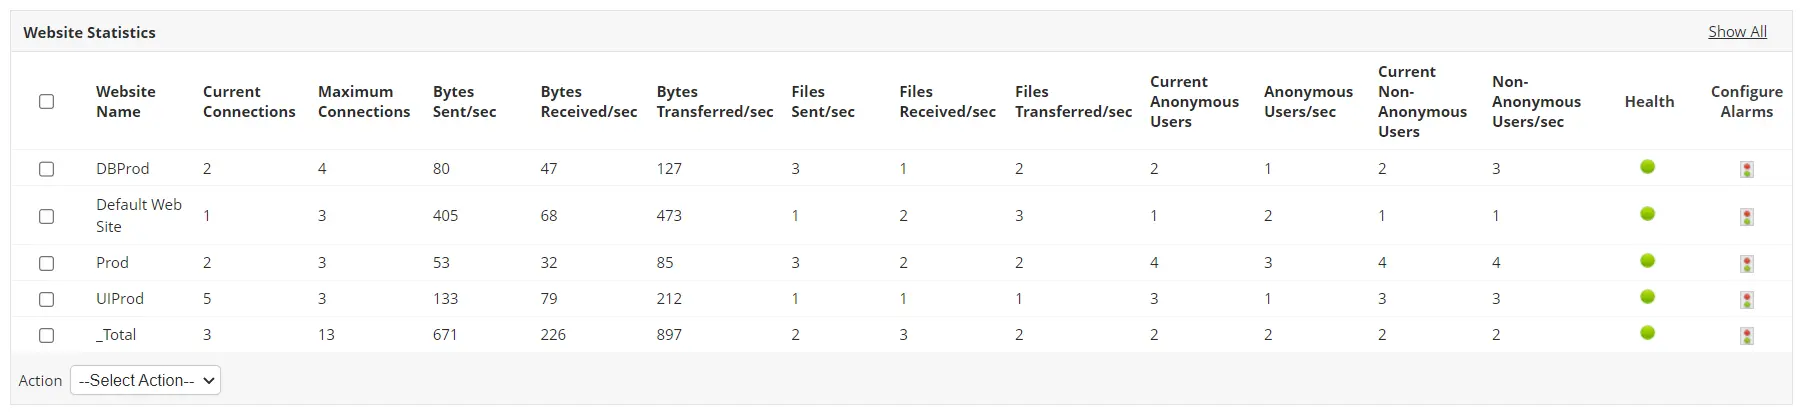
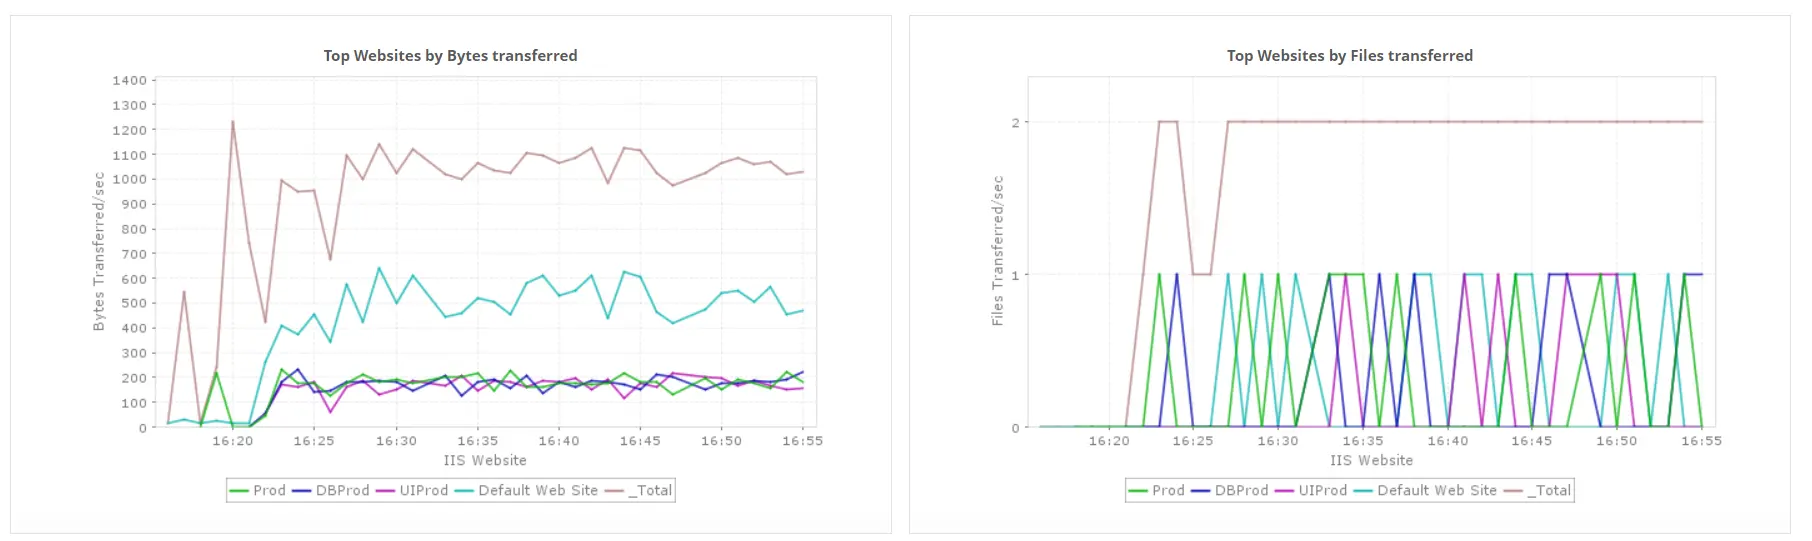
Applications Manager's IIS monitor also lets you classify and compare the performance of the hosted websites against crucial metrics. This gives you insights into the top-performing websites at a single glance.
Track ASP.NET request health and cache efficiency to catch bottlenecks early
Applications Manager also gives you server-level insights into how IIS handles ASP.NET requests and how effectively it uses its caches.
- Measure Request Execution Time and Request Wait Time to see how long requests take to run and how long they wait in the queue.
- Track Requests Current, Requests Queued, and Requests Rejected to detect when the server is struggling to keep up with incoming traffic.
- Monitor File Cache Memory Usage and the File, Metadata and URI cache hit percentages to understand how well IIS serves content from its caches.
A steady rise in queued or rejected requests, or a falling cache hit rate, can be an early sign of a performance bottleneck.
Drill down into individual applications to pinpoint failures faster
The IIS Applications view shows how each application running on your IIS server is performing, along with the website and application pool it belongs to.
- Track Requests/sec, Concurrent Requests, Queued Requests, and Total Requests to understand the load on each application.
- Identify failing applications using Total Failed Requests and the HTTP 401, 404, 500, and 503 request counts.
- Monitor Active Sessions, SQL and State connections, and cache metrics such as API Hit Ratio, Output Hits Ratio, and Turnover Rate for deeper insight into session and cache behavior.
Complete application-level metrics are collected with agent-based monitoring.
Receive proactive IIS alerts before issues impact users
Monitoring IIS performance with Applications Manager provides options to configure alerts for crucial metrics and notifies you of unavailability of the server, change in health status of application pools, etc. You can choose to receive IIS downtime alerts instantly through the medium of your choice. Some supported mediums include SMS, Email, Slack, etc. This facilitates faster identification of problems and resolves them before the end users get affected.
Use detailed reports to plan capacity and prevent performance dips
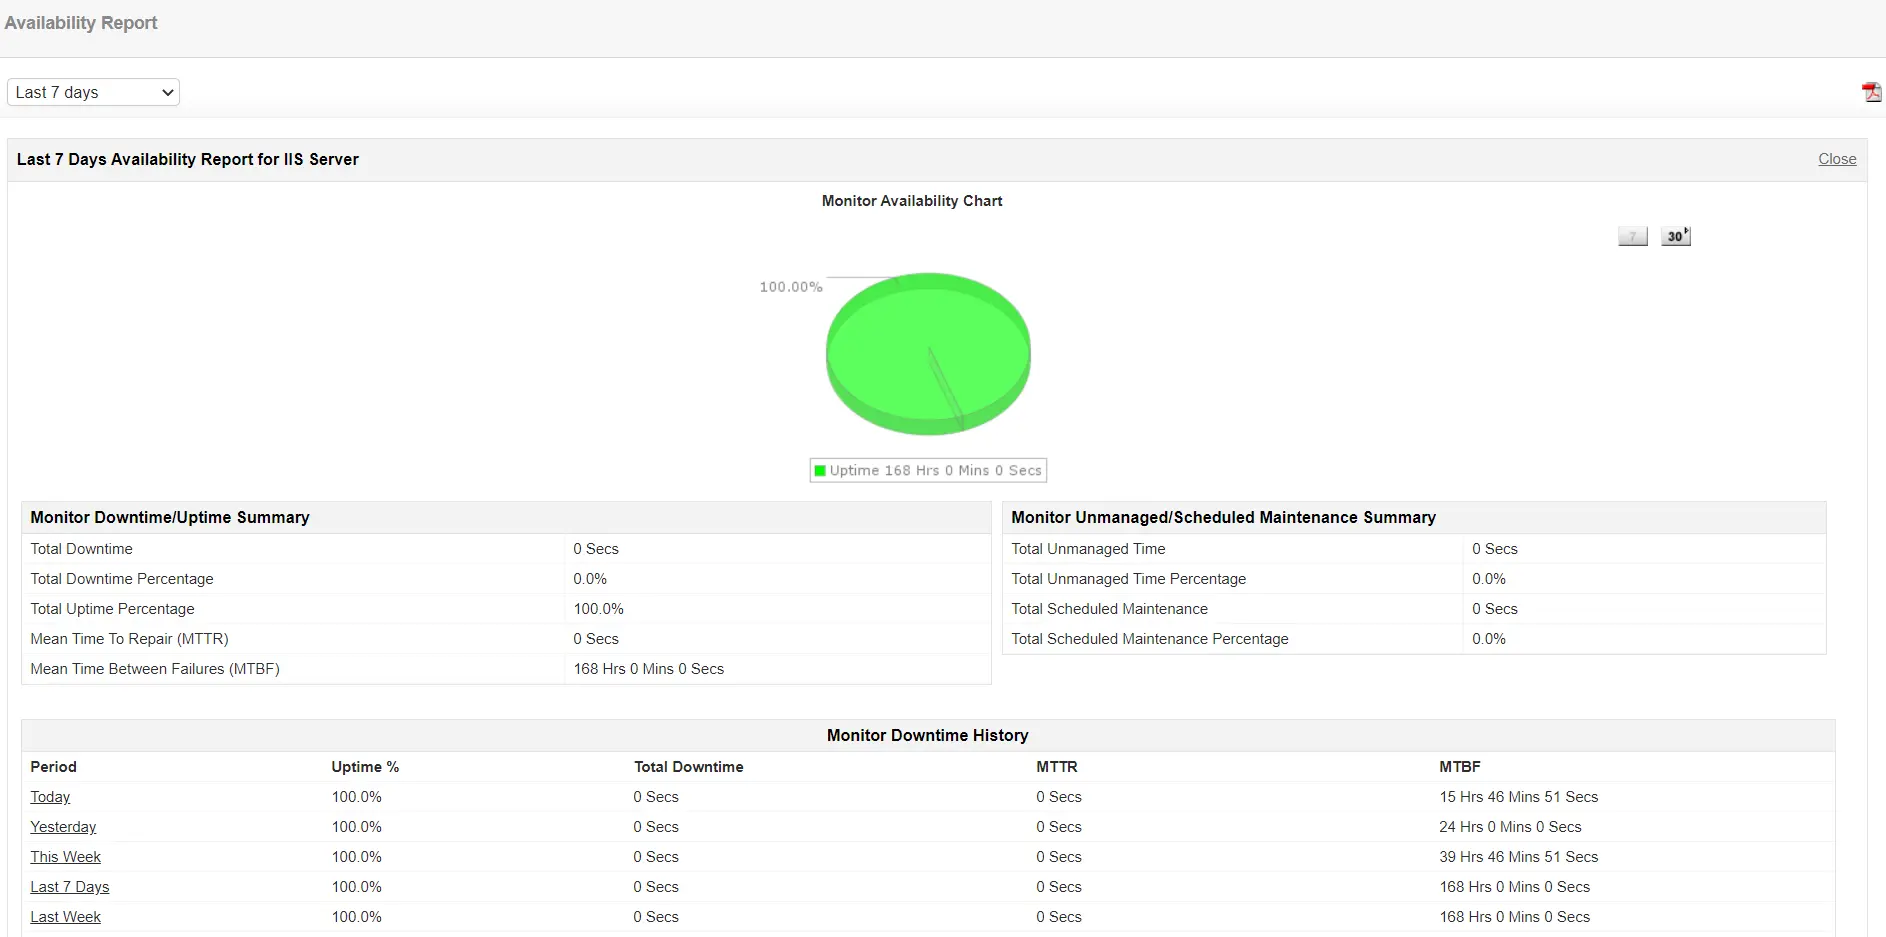
IIS monitoring tools like Applications Manager lets you generate reports for various attributes such as availability, response time, etc. You can use the reports to analyze the trends of your server's performance over a selected period, thereby helping you to plan server capacity with ease. These IIS performance reports can be exported as a PDF/Excel file and can even be sent to your email for record-keeping purposes.
Use cases: How IIS monitoring helps solve real-world challenges
Discover how Applications Manager helps IT teams troubleshoot, optimize, and secure IIS environments with real-world examples.
| Use case | Challenge | Solution | Outcome |
|---|---|---|---|
| Rapid site & app-pool failure detection | High-traffic websites face unexpected downtime or app-pool crashes. | Monitor website availability and application-pool health in real time to detect issues instantly. | Reduced unplanned outages and improved uptime. |
| Performance bottleneck identification during peak load | Slow response times and queued requests during heavy traffic periods. | Track key metrics such as requests/sec, queued and rejected requests, request execution time, and worker process CPU/memory usage. | Proactive tuning and smoother performance during load peaks. |
| SSL certificate expiry & security compliance | Expired SSL certificates cause trust warnings or temporary outages. | Set alerts for SSL certificate validity and automate renewal reminders. | Continuous security compliance and zero certificate-related downtime. |
| Capacity planning & trend analysis | Teams lack insight into long-term IIS workload trends for scaling decisions. | Analyze trends in active connections, bytes sent/received, and app-pool utilization. | Optimized infrastructure costs and smarter capacity planning. |
| Multi-site and multi-pool visibility | Enterprises with multiple IIS sites struggle to view overall performance at a glance. | Use unified dashboards for per-site and per-pool performance metrics. | Faster troubleshooting and complete visibility across all IIS environments. |
| Error tracking & log analysis | HTTP 500 errors or timeouts go unnoticed until end users complain. | Monitor IIS logs and error rates, track per-application failed requests and 401, 404, 500, and 503 counts, and set alerts for spikes in 5xx errors or request timeouts. | Detect and resolve issues before they affect user experience. |
| Agent-based IIS monitoring | Setting up WMI or WinRM access and configuring credentials for every IIS host can be time-consuming. | Install the FSO Agent on the Windows host so that IIS is discovered and added as a monitor automatically, with no credentials to configure. | Faster onboarding and simpler IIS monitoring across hosts. |
Get started with IIS monitoring in minutes
With Applications Manager's IIS monitoring, you can efficiently ensure that your web server is performing at optimum levels without any hassle. You can quickly get started by downloading a full-fledged, free, 30 day trial now!