Amongst several open source application servers available in the market, Jetty is preferred mostly because of its faster loading time, smaller memory footprint, superior performance and higher data throughput. For the Jetty server to work seamlessly in a real-time environment, an IT admin has to monitor critical details, related to its health, performance and availability. Applications Manager proactively monitors all parameters related to Jetty Application Server environment and quickly detects any problems, to prevent any case of downtime.
Monitor critical performance indicators of Jetty App server
Allocate resources optimally, by measuring important parameters like CPU usage, JVM statistics regarding used/unused memory usage with our Jetty application server monitoring tool. Track performance of applications by monitoring the garbage collection efficiency, connection pool usage and session utilization details.

Determine any case of thread pool exhaustion
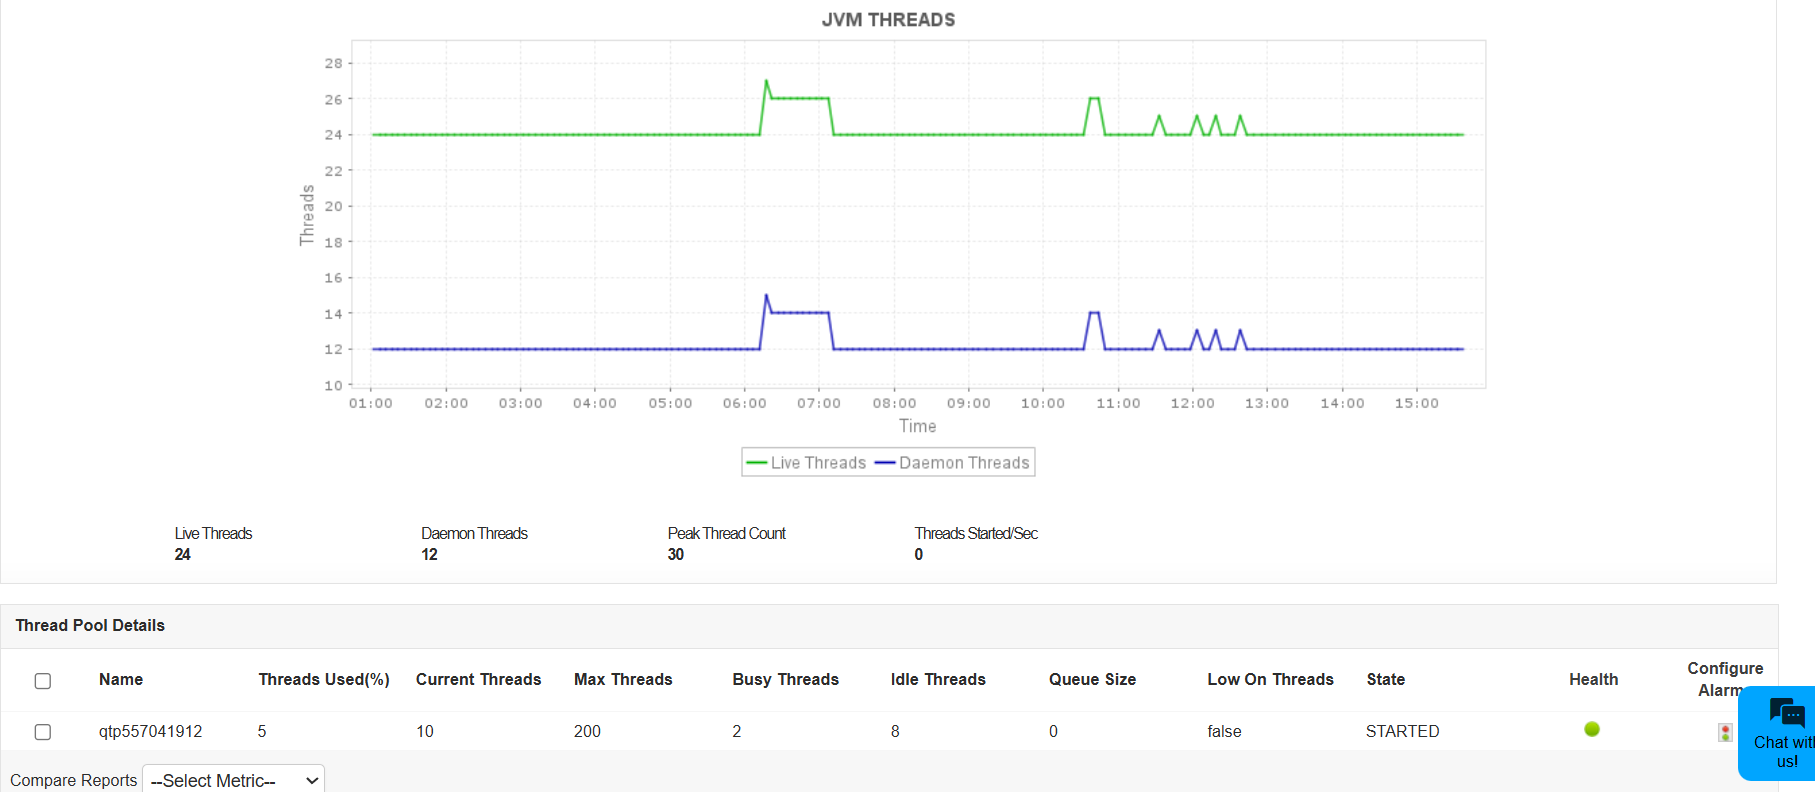
Use Applications Manager's Jetty server monitor to measure the number of active, idle or waiting threads to efficiently track thread pool utilization and detect any flaws in the code.

Avoid downtimes in production and deployment schedules
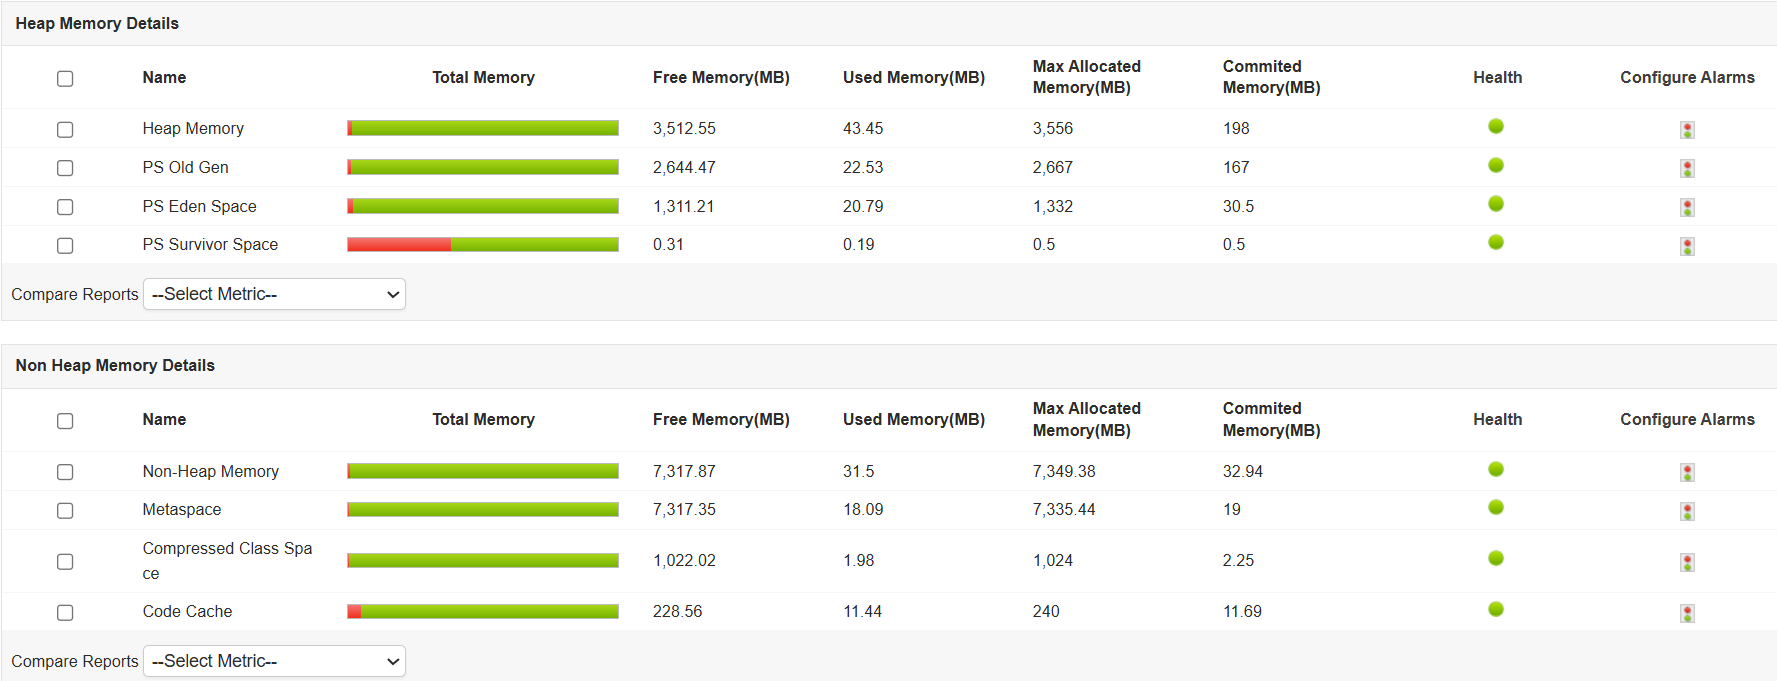
Manage memory resources efficiently by monitoring the heap/non heap memory usage, and troubleshoot out of memory exceptions, memory leaks inside the Jetty application server.

Make sure that your applications are up and running
Fine tune your Jetty application server's performance by identifying bottlenecks, if a process is running slow. Increase efficiency of the application, by measuring the number of active sessions, state of the application, etc.

Monitor end-user experience of applications deployed on Jetty Server
With Applications Manager's Jetty application server monitoring tool, you can also track end-user experience of web applications by measuring the Apdex (Application Performance Index). View database performance metrics, trace transaction flows, perform code level diagnostics and easily identify potential bottlenecks.

