Track a wide range of metrics, including CPU, memory, network, and disk utilization, to gain a comprehensive understanding of your Kubernetes environment.
Identify and address resource bottlenecks, such as CPU contention or memory shortages, to improve performance and reduce costs.
Analyze application and container performance to pinpoint issues, such as slow database queries or network latency, and optimize code for better efficiency.
Leverage AI-powered algorithms to detect Kubernetes issues early, reducing MTTI and MTTR. Get actionable alerts via Slack or ITSM tools, ensuring they reach the right team
Create personalized dashboards to visualize critical metrics and gain actionable insights into your Kubernetes environment. No need to integrate with external visualization tools like Grafana.
Store large volumes of monitoring data over extended periods of time without integrating with external tools like Thanos or Cortex.
Monitoring and efficiently allocating CPU, memory, and disk resources in Kubernetes environments is complex, especially when dealing with multiple containers and nodes.
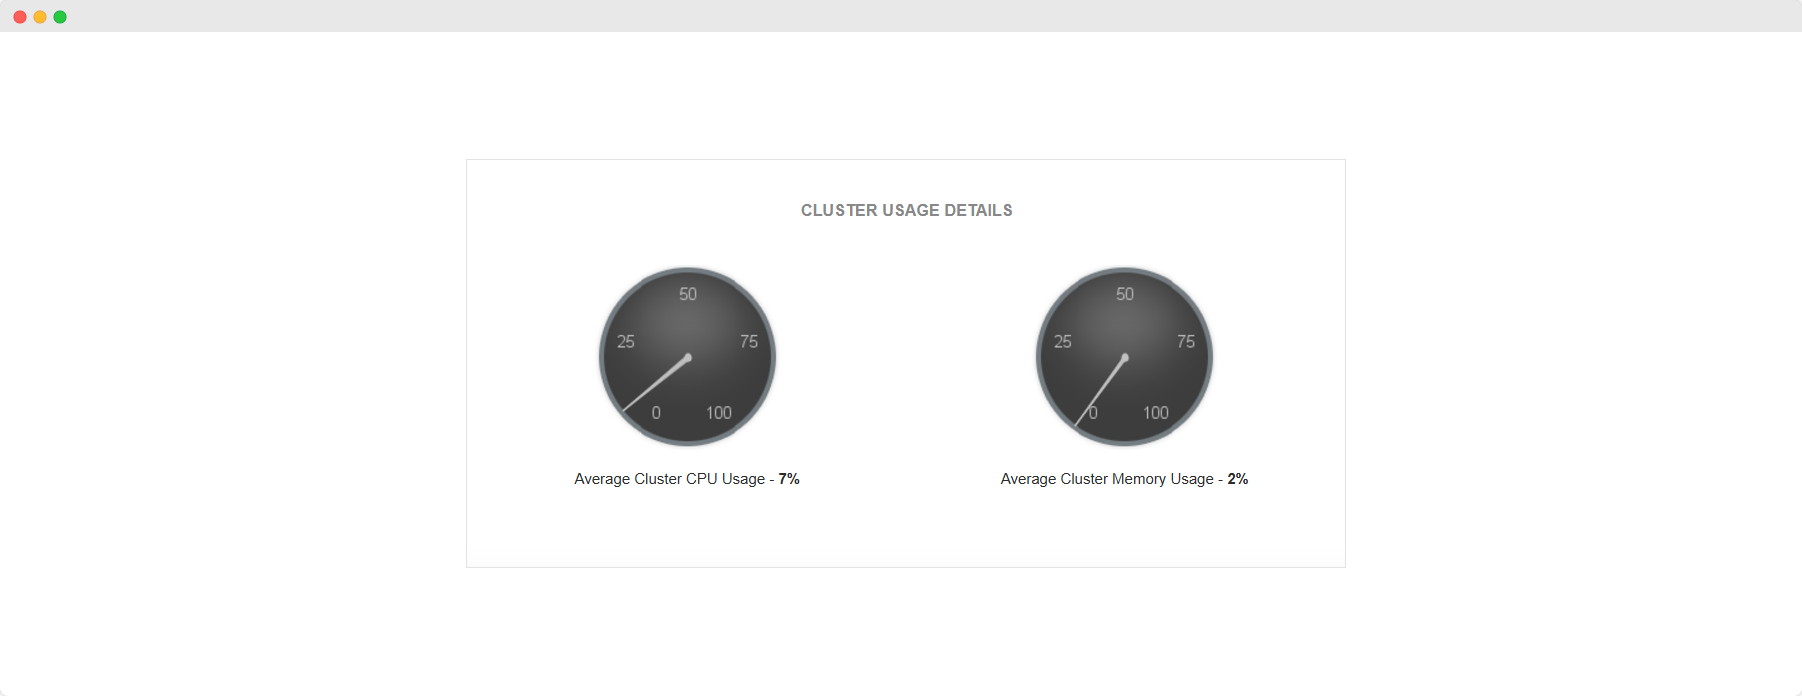
Applications Manager provides real-time metrics and insights into resource usage, enabling you to optimize resource allocation and prevent over- or under-utilization.
Ensuring smooth and consistent performance across numerous containers and microservices can lead to performance bottlenecks, especially as applications scale.
Applications Manager tracks performance metrics such as response time, throughput, and latency for each container, helping you to identify and resolve performance bottlenecks quickly.
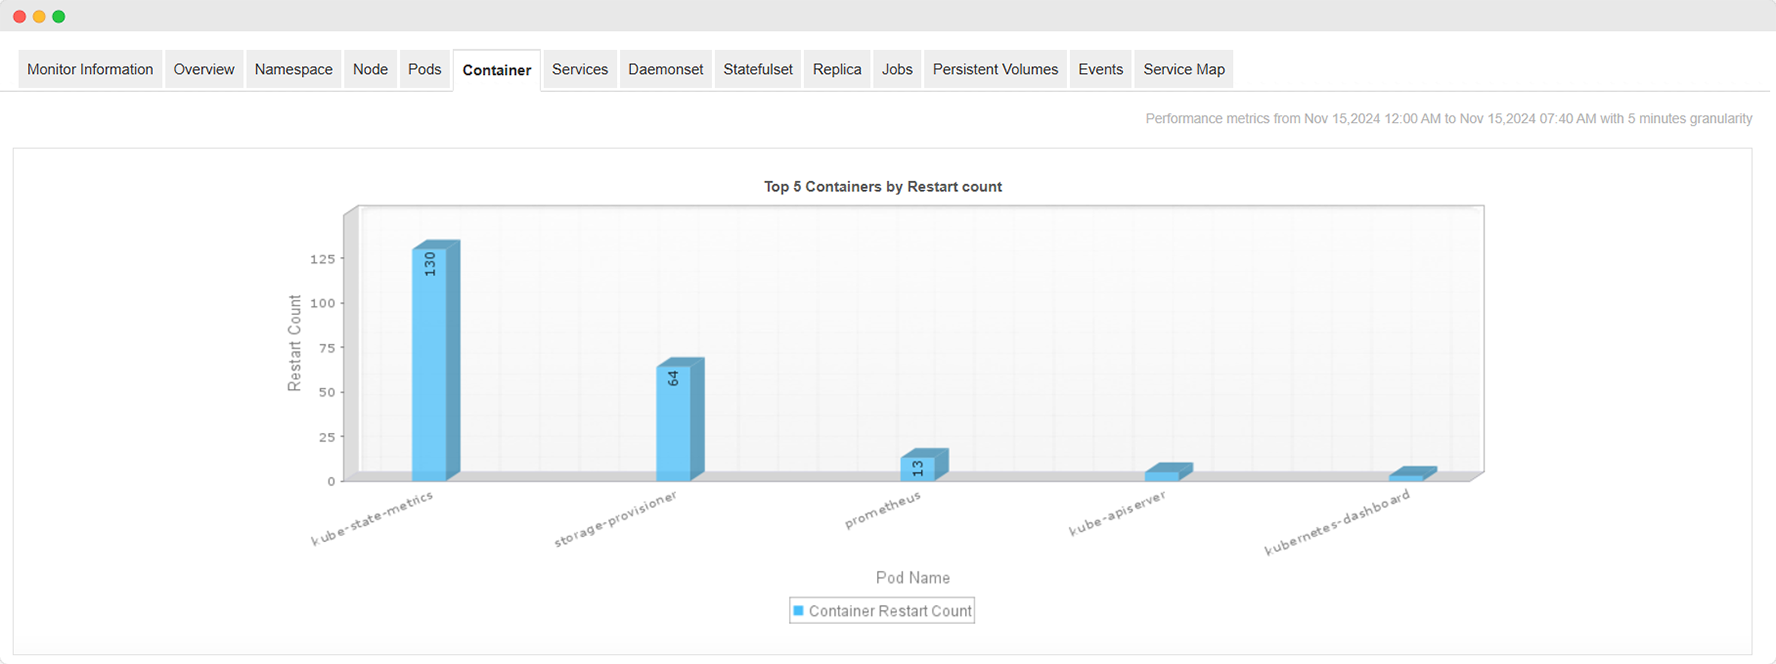
Managing the lifecycle of applications within containers—from deployment to scaling to termination—requires constant monitoring to ensure that applications are running smoothly and efficiently.
Applications Manager automates the monitoring of containers throughout their lifecycle, with alerts for issues like failed deployments, crashes, or resource constraints, allowing for proactive management.
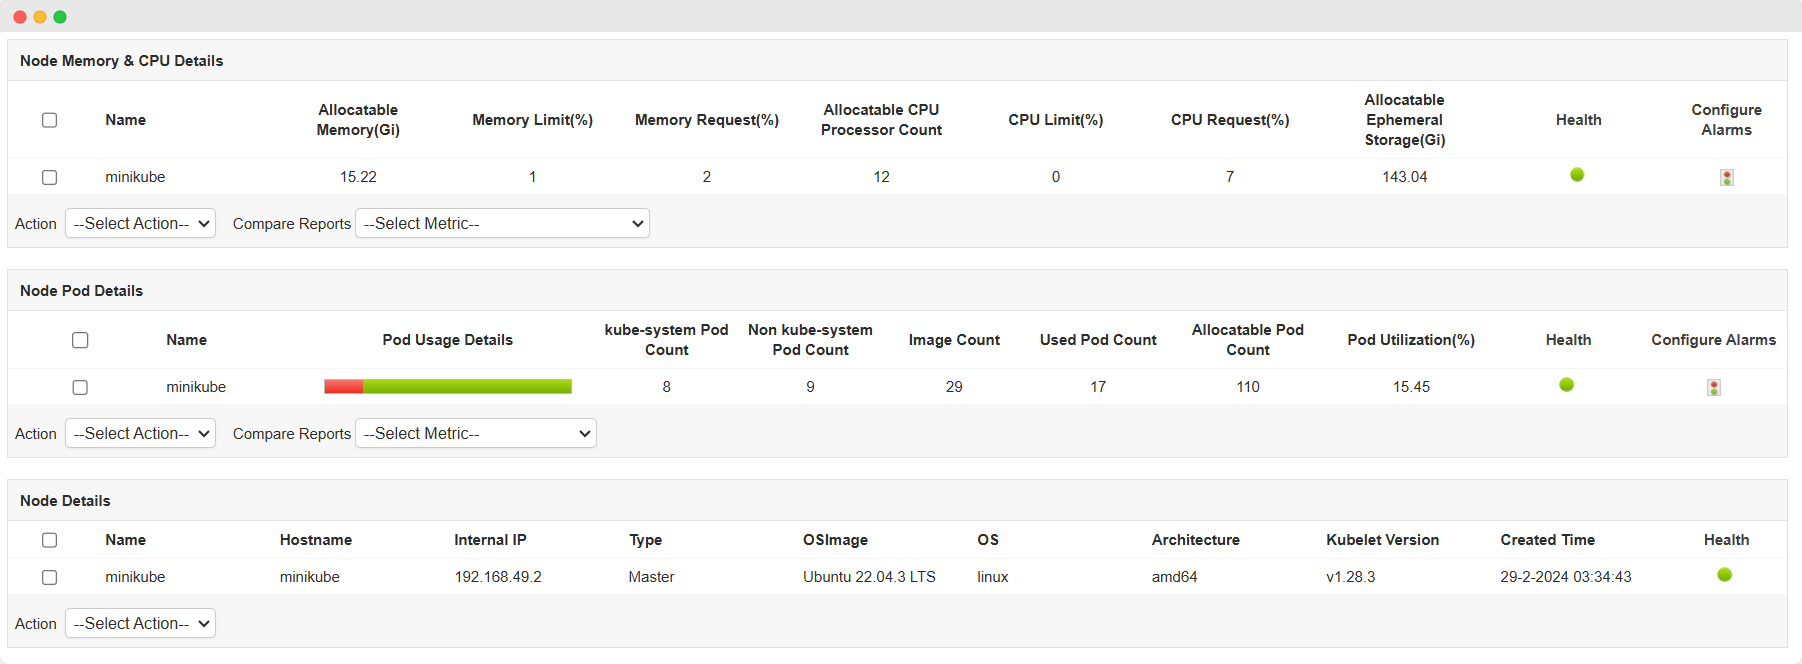
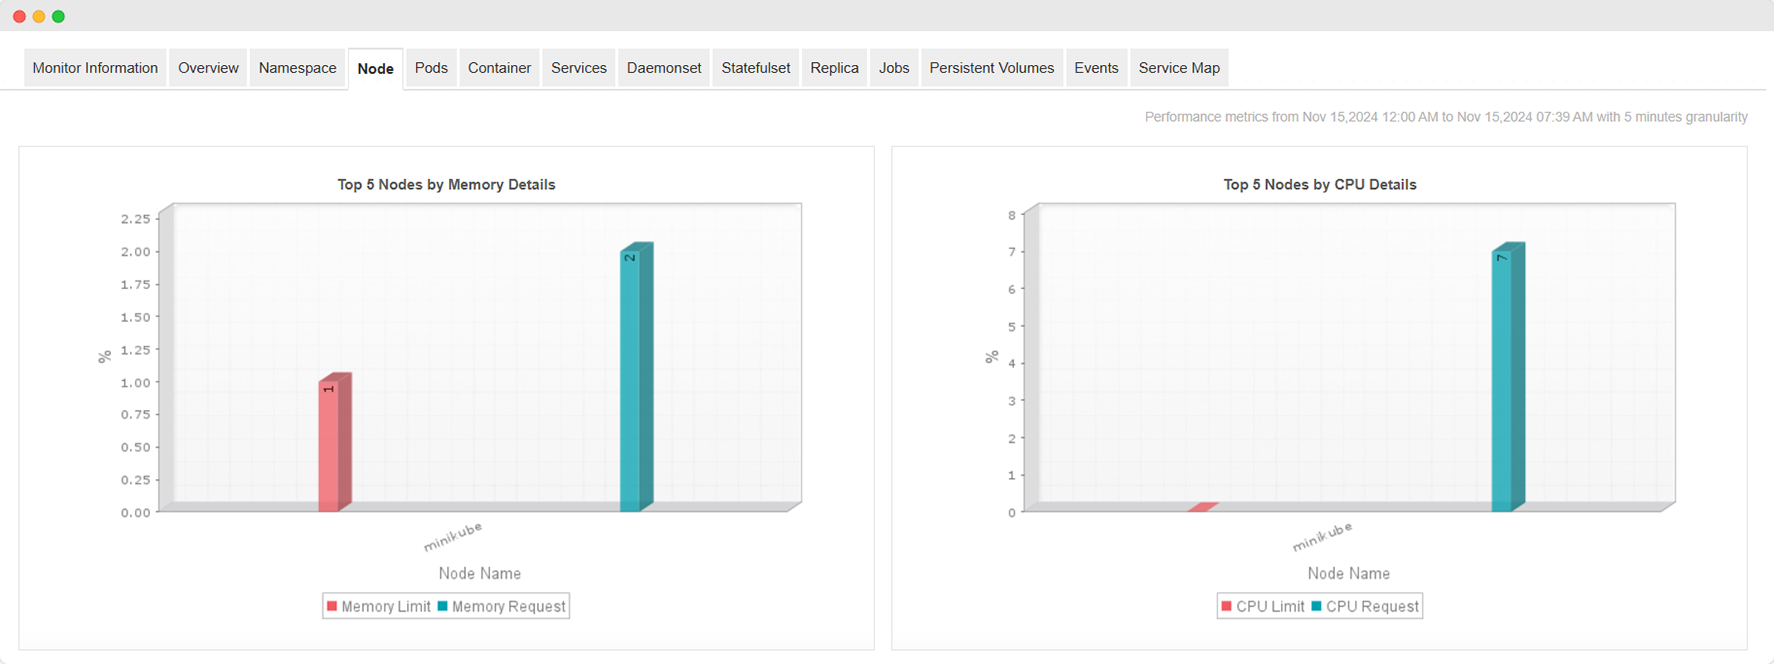
Kubernetes nodes can become overwhelmed with resource demands, leading to degraded application performance or even node failures. Monitoring and managing node resources is crucial to maintaining cluster stability.
Applications Manager provides real-time insights into node-level metrics like CPU, memory, and disk usage, enabling proactive resource management. This helps in identifying nodes that are under stress, allowing for timely interventions to prevent resource saturation and maintain optimal performance across the cluster.
As applications scale across more containers and nodes, maintaining consistent performance and availability becomes more challenging.
Applications Manager helps manage scalability by monitoring the performance and health of deployments as they scale, ensuring that the environment adapts efficiently to increased demand without sacrificing performance.

Proactively monitor resource usage and node scaling, identifying potential issues like resource shortages before they become critical.
Quickly find and fix issues within your production Kubernetes clusters, ensuring optimal performance and resource allocation.
Track the health and performance of Kubernetes services to ensure they are routing traffic effectively and remain highly available. Quickly identify and troubleshoot service-related issues to maintain seamless operations.
Keep an eye on the status and utilization of persistent volumes to prevent storage shortages and ensure data persistence across your Kubernetes pods.
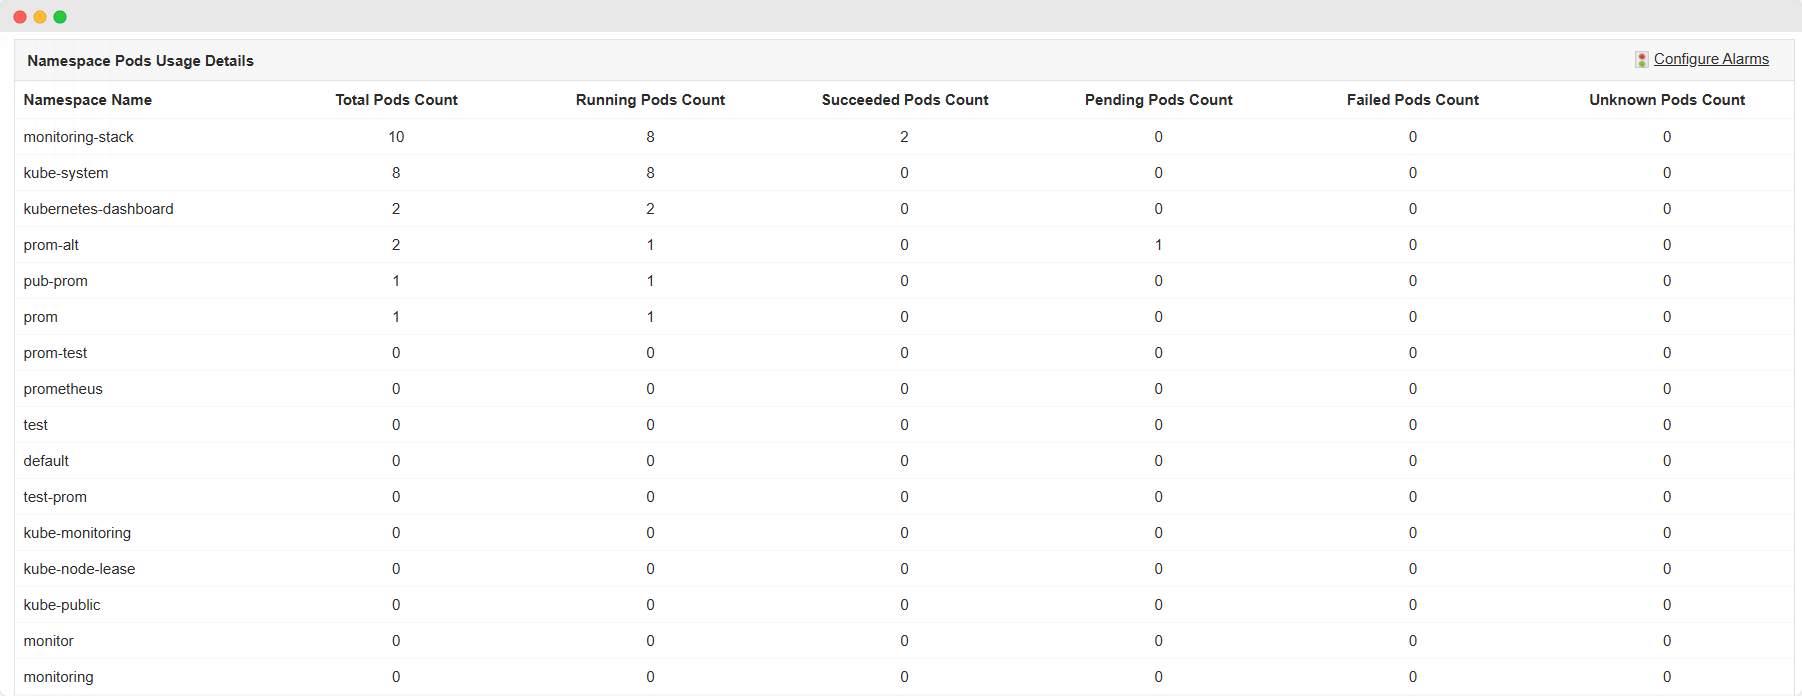
Gain insights into resource allocation and consumption within specific namespaces, and optimize resource distribution across different environments.
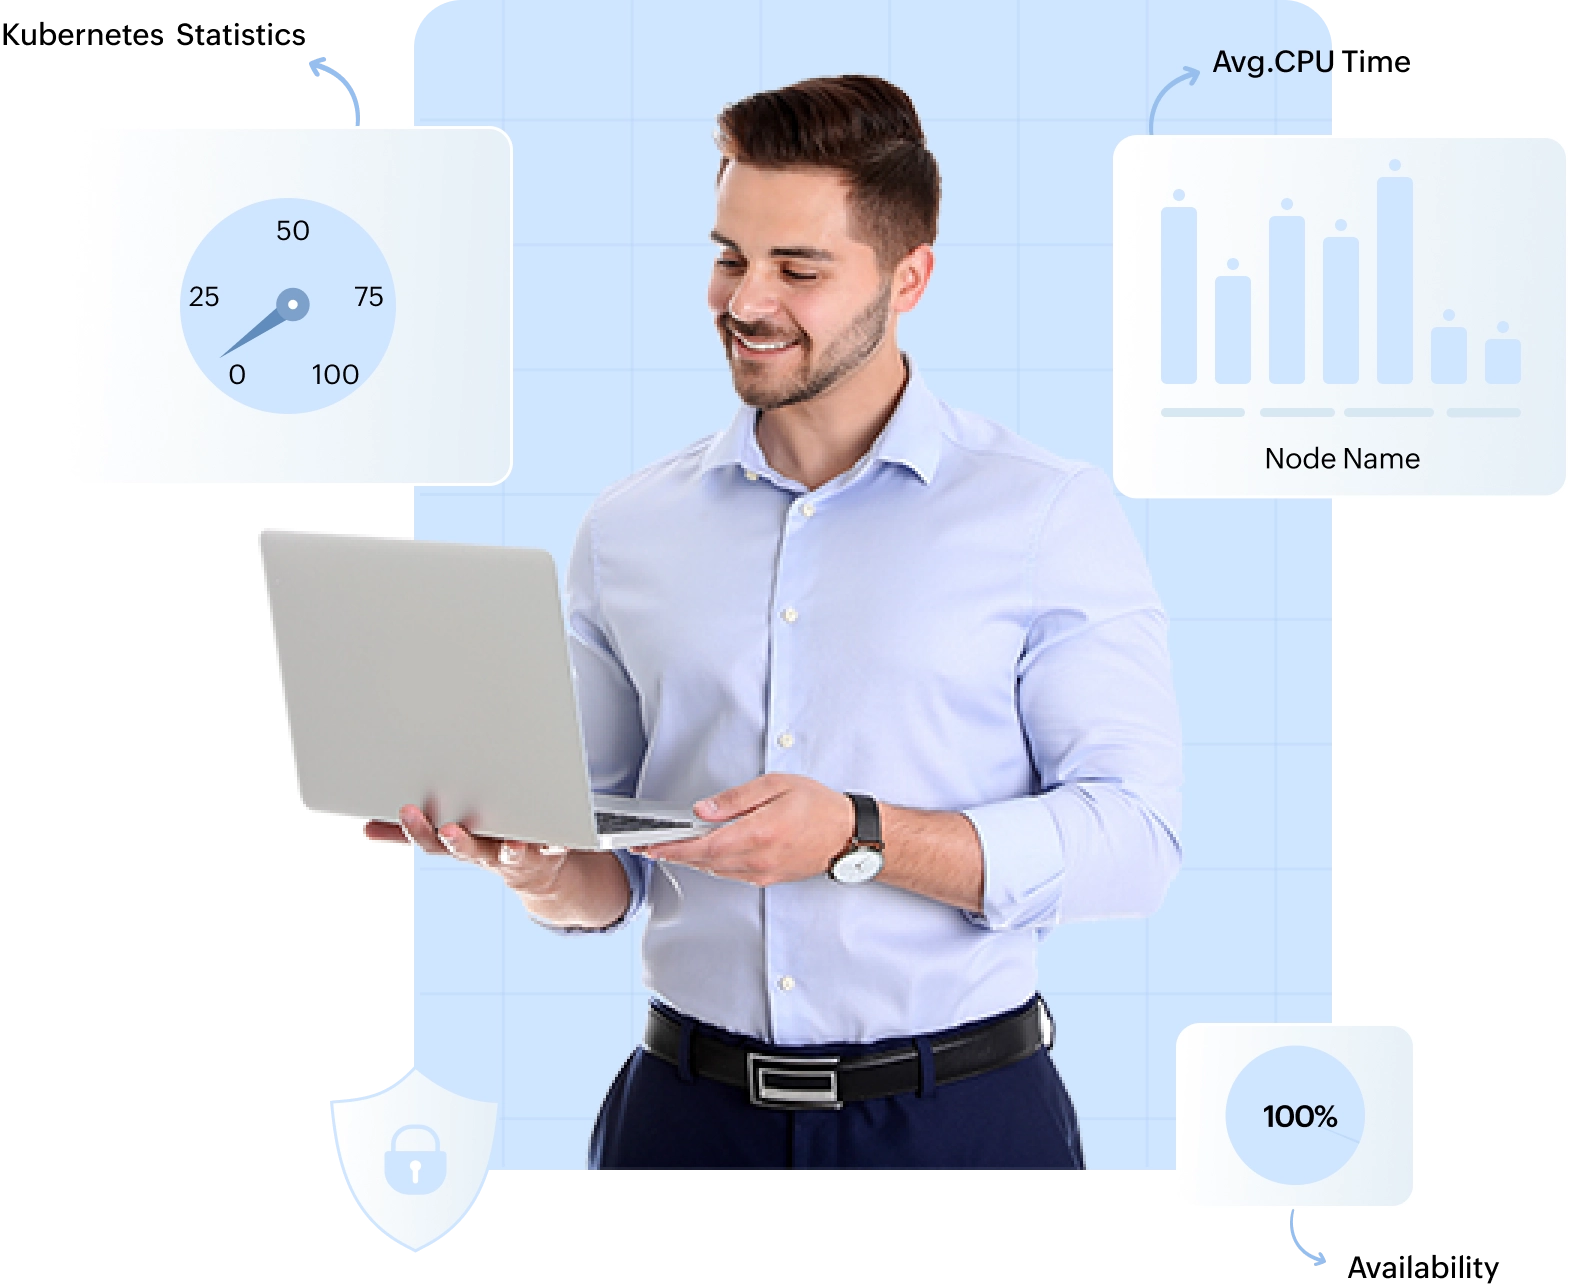
Step into the world of Kubernetes with confidence using Applications Manager as your guide. Navigate the complexities of container orchestration effortlessly while optimizing performance and ensuring robust security. Detect potential issues before they escalate, streamline your operations, and maximize uptime with comprehensive monitoring. Discover the ease of managing Kubernetes clusters with our powerful tool.
Scrape metrics from Prometheus servers in Kubernetes
Monitor essential Istio metrics such as service health, traffic flow, resource utilization, and more.
Monitor Vmware Tanzu Kubernetes via thePrometheus integration.

The best thing about ManageEngine Applications Manager is that you can monitor all your IT infrastructure such as the servers, databases from one place. Using this tool will save your IT team a lot of work.
The tool provides a lot of insights into the performance of my database, which has been helpful in identifying bottlenecks.

With a single view of everything from servers to databases, monitoring our application infrastructure has become simple. Applications Manager has made our lives way easier. The tool helps us stay aware of the performance of our critical applications 24x7.

ManageEngine recognized in the 2023 Gartner® Magic Quadrant™ for Application Performance Monitoring and Observability.
Learn more
ManageEngine recognized as a Customers' Choice in the 2023 Gartner Peer Insights™ Voice of the Customer for Application Performance Monitoring and Observability report.
Learn moreIt allows us to track crucial metrics such as response times, resource utilization, error rates, and transaction performance. The real-time monitoring alerts promptly notify us of any issues or anomalies, enabling us to take immediate action.
Reviewer Role: Research and Development

Tech Support Manager, Lexmark