Novell Monitoring
ManageEngine Applications Manager provides IT administrators with a comprehensive solution to proactively monitor the health of business-critical Novell servers. This lets you identify and resolve problems before they can have an adverse impact on your business.
The Novell Management feature optimizes Novell system performance, delivers comprehensive management reports and ensures availability through automated event detection and correction. Applications Manager also monitors processes that are running in the Novell system.
CPU Utilization Monitoring:
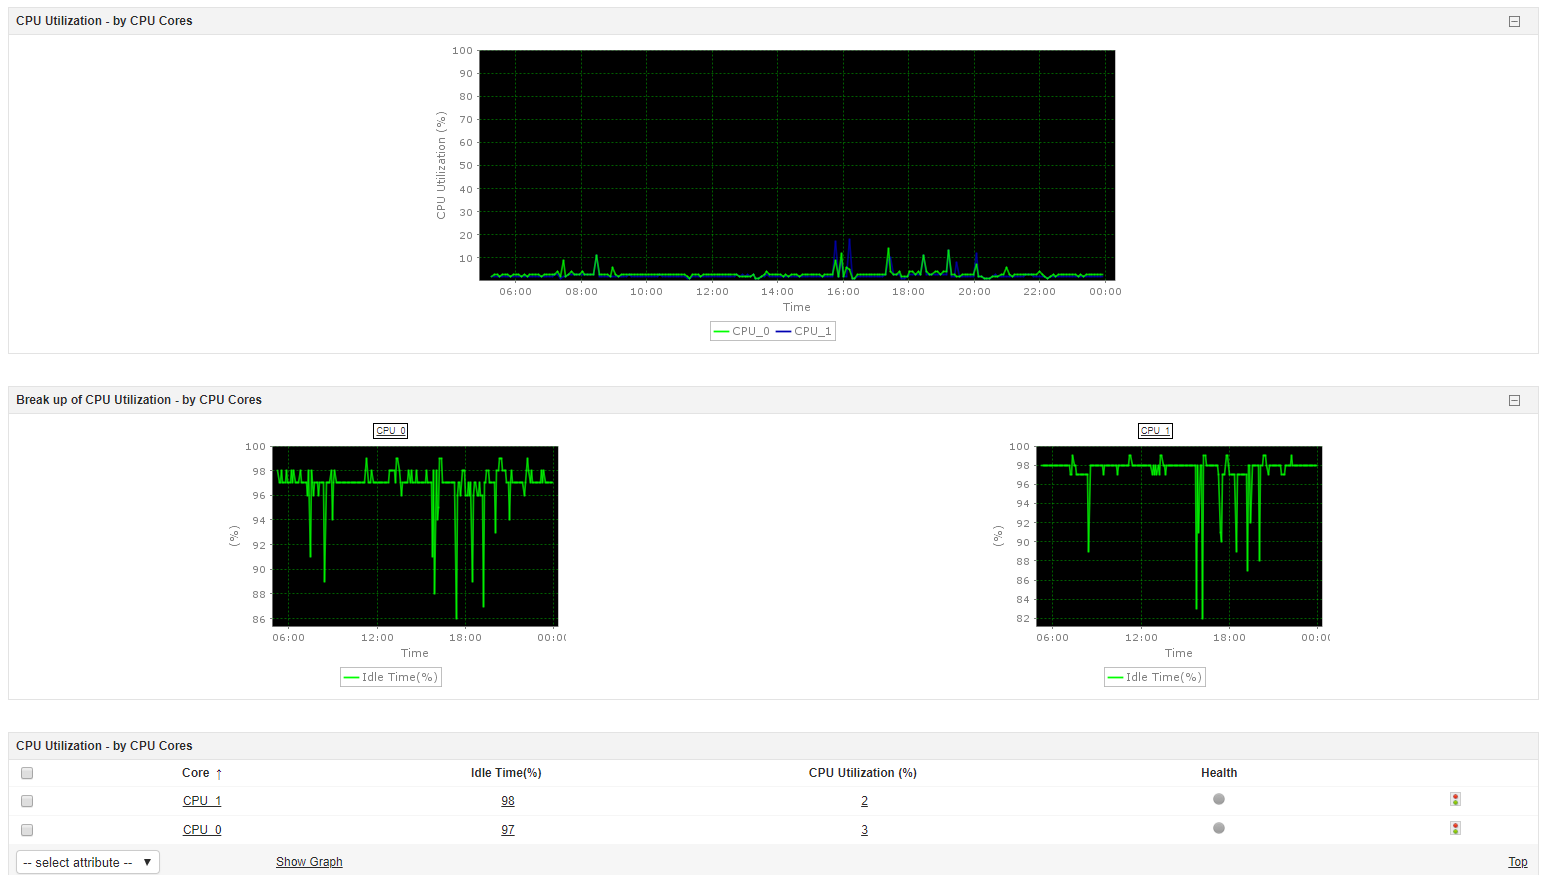
By monitoring the CPU Monitoring capability of Novell servers, you can monitor CPU usage - check if CPUs are running at full capacity or if they are being under utilized. By monitoring server CPU utilization, you can monitor server performance and restart a process or an application to improve the response time of the application.

Disk Monitoring:
Monitor the hard disk space utilized by the system and ensure critical processes on the server have sufficient system resources. This helps you maintain a margin of the available disk space. You will be notified when the disk space falls below the margin. You can also run your own programs/scripts to clear disk clutter when thresholds are crossed.

Server Process Monitoring:
Monitor and report on System Processes. Monitor memory, CPU Utilization of processes. This helps identify Top 10 or Top 'N' System Processes or Server Applications using high Server Resources.

Monitor Network Interface Traffic :
Monitor Network Interface traffic on the server and understand how much network load it handles.

Novell Monitoring Capabilities
- Out-of-the-box management of Novell availability and performance.
- Monitors performance statistics such as CPU utilization, memory utilization, disk utilization, and response time.
- Mode of monitoring is SNMP.
- Monitors processes running in Novell systems.
- Based on the thresholds configured, notifications and alarms are generated if the Novell system or any specified attribute within the system has problems. Actions are executed automatically based on configurations.
- Performance graphs and reports are available instantly. Reports can be grouped and displayed based on availability, health, and connection time.
- Delivers both historical and current Novell performance metrics, delivering insight into the performance over a period of time.
- Monitors memory usage and detects top consumers of memory.

