As a high performing application server, Resin is highly popular for its easy setup and its ability to enable web apps quickly. Manage all your Resin app servers efficiently with ManageEngine's Applications Manager, which takes a closer look at the overall performance of these servers by proactively diagnosing issues , providing instant notifications and saving a lot of troubleshooting time.
Monitor all key performance indicators of Resin app server
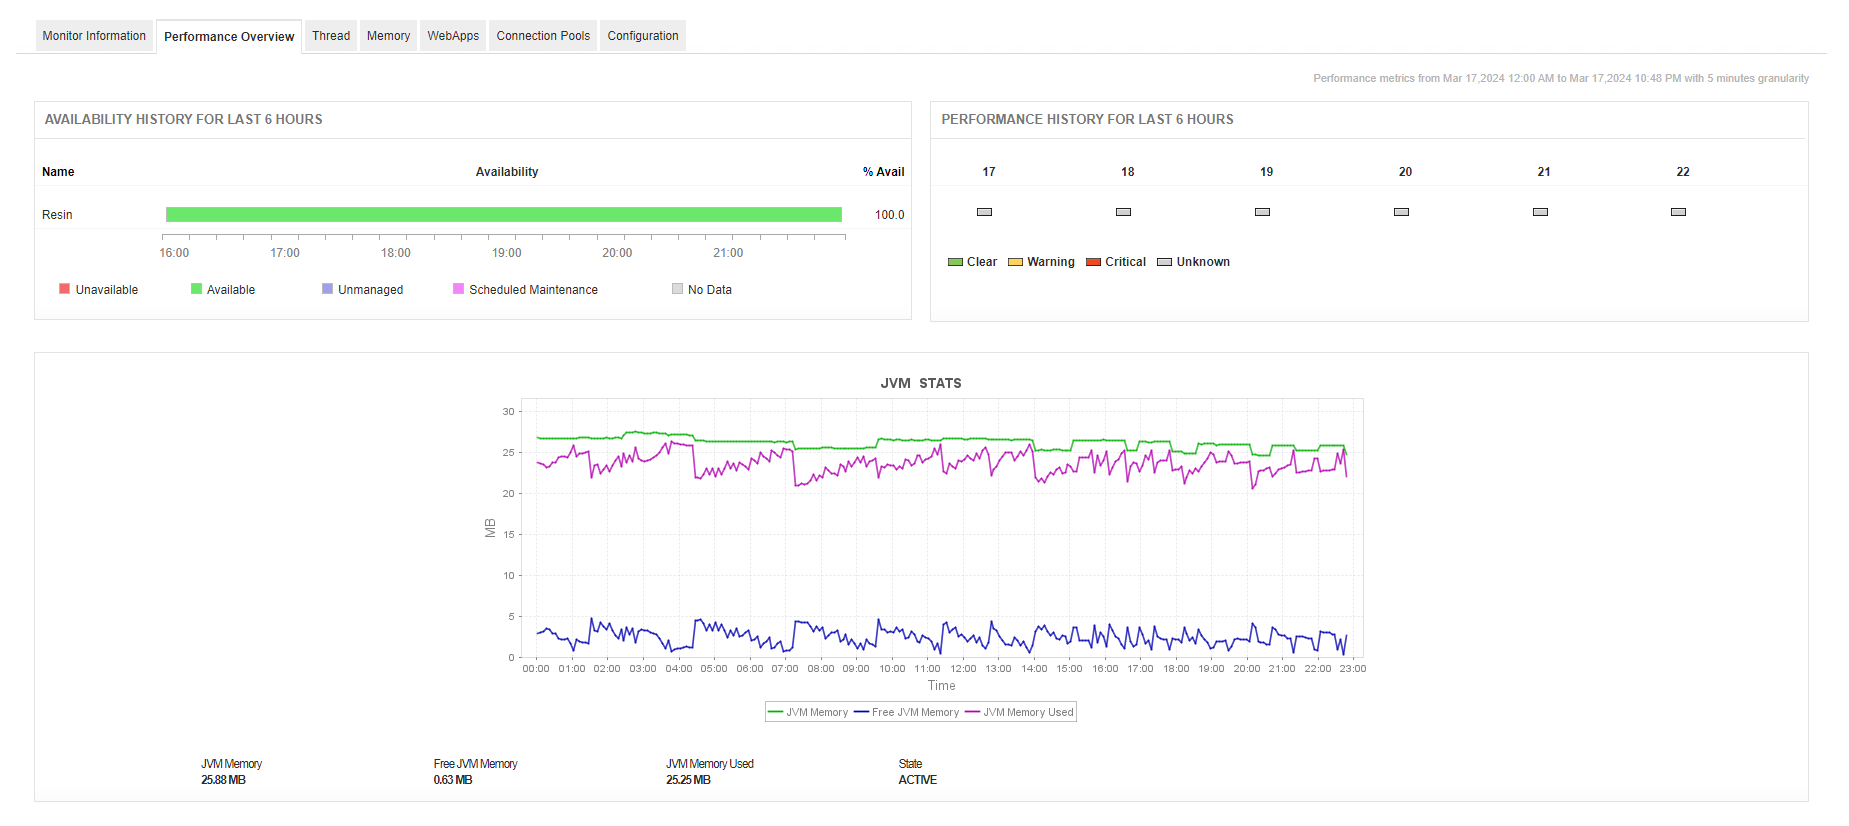
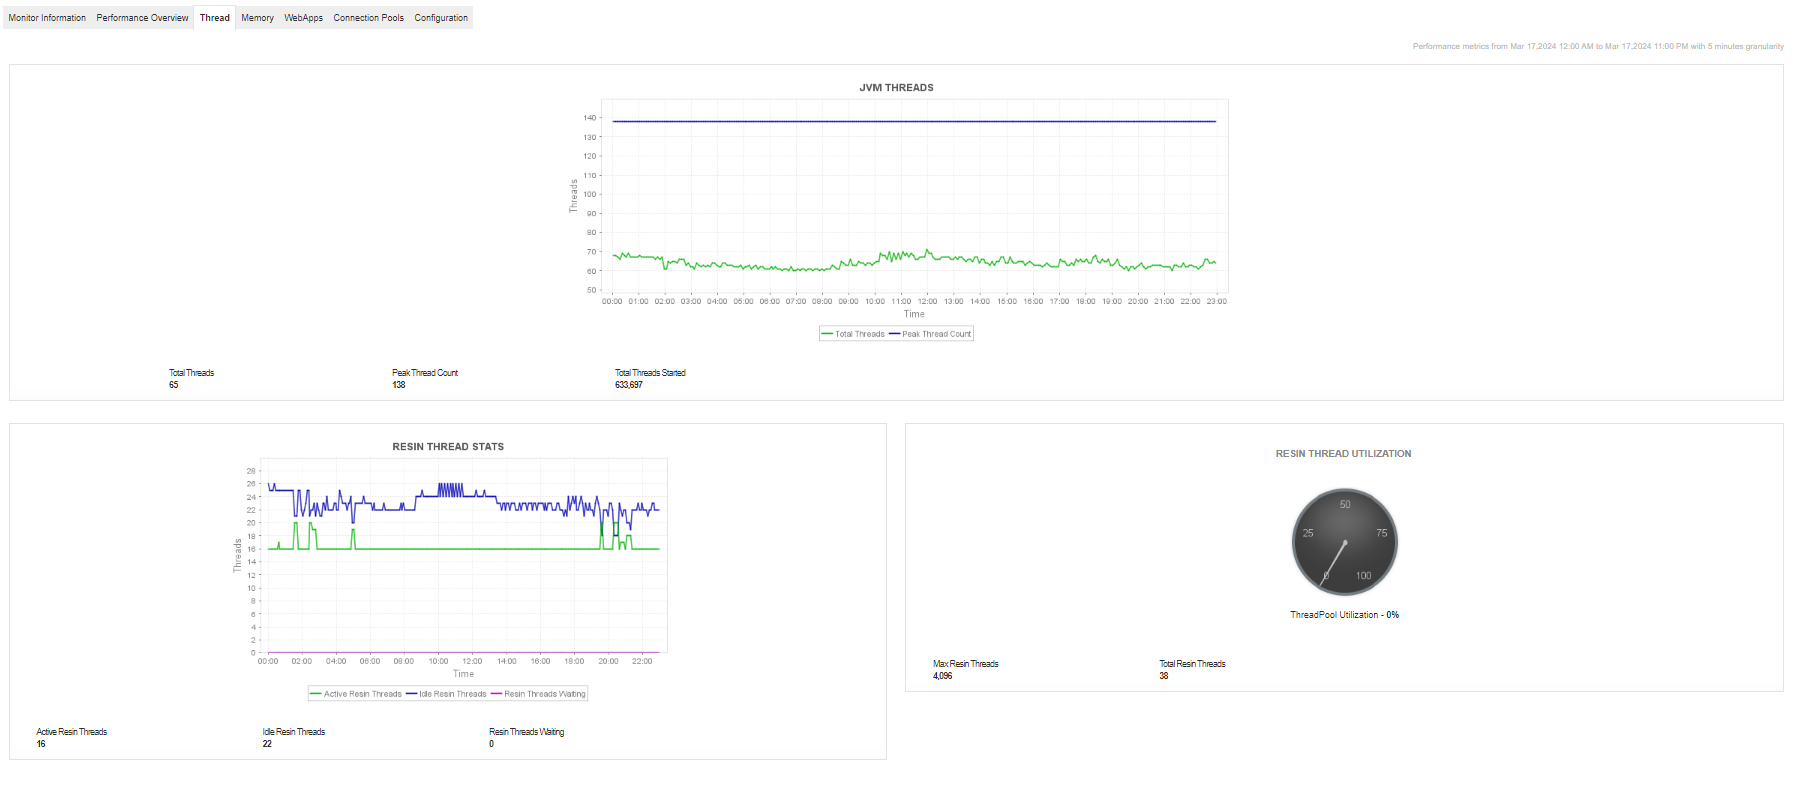
Ensure optimal resource allocation by measuring important parameters like CPU usage, JVM statistics regarding used/unused memory usage. Monitor performance of applications using critical metrics such as thread details, connection pool usage and session details.

Detect flaws in your code, by monitoring thread pools
You can efficiently track thread pool utilization to prevent deadlocks and determine any case of thread pool exhaustion.

Proactively manage memory resources
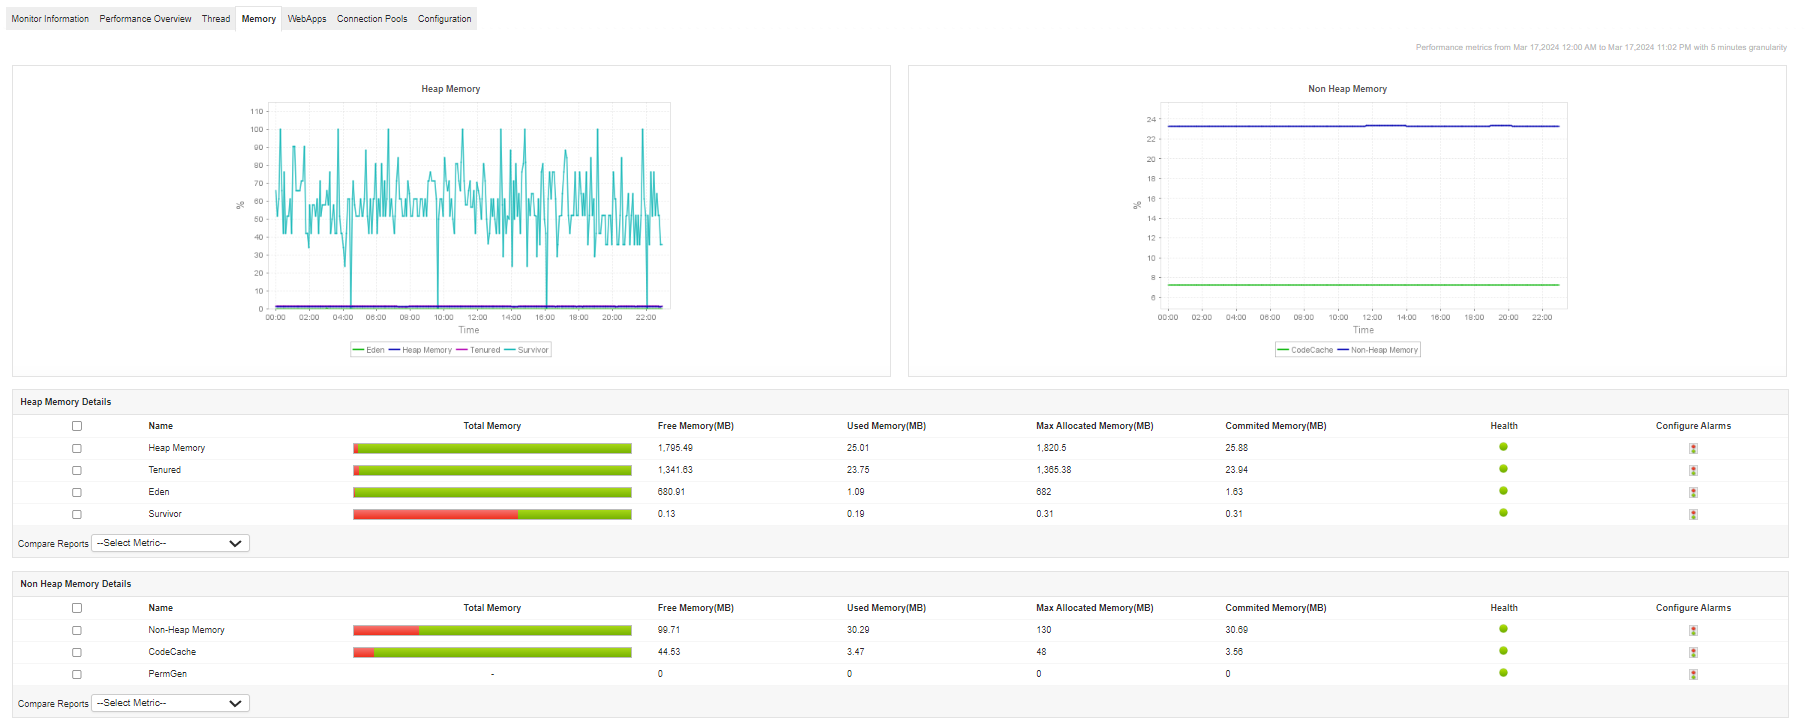
Avoid downtimes in production or deployment schedules, by monitoring the heap/non heap memory usage, detect and troubleshoot memory exceptions, memory leaks inside the Resin server

Track session details of web apps deployed on Resin server
Keep track of what your users are up to, by retrieving the session details of web apps and increase efficiency of the application, by measuring the number of timed out sessions, invalidated sessions or by checking if there is room for any other session.

Make sure that your applications are up and running
Fine tune your application's performance by identifying bottlenecks, if a process is running slow. Track connection pool usage and prevent performance deterioration of Java applications.

Manage memory allocation
Keep track of memory allocation and deallocation in the Resin server with the Garbage collector details feature. Identify and reclaim objects in memory that are no longer referenced by the application.

Monitor JVM Metrics in Resin server
Ensure the health, performance, and stability of the Resin server by tracking key JVM metrics such as JVM memory usage, CPU usage, free memory, and more.

Built-in reports and dashboards
Get an accurate overview about the health, availability and performance of Resin app servers with the help of out-of-the-box reports and dashboards.


