Sybase Replication Monitoring
Monitor and troubleshoot Sybase Replication Server issues with ease
Monitor the availability and performance of Sybase replication servers, become aware of problems as they arise, and resolve them faster.
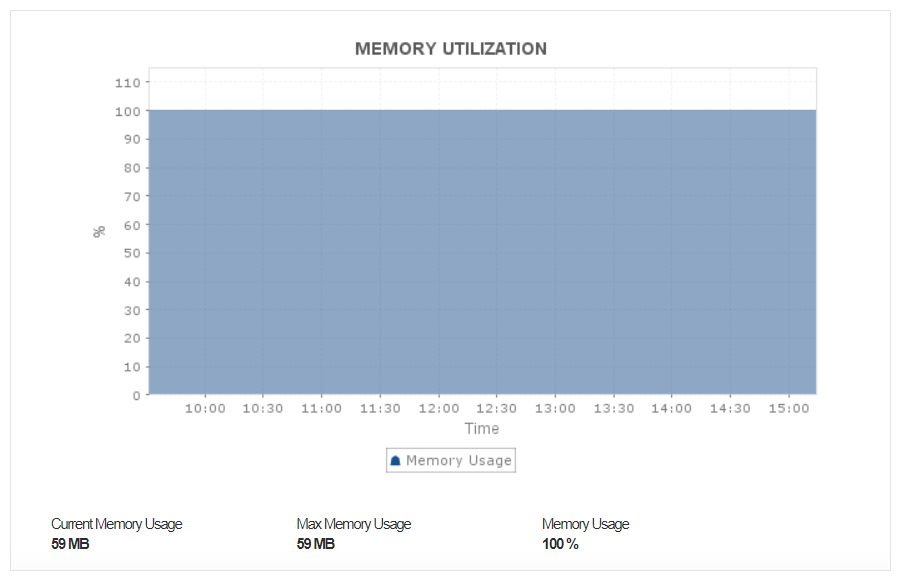
Monitor Memory and Disk Utilization:
The data replication process involves receiving data continuously and hence it is important to ensure that the server has sufficient memory to receive the transactions that need to be replicated. With Applications Manager, keep track of memory utilization of the Sybase replication server and prevent the server from shutting down automatically by configuring alerts to get notified when the usage crosses a set threshold.
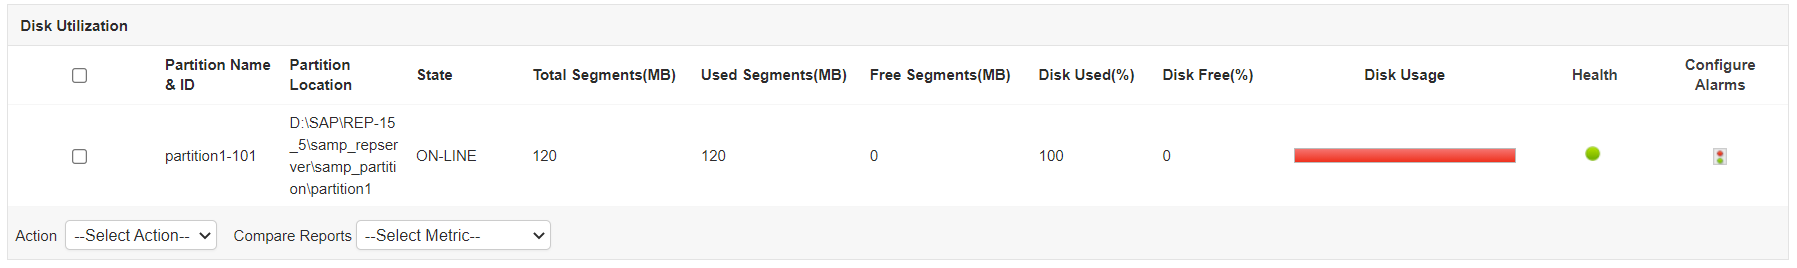
Sybase replication servers have disks that are divided into various partitions. With Applications Manager's Sybase Replication monitoring tool, you become aware of existing partitions, percentage of used and free partitions to understand the storage capacity of the replication servers.
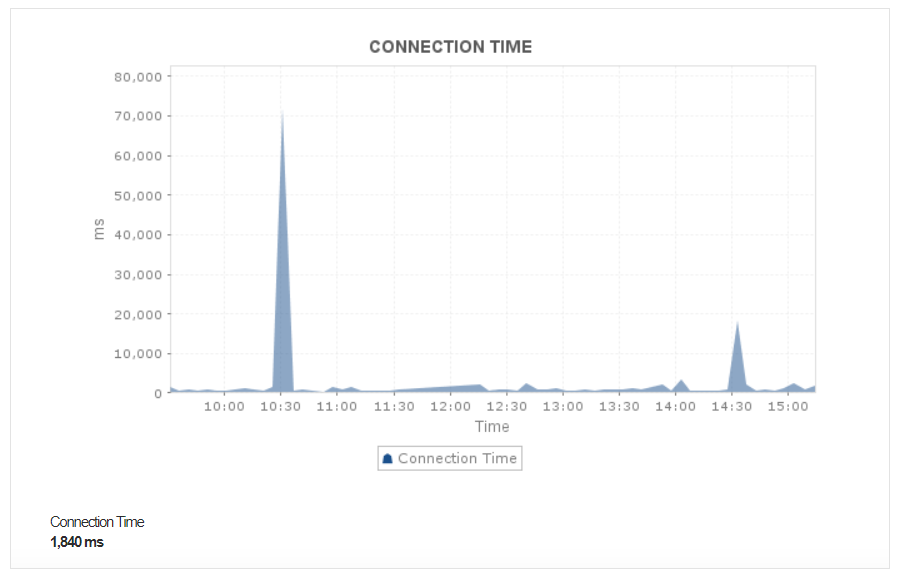
Monitor connectivity to the Replication server
Connection time refers to the amount of time taken by Applications Manager to connect to the Sybase Replication Server. If you find increasing values of connection time, you may need to check for lags or problems in the network.
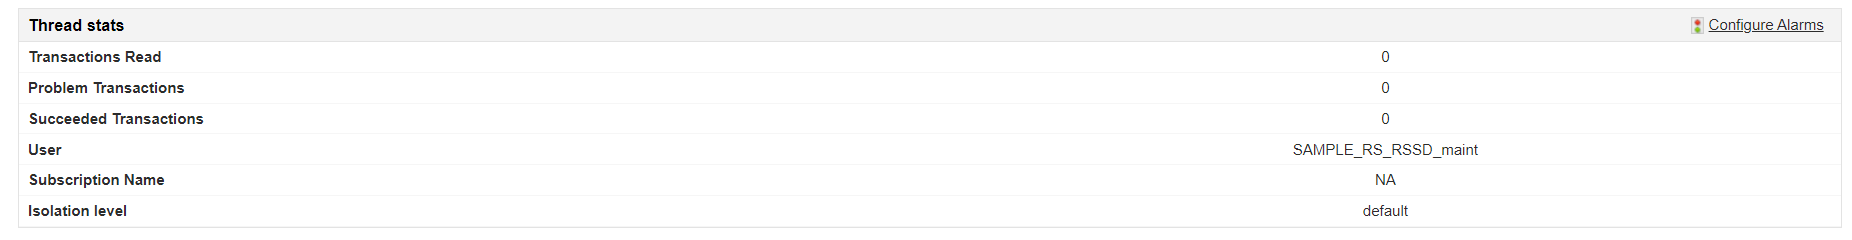
Monitor thread details
Sybase Replication Servers use different types of threads(DSI, RSI, SQT, SQM, etc.) for the data replication process. Each thread has a specific role and hence a breakdown of any thread may interrupt the replication process.
Applications Manager's Sybase replication monitoring software tracks various thread details such as its Name, State and Info. You can also configure alerts for the State metric to get notified whenever the state of the thread changes to monitor sybase replication performance efficiently.
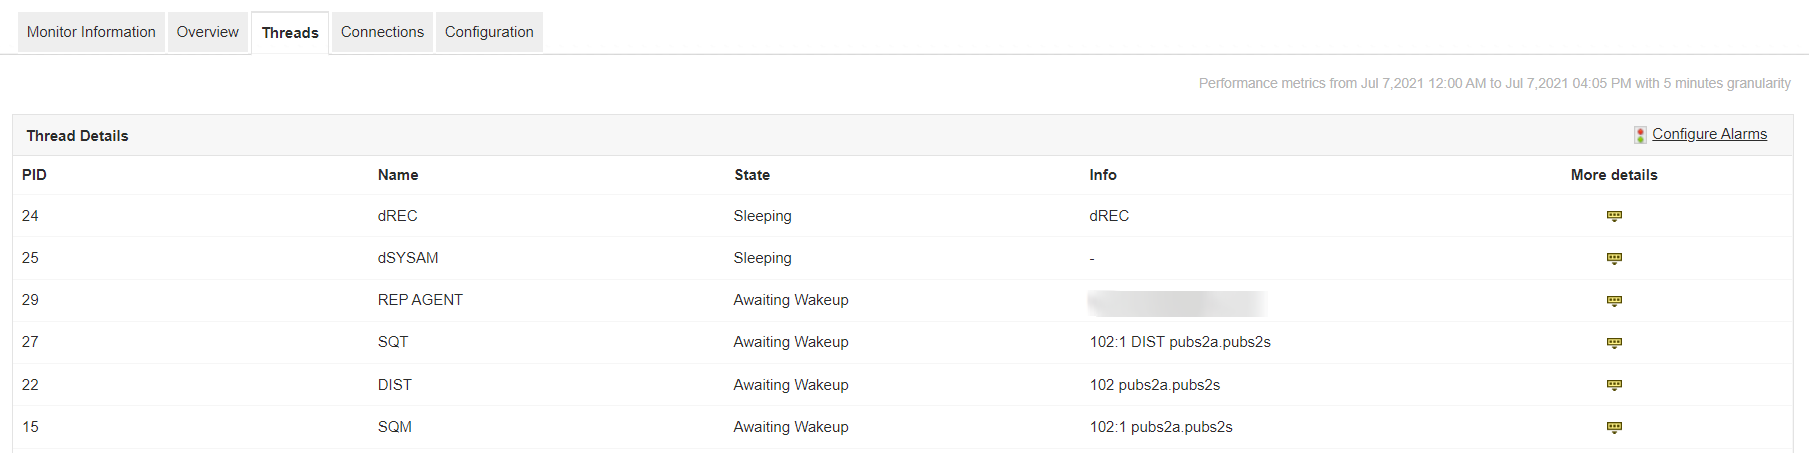
Furthermore, get deep insights about DIST, DSI, RSI, SQM, and SQT threads by clicking on 'More Details' option. These metrics may differ based on the type of thread.
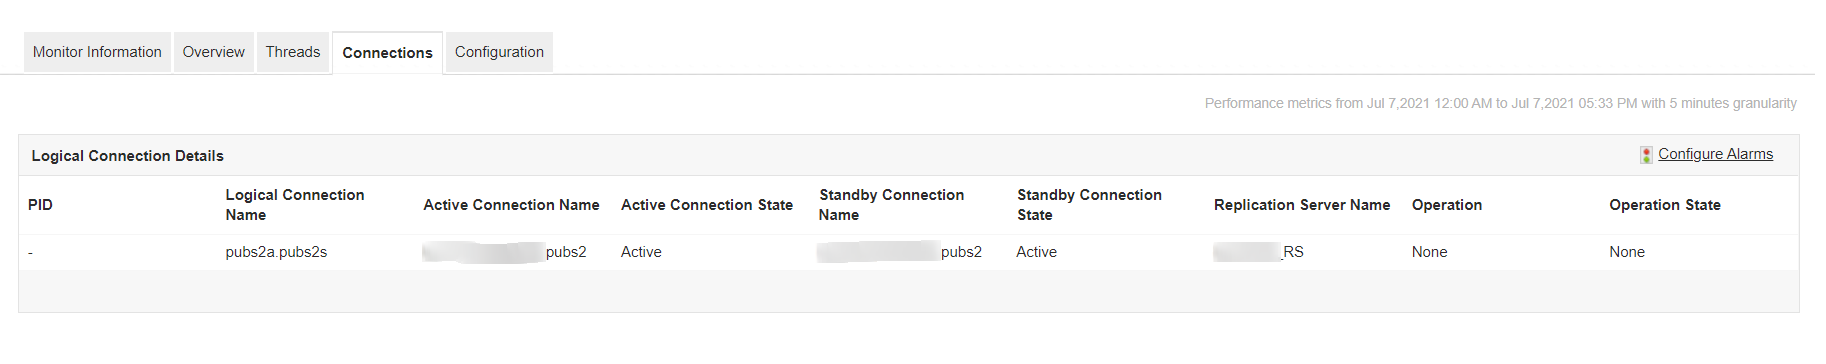
Keep track of logical connection details
There are different types of replication processes. The Warm Standby replication mode involves creation of a logical connection that is set up to establish a symbolic name for the active and standby databases.
With Applications Manager's Sybase Replication server monitoring capabilities, get insights about various Logical Connection parameters. Become aware of the connection states of both the Active and the Standby databases. Identify if the replication is in progress or is waiting by analyzing the Operation State details.
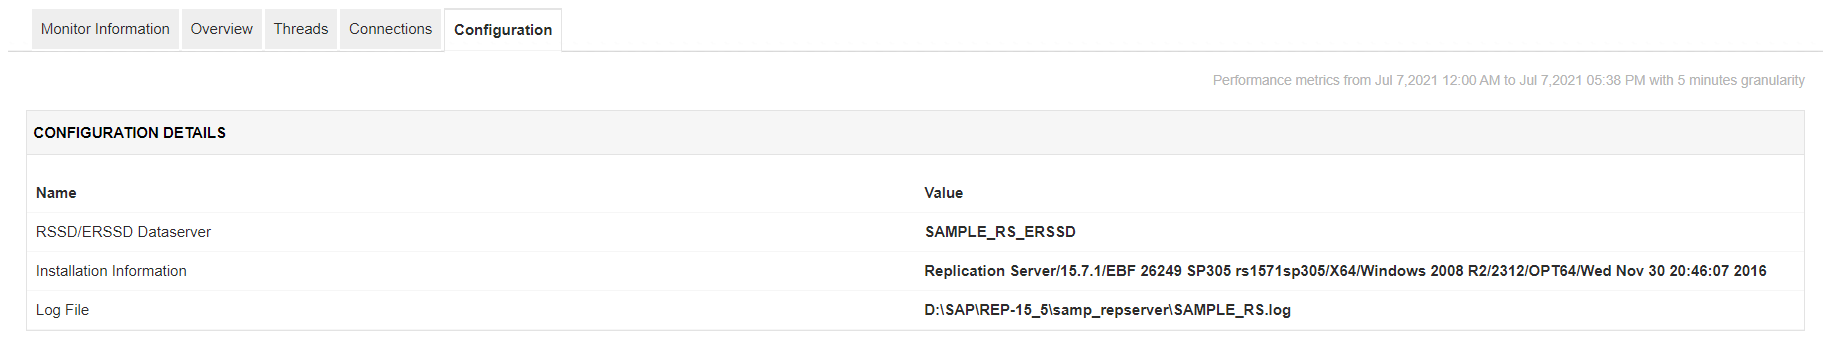
Keep tabs on Replication details
Get to know about the server's configuration details with a single glance. Become aware of the type of server used and the path of the log file to access it instantly in case of any problems.
Resolve performance issues faster
You can easily configure Applications Manager to alert you when a resource requires attention. The tool will alert you when any key performance indicator goes off track. You can also receive this alert as an email, SMS or a Slack message.
Integrate with the ticketing tool of your choice
You can automate tasks using web hooks to start external actions or to even integrate with your ITSM tools such as ServiceNow or ManageEngine ServiceDesk Plus.
Start monitoring Sybase Replication servers in just a few minutes!
Applications Manager's agentless, non-invasive monitoring is easy to set up. You can be up and running in just a few minutes.
To get started, download a 30-day free trial now.
In addition to Sybase Replication Monitoring, Applications Manager also offers Sybase monitoring.
