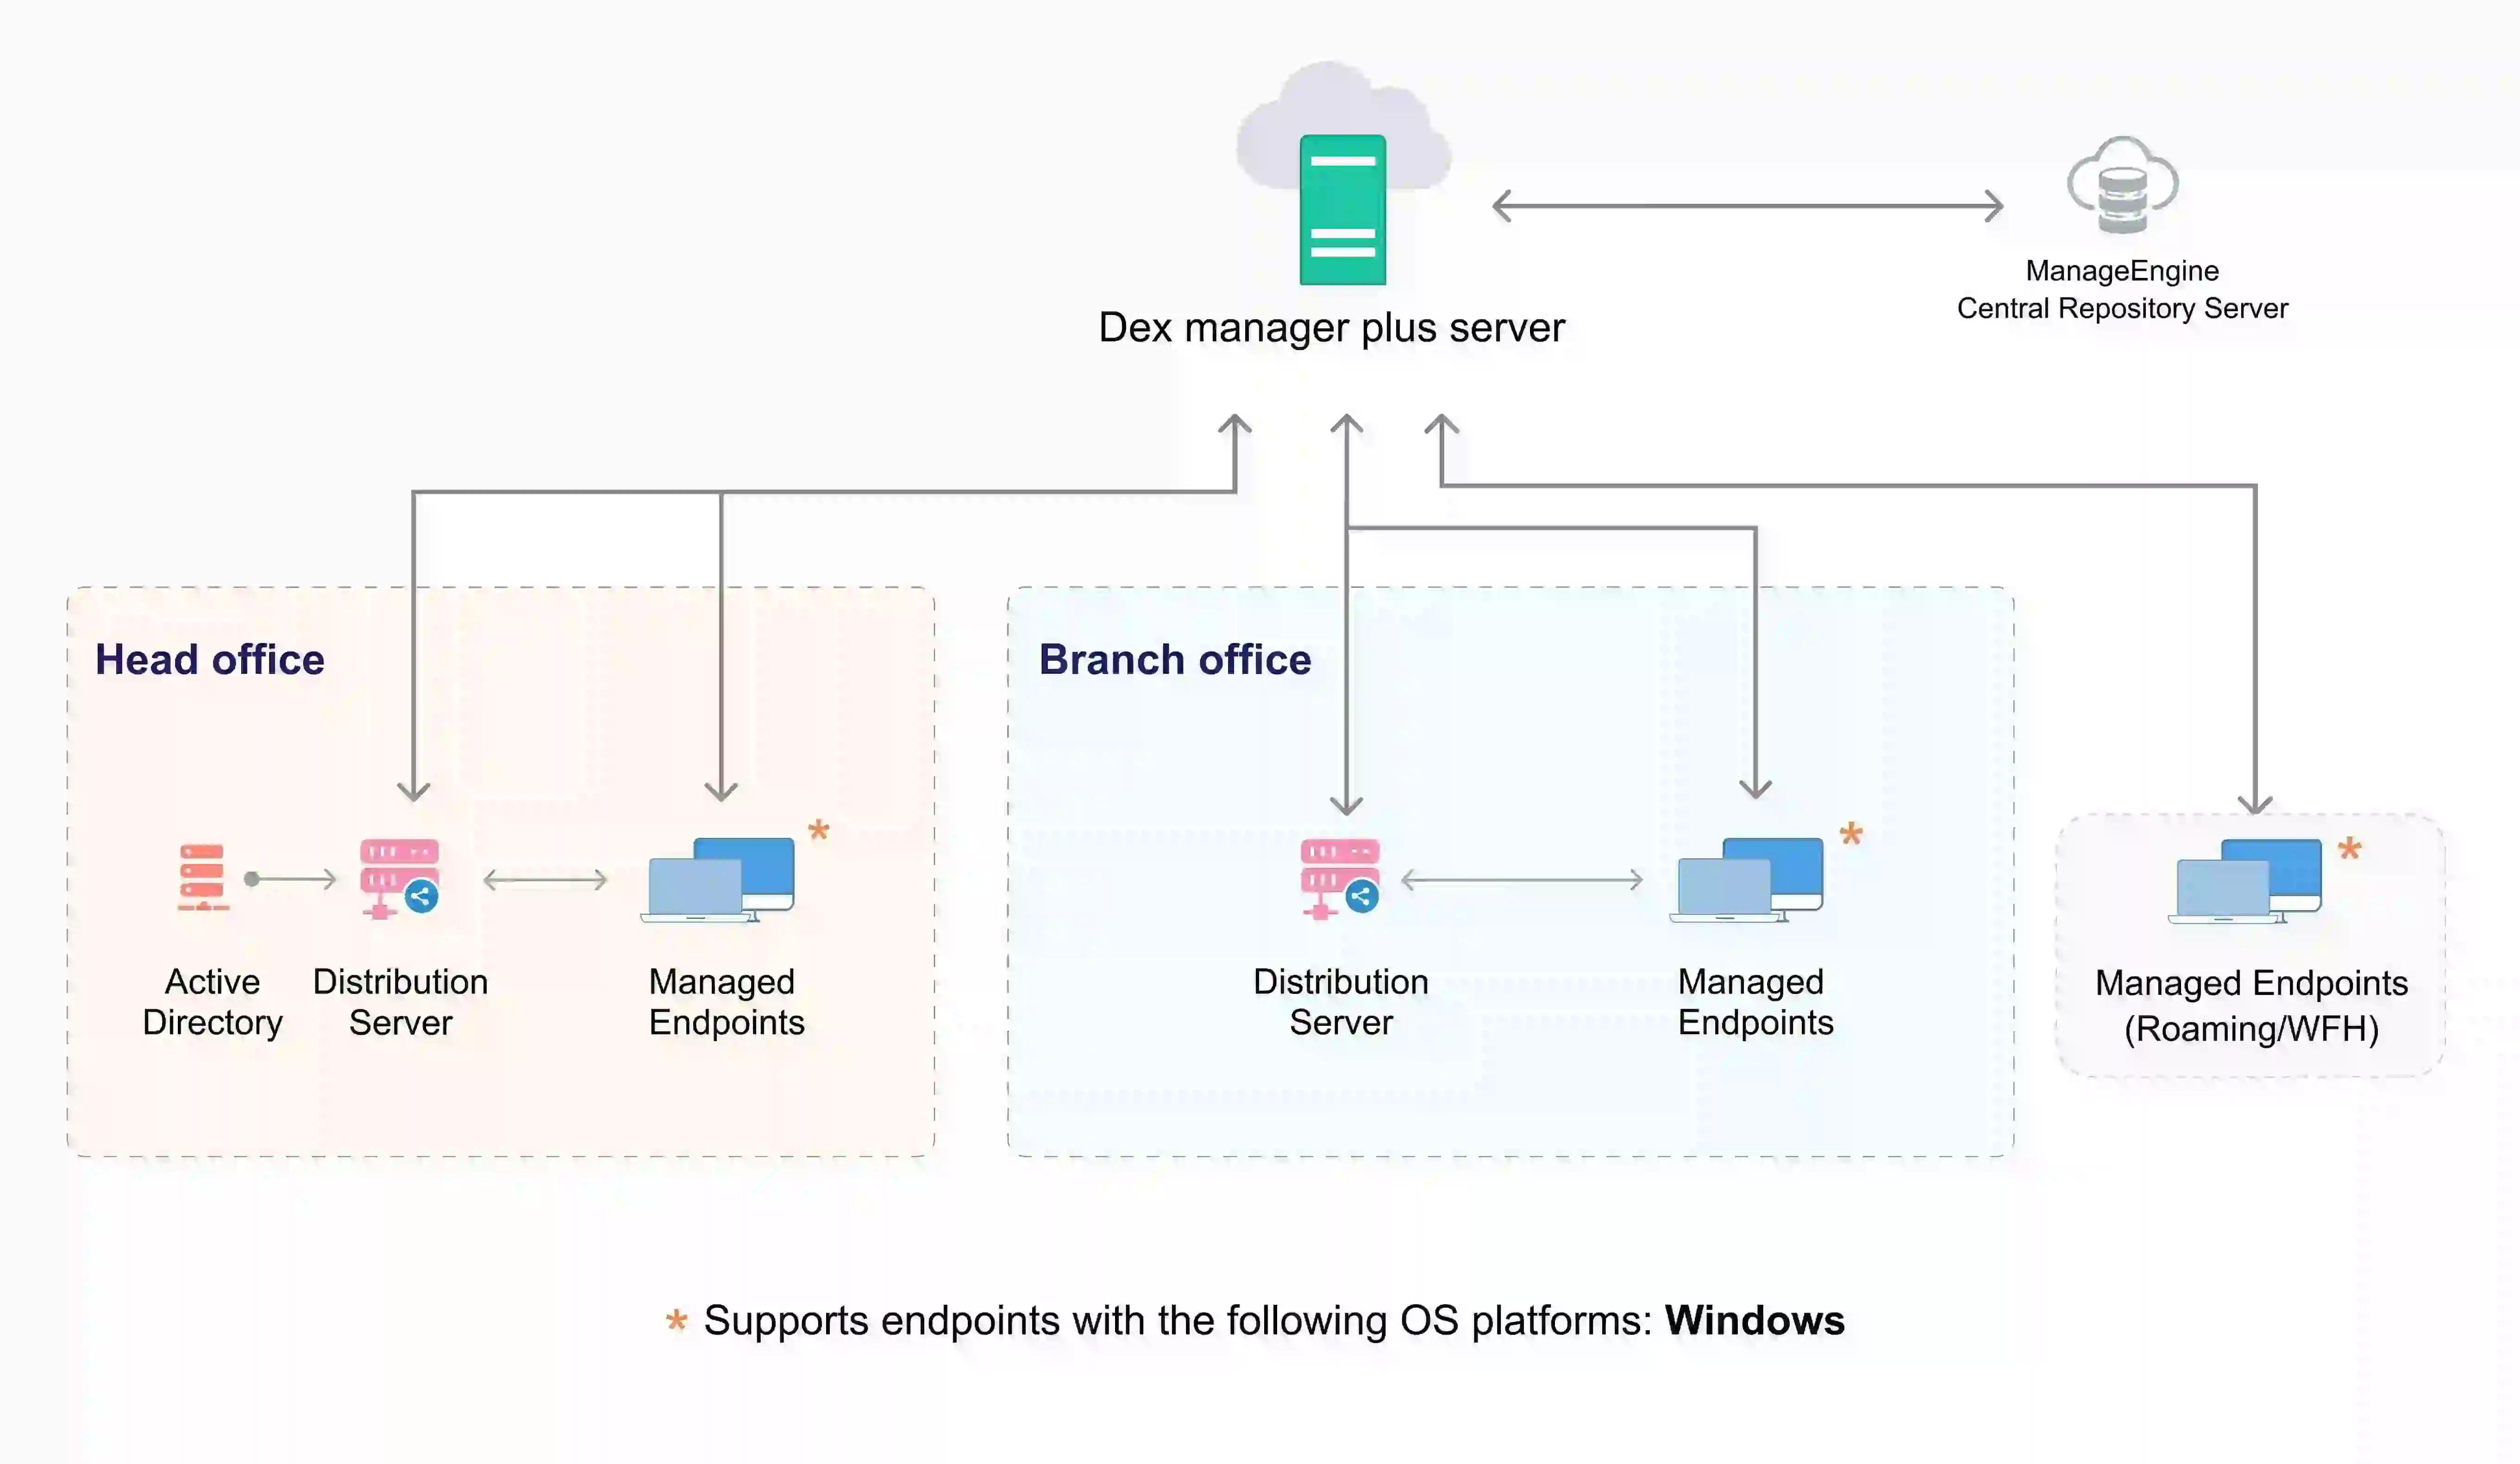
DEX Manager Plus Cloud Architecture
Overview
DEX Manager Plus empowers IT teams to enhance digital employee experiences through real-time monitoring, proactive issue detection, automated remediation, and actionable analytics — all delivered through a scalable cloud architecture. It is purpose-built to track and improve endpoint performance, application stability, and user satisfaction across distributed environments.
The platform offers deep visibility into device health, network behavior and application reliability enabling IT to address performance bottlenecks before they impact productivity. When issues are detected, IT teams can leverage built-in workflows to trigger fixes automatically — such as executing scripts, restarting services etc. — ensuring faster resolution and minimal downtime.
This article explains how functions within your network using its cloud-native architecture.
DEX Manager Plus Cloud Architecture
The cloud architecture of consists of multiple components that work together to collect endpoint telemetry, provide actionable insights, enable IT workflows, and deliver continuous optimization across your organization.

Architecture Components
| Component | Purpose |
|---|---|
| Cloud Server | The cloud-hosted management layer where all endpoint telemetry is processed, stored, and visualized. Accessible to IT administrators and technicians via a secure web console. |
| Agent | Lightweight software installed on managed endpoints to collect performance metrics, application usage data, network statistics. Executes assigned workflows and remote actions. |
| Distribution Server (AD Connector) | An optional component can be deployed in branch or remote offices to function as an Active Directory (AD) Connector for active directory integration and to optimize bandwidth usage by replicating data from central server and serving it to remote office agents. |
| Active Directory | Directory service from which device , user details and its objects (Groups, OUs) can be synchronized via the AD Connector. |
| Web Console | Browser-based interface that allows IT administrators to view analytics, run reports, configure workflows, and troubleshoot devices remotely. Serves as the command center for orchestration. |
How Data Flows in the Architecture
Telemetry Collection
The Agent continuously collects endpoint telemetry such as CPU and memory usage, application crash, network latency, device health.
This data is securely sent to the Cloud Server at defined intervals.
Data Processing & Insights Generation
The Cloud Server processes the collected data and generate actionable insights and recommendation every one hour. These are made available in Web Console.
IT Decision & Workflow Orchestration
IT administrators access the Web Console to review dashboards, analyze device data insights, and drill down into endpoint issues to determine the root cause.
Workflows are created to automate responses for the identified issues.
Workflow Deployment & Execution
When triggered, workflows are delivered from the Cloud Server to agents during their scheduled check-ins.
The agents then execute the assigned tasks locally, enabling real-time or scheduled remediation
Feedback Loop
Results of workflow execution are sent back to the Cloud Server, closing the loop for continuous optimization.


 Yes
Yes