Managing Insights
Overview
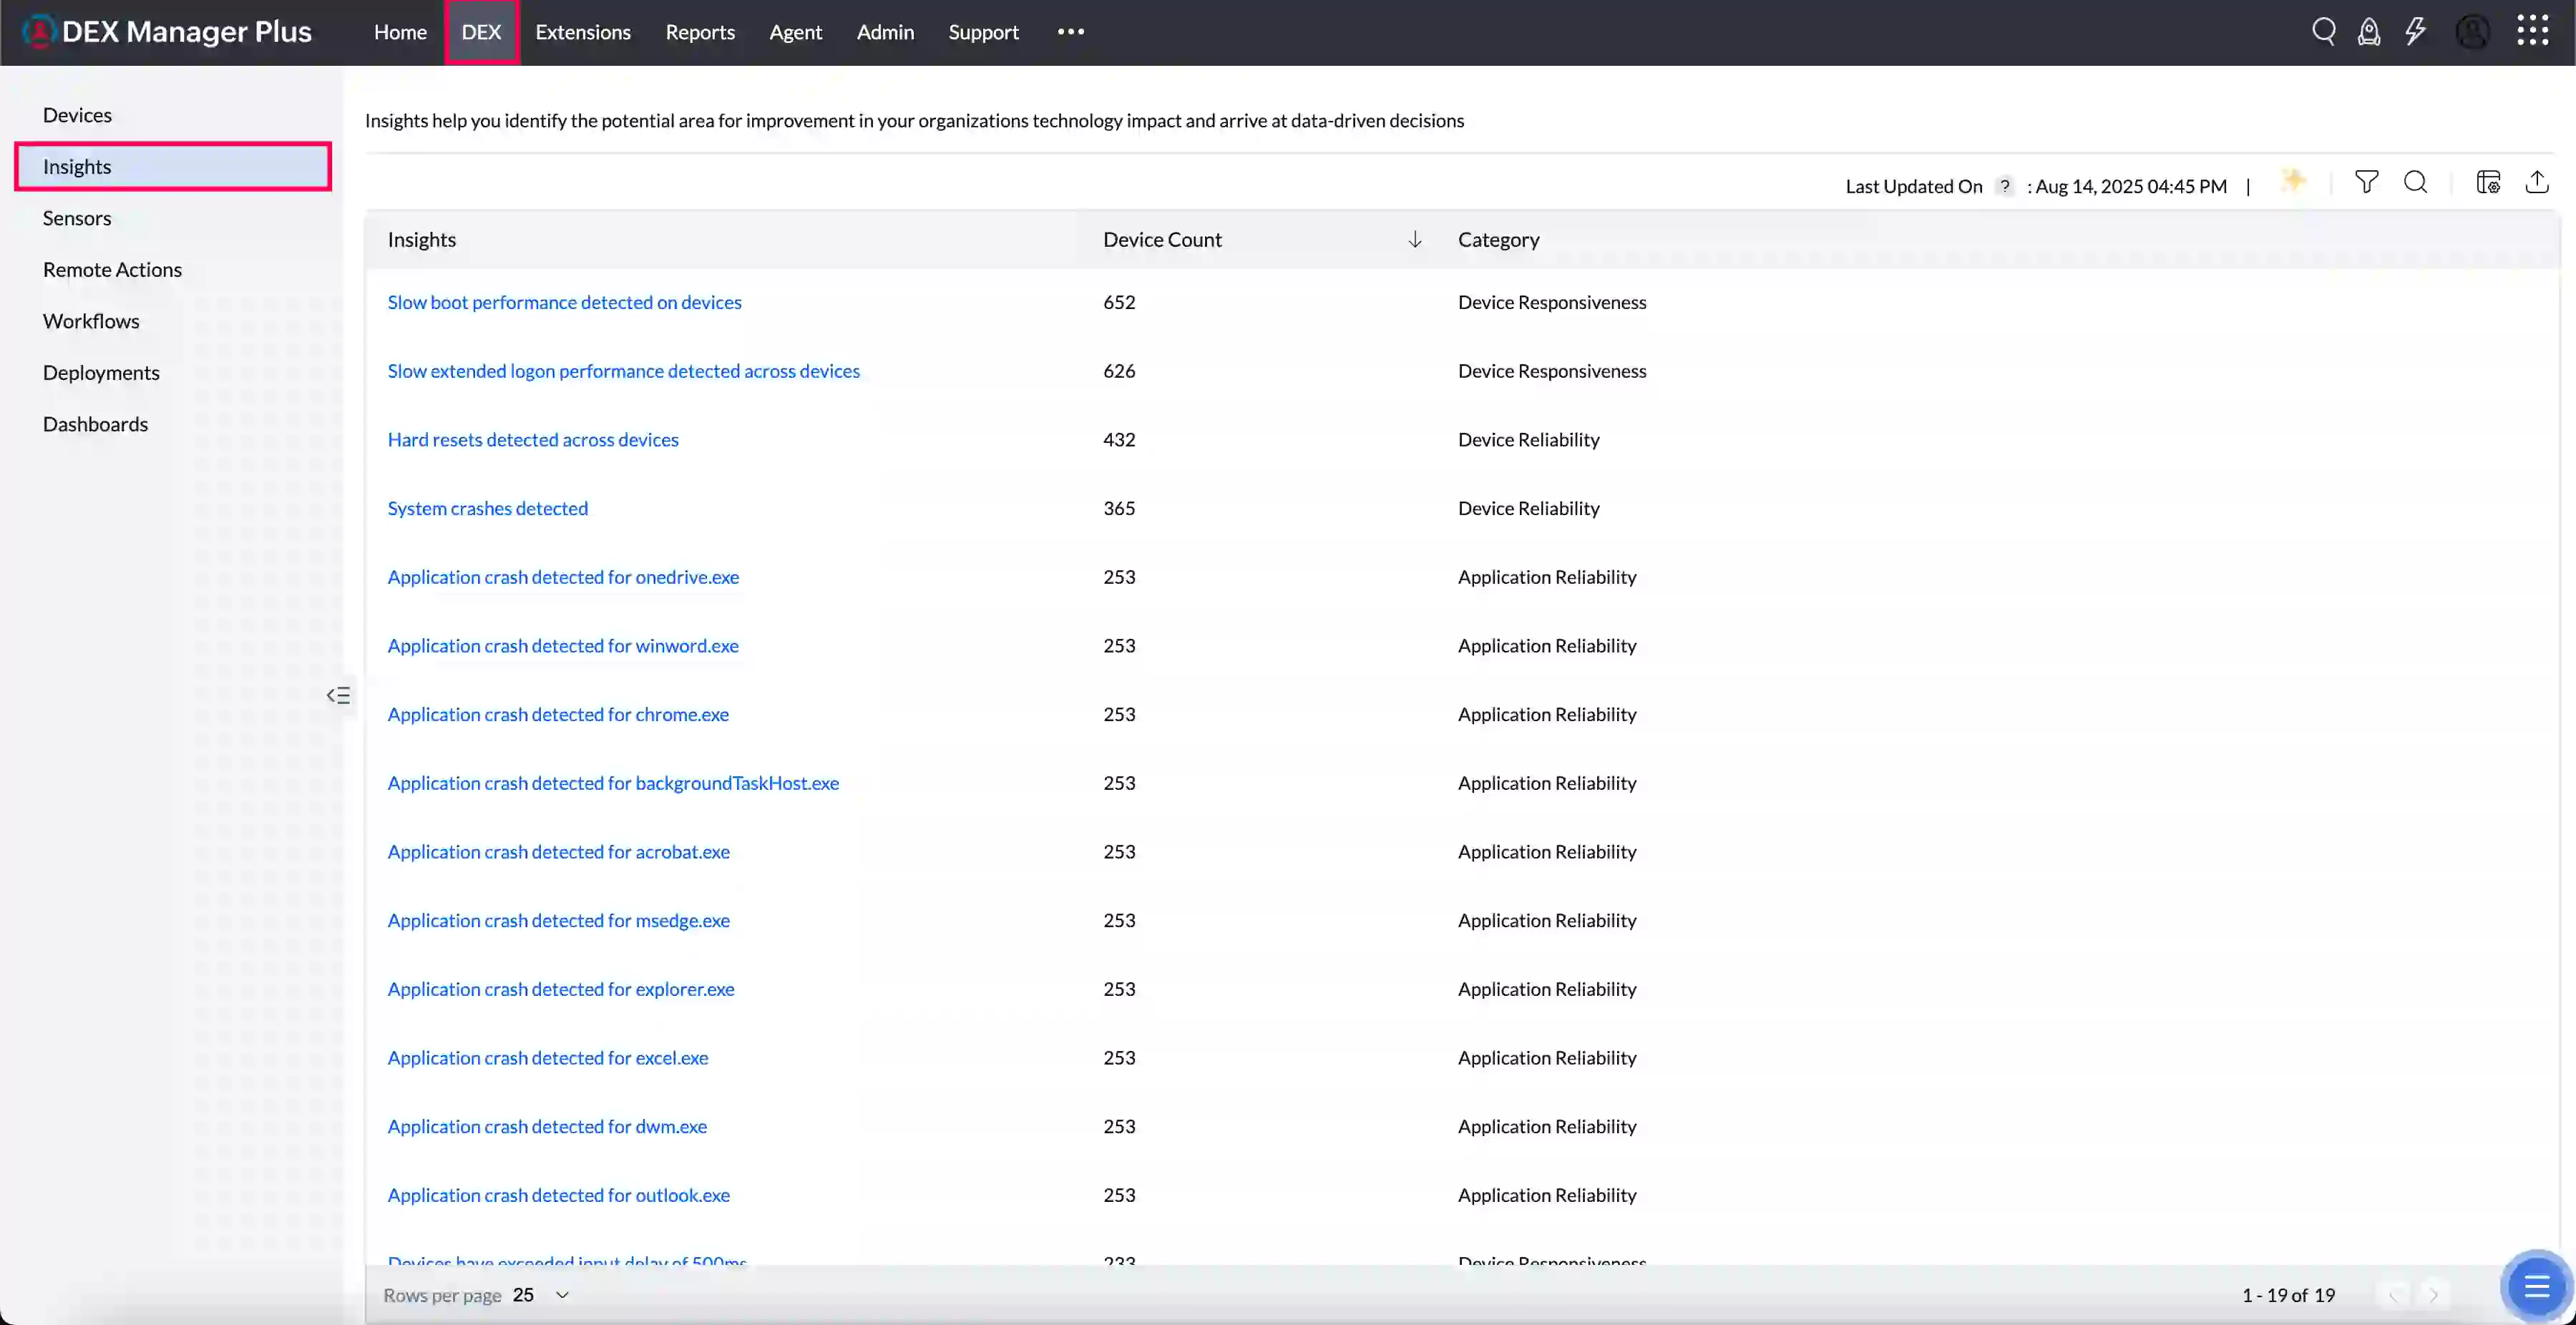
The Insights module in DEX Manager Plus provides IT administrators with intelligent, data-driven observations about endpoint health, reliability, performance and application stability. These insights are automatically generated based on violations of configured thresholds . By surfacing actionable insights, DEX Manager Plus helps teams detect issues early, triage devices, and take remediation to improve the digital experience.
Whether it’s identifying high crash rates, degraded boot performance, or aging hardware, Insights offers the clarity needed to take proactive action.
How Insights Work
Insights are triggered when monitored health indicators breach the thresholds defined under Insights. Each insight corresponds to a specific category and metric and includes:
- A short description of the issue
- The number of impacted devices
- The category it falls under (e.g., Performance, Stability)
- The timestamp of the last update
Accessing the Insights Page
Navigate to DEX > Insights from the left-hand pane. The main panel displays a table of all active insights.

| Column | Description |
|---|---|
| Insight | Describes the observed issue (e.g., "High memory usage"). Click to view details. |
| Device Count | Number of endpoints currently affected by the issue. |
| Category | Classification: Device Performance, Application Reliability, Stability, or Responsiveness. |
| Last Updated On | Timestamp of the most recent insight refresh. |
Using the Insights Interface
- Filters: Narrow insights by category.
- Search: Locate specific insight types quickly (e.g., “disk space”).
- Export: Download the full list of insights for offline analysis or reporting.
Configuring Insight Thresholds
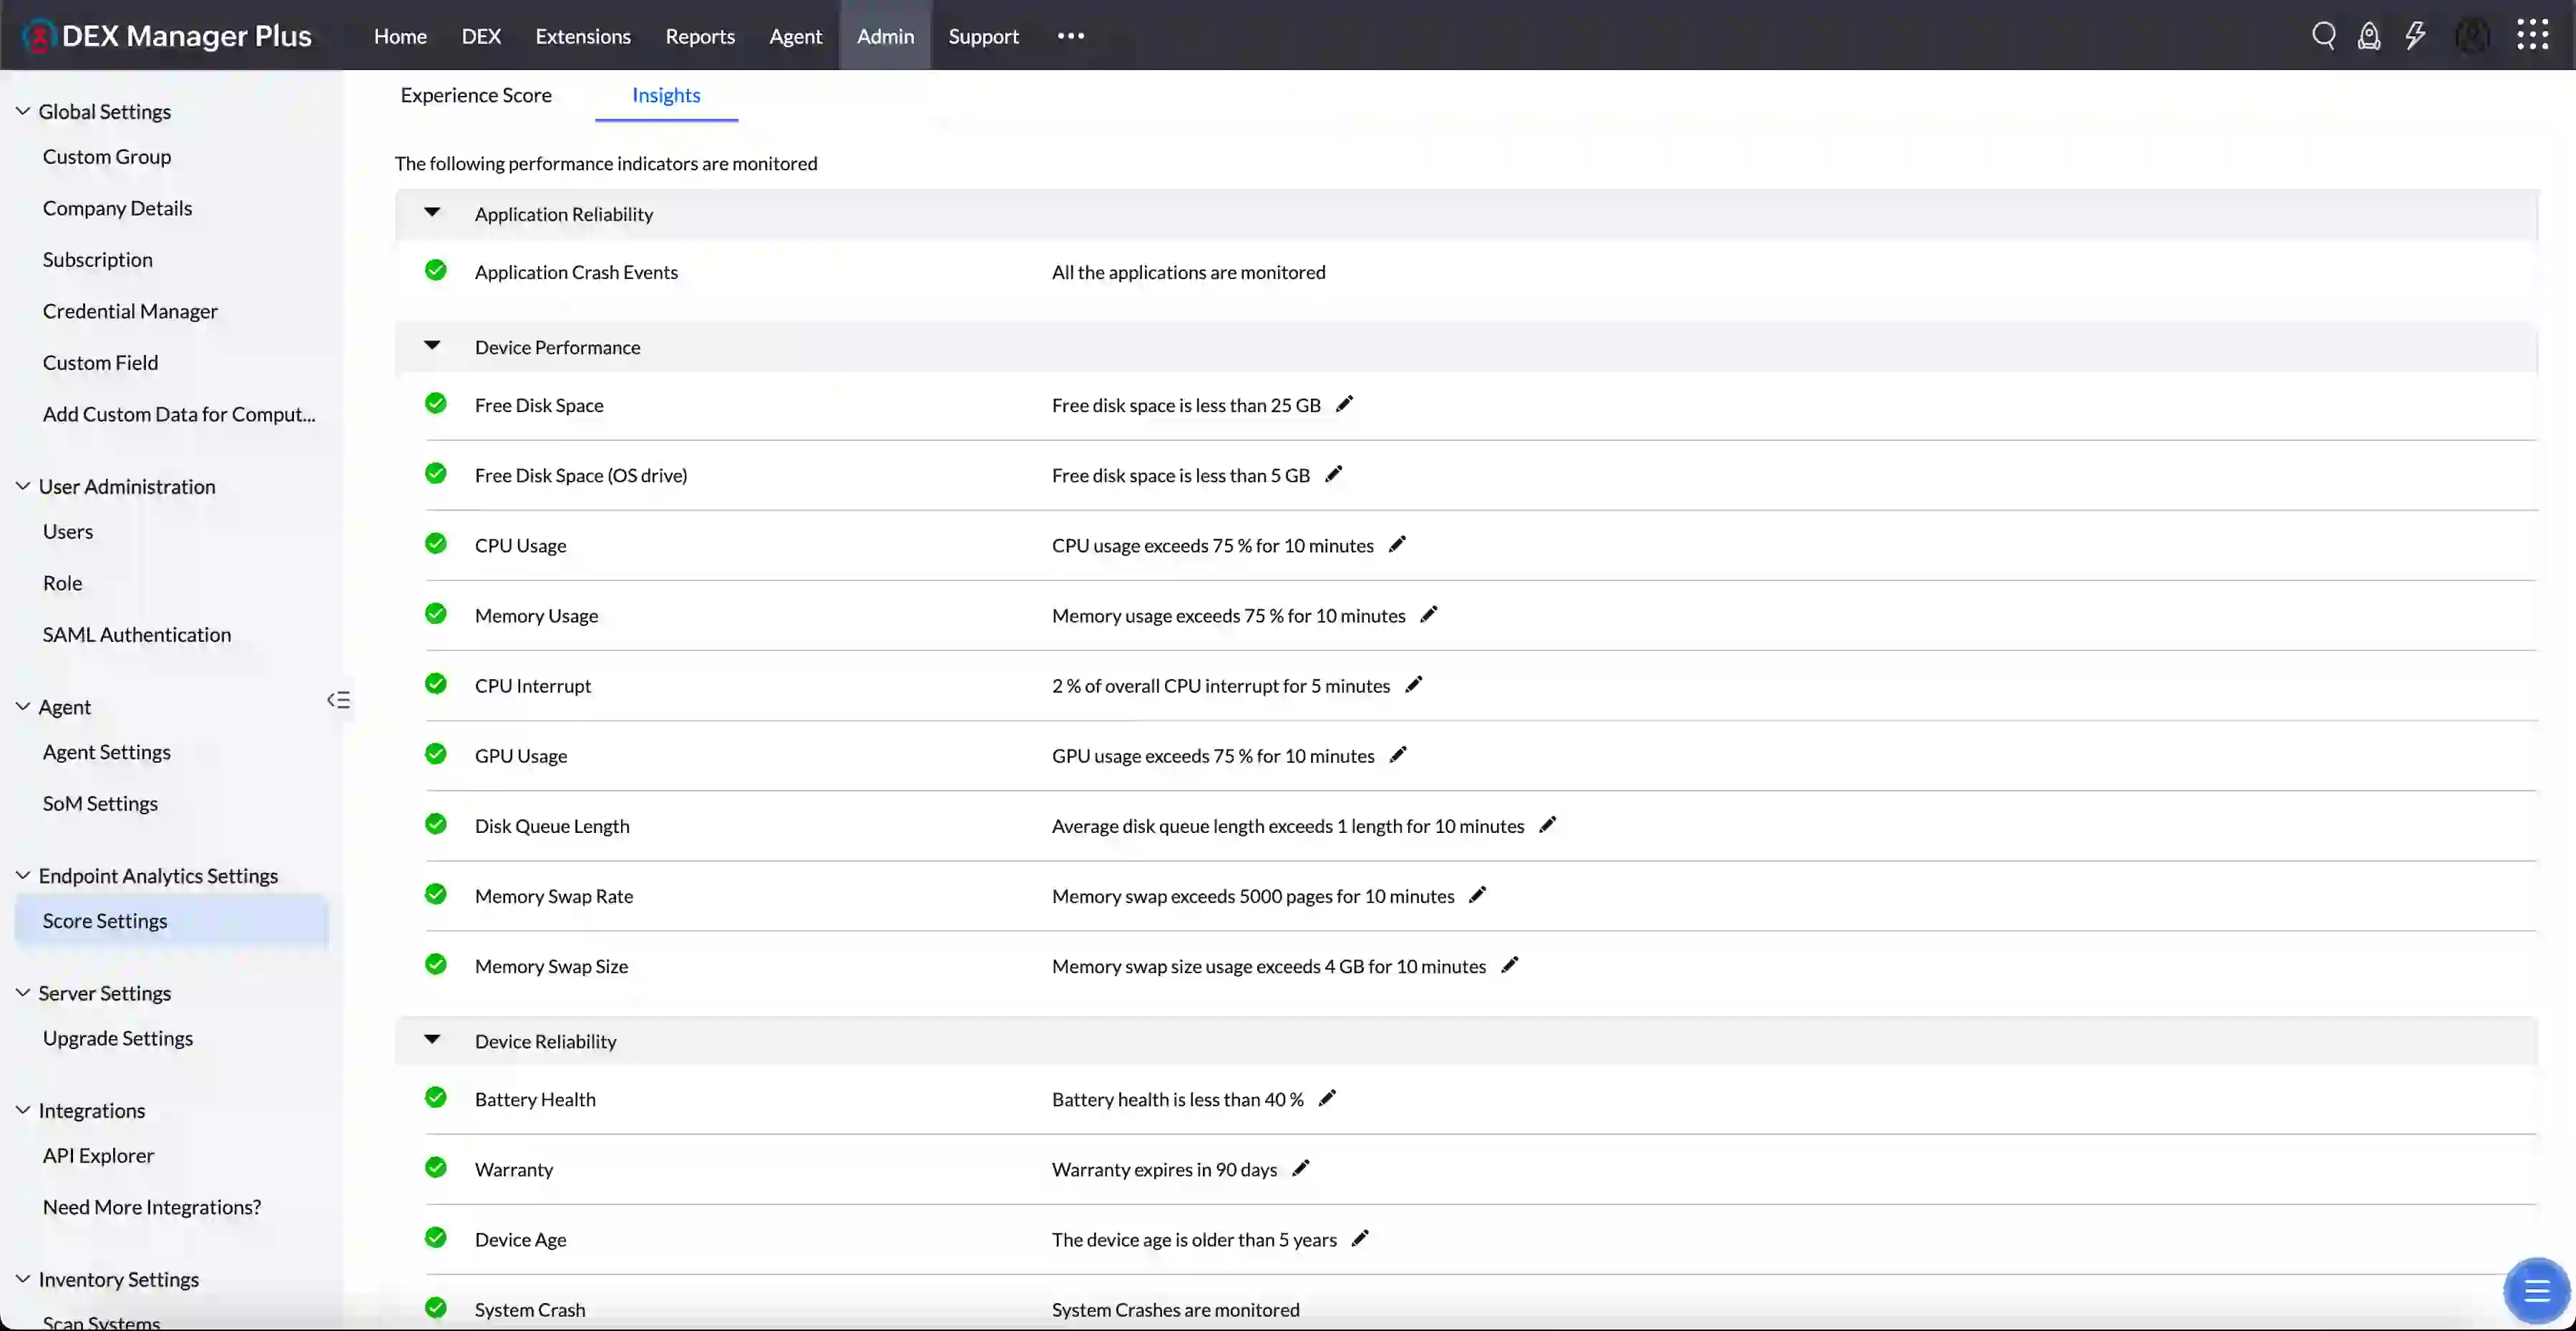
Insights are powered by a range of health indicators—such as CPU usage, disk space, battery health, or crash frequency. Each indicator has its own configurable threshold that determines when an insight is triggered.
To configure thresholds:
- Navigate to Admin > Endpoint Analytics Settings > Score Settings > Insights tab.
- Expand a metric category (e.g., Device Performance).
- Click the pencil icon beside the metric you want to adjust.
- Enter the desired threshold value and observation period (e.g., “CPU > 70% for 5 minutes”).
- Click Save.

Next Steps for Each Insight
- Click an insight to open affected device list.
- Review most common factor for the generated insight using Troubleshoot.
- Trigger remediation via automation workflows to fix the insights.
After a department-wide software rollout, IT notices a spike in devices showing the insight: "High Memory Usage is detected "
- Using Insights, the admin filters affected devices and links the issue to a specific update.
- A workflow is triggered to deploy stable software to those impacted devices.
- Issue is proactively remediated and user experience is improved


 Yes
Yes