IPAM unified view for Microsoft Windows
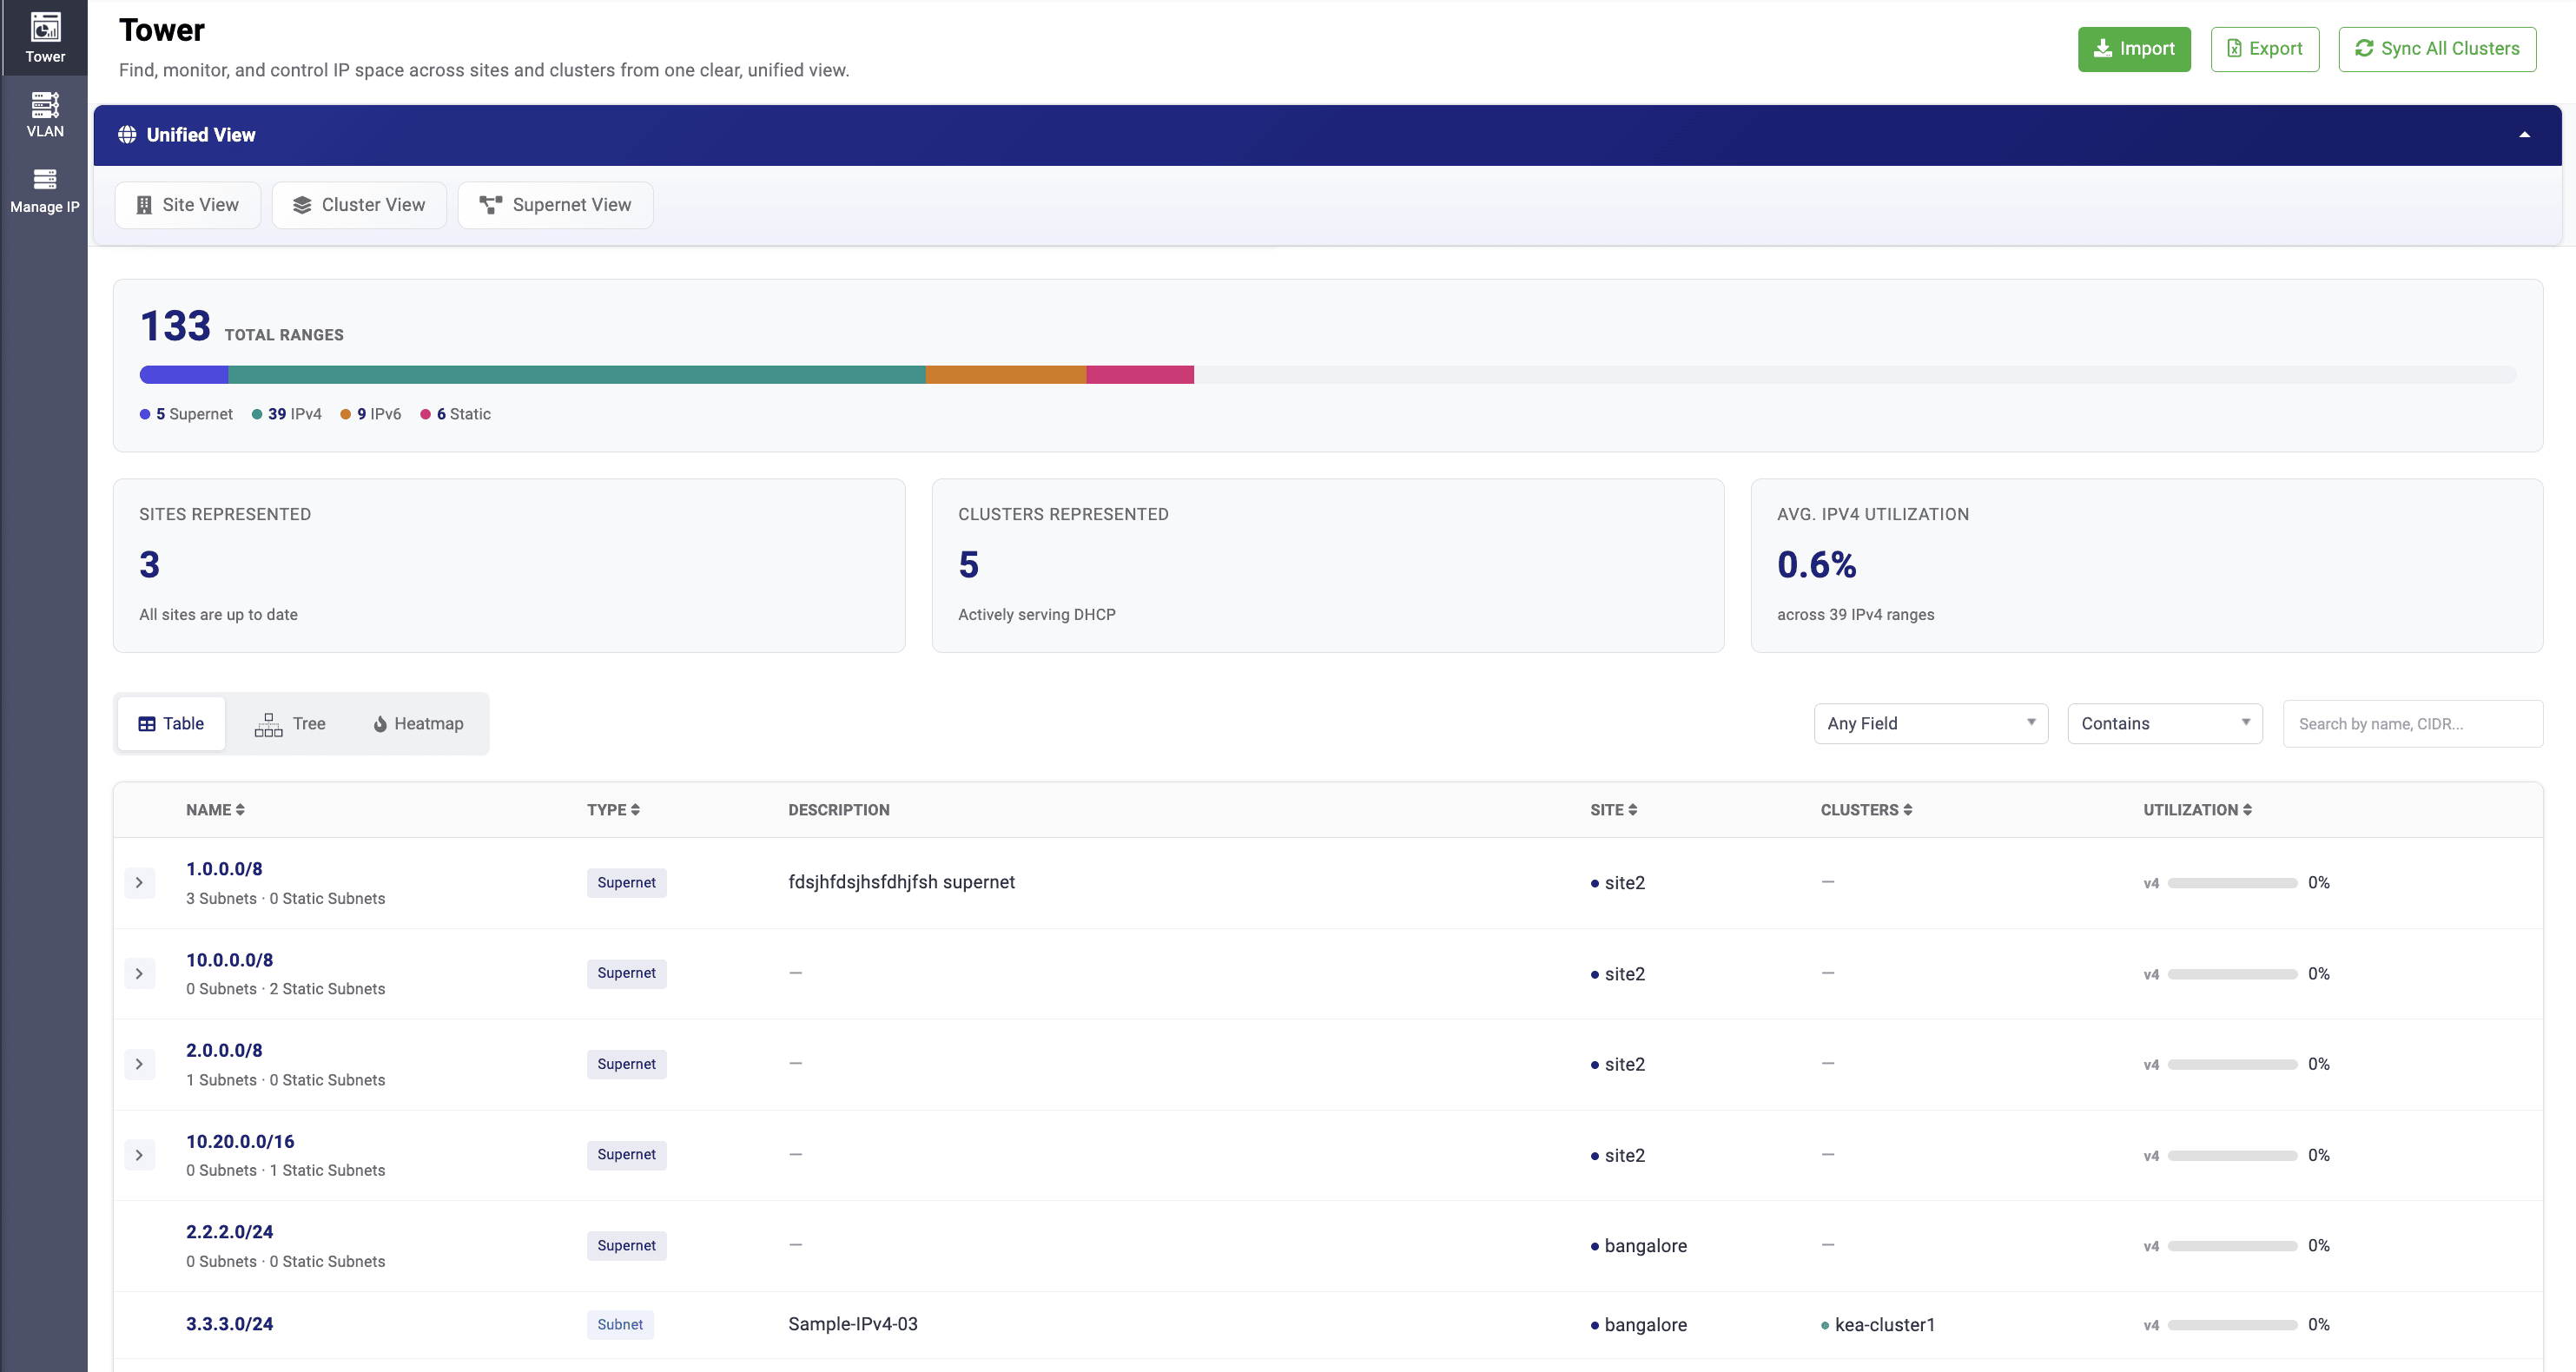
The IPAM Tower organizes network resources into three lenses: Site View, Cluster View, and Supernet View. During day-to-day management, viewing resources through one of these lenses is usually enough. But during an incident, when every minute matters, switching between views to track down an issue is a bottleneck.
The Unified View removes that bottleneck by consolidating data from all sites, clusters, and supernets into a single dashboard. Administrators get a network-wide picture without leaving the page, and can still drill down into individual sites, clusters, or supernets when needed.
Summary cards
At the top of the Unified View, summary cards give an at-a-glance status of the network:
- Total Ranges: the combined count of supernets, IPv4 subnets, IPv6 subnets, and static subnets across the network, with a proportional breakdown bar.
- Sites Represented: the number of sites contributing data to this view.
- Clusters Represented: the number of clusters actively serving DHCP.
- Avg. IPv4 Utilization: the average utilization across all IPv4 ranges in the network.
Field-based search
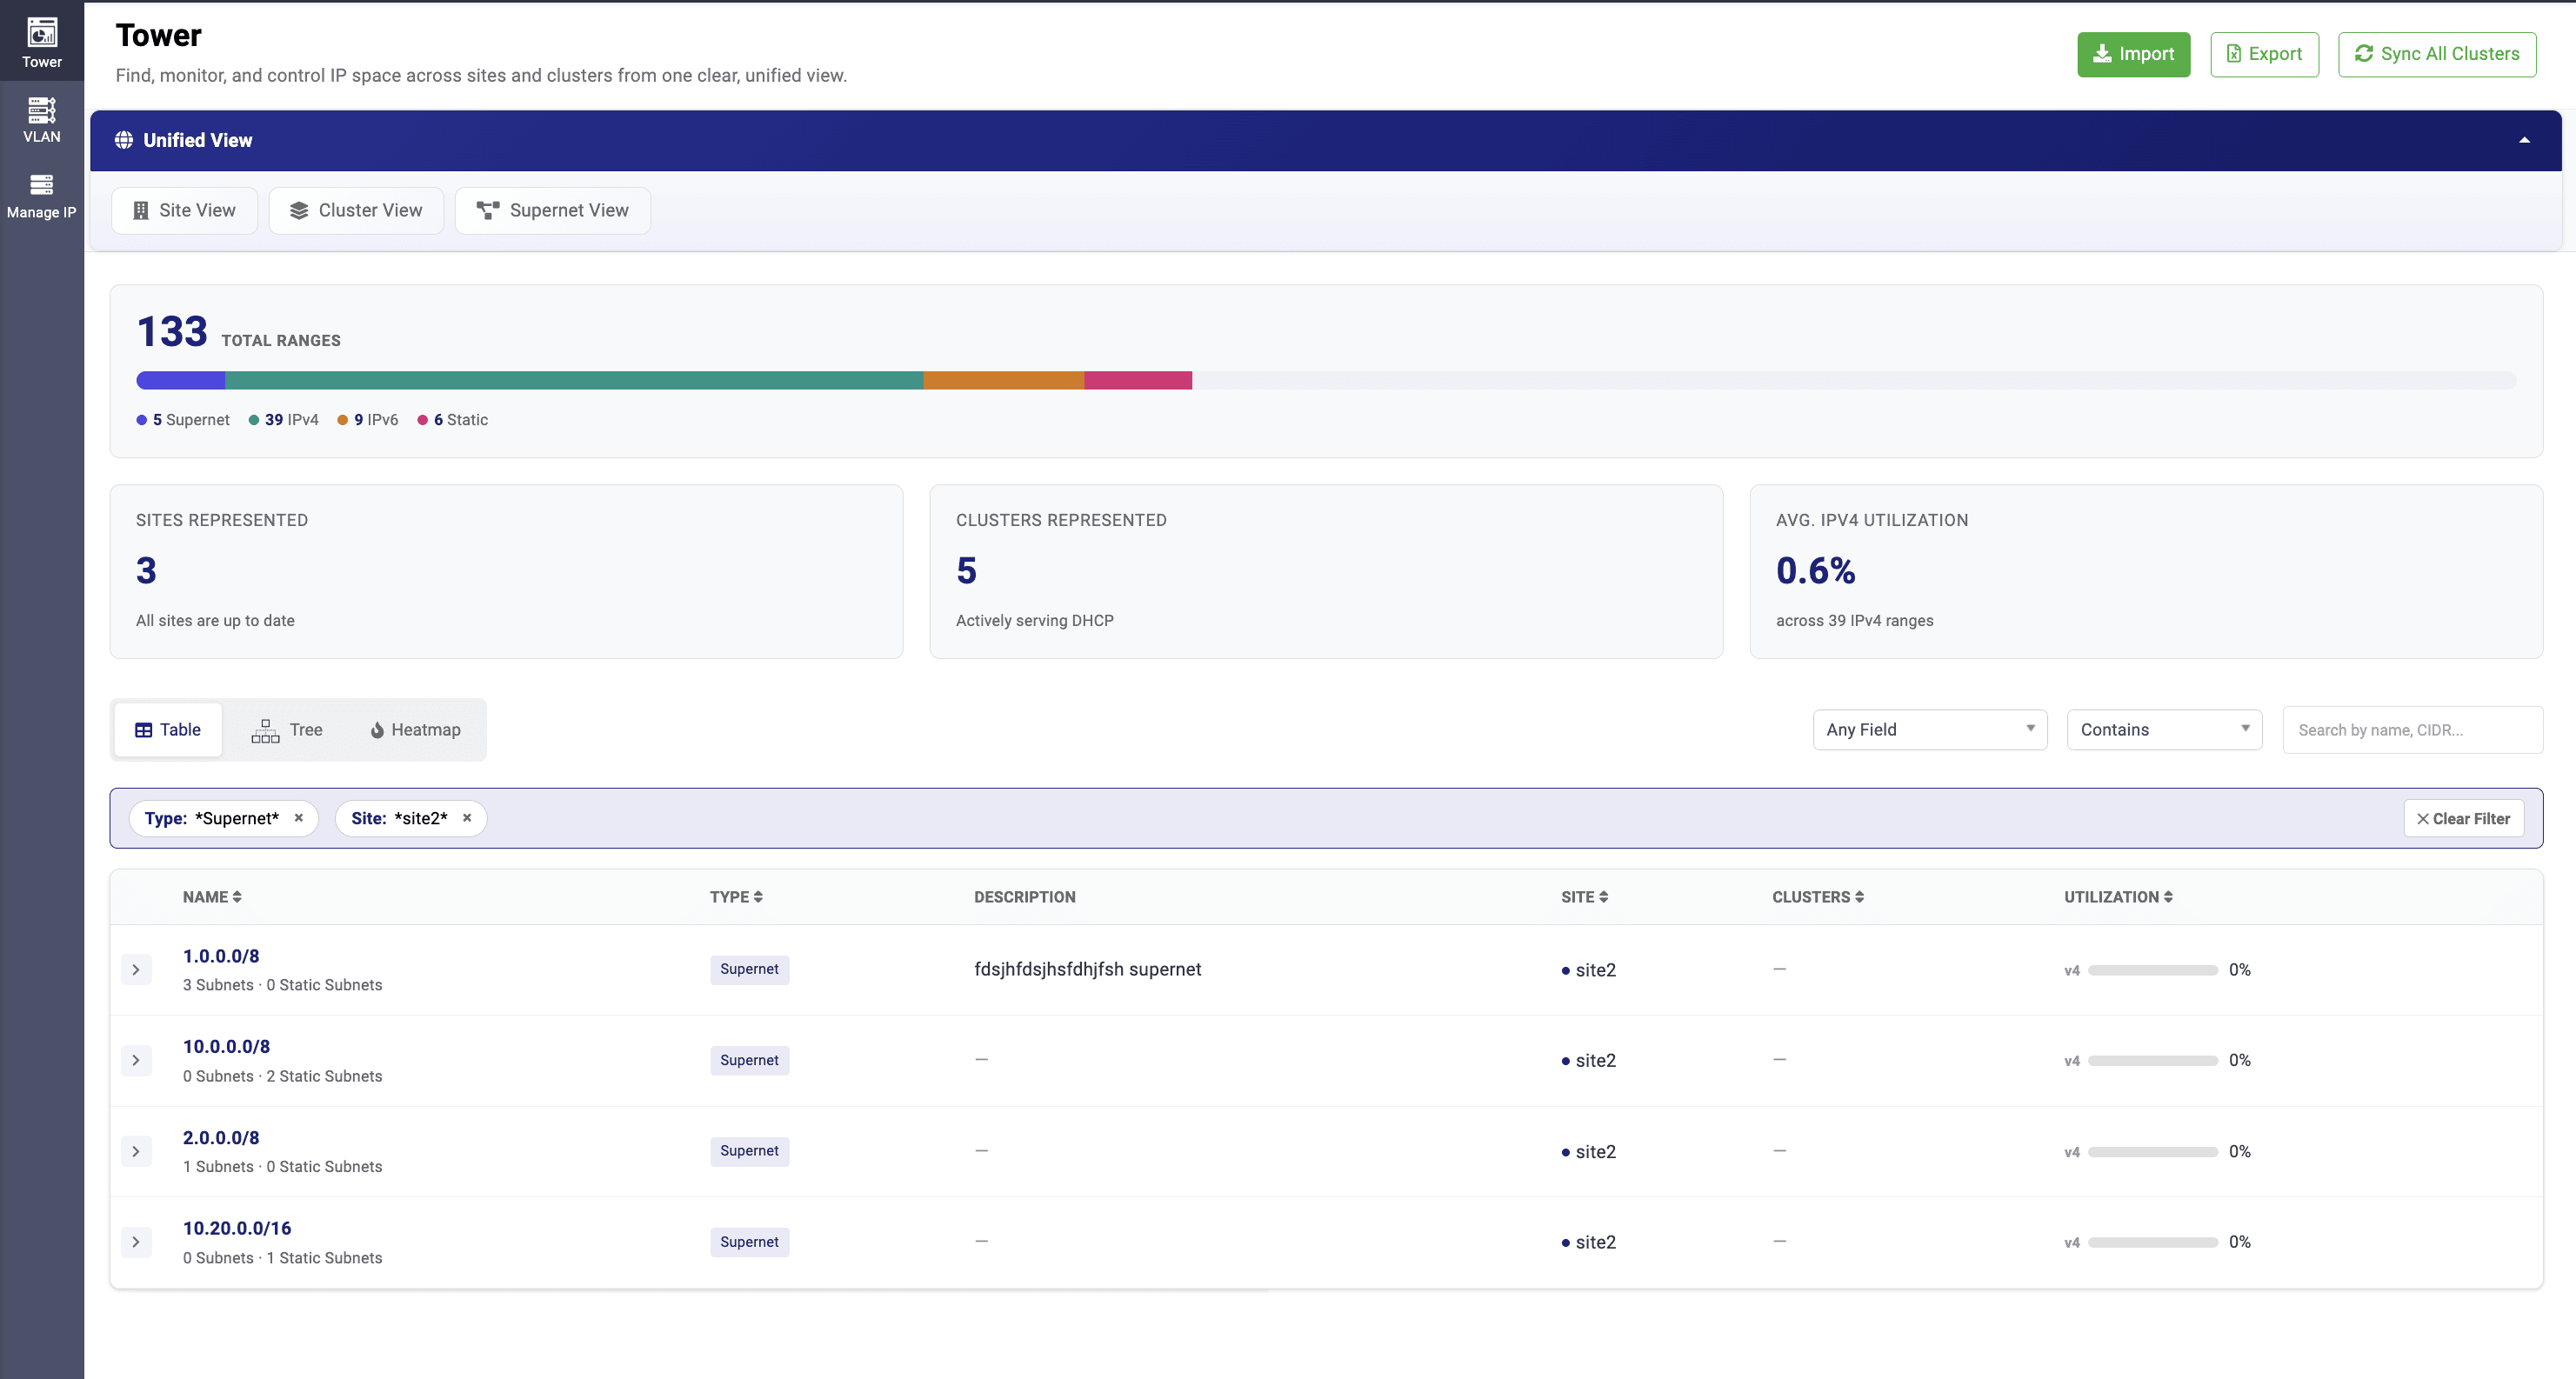
Administrators can narrow results using field-based search: select a field (Name, Type, Description, Site, etc.), choose a match condition, and enter a value. Multiple field searches can be applied together and appear as removable filter chips above the results, so admins can combine criteria — for example, Type: Supernet and Site: site2 — to quickly isolate the resources they need. Filters can be removed individually or cleared all at once.
View options
The Unified View offers three ways to visualize network data: Table, Tree, and Heatmap. Unlike the individual Site, Cluster, and Supernet views — which offer a Card view — the Unified View replaces Card view with Heatmap, since a network-wide view benefits more from spotting utilization patterns at a glance than from browsing individual cards.
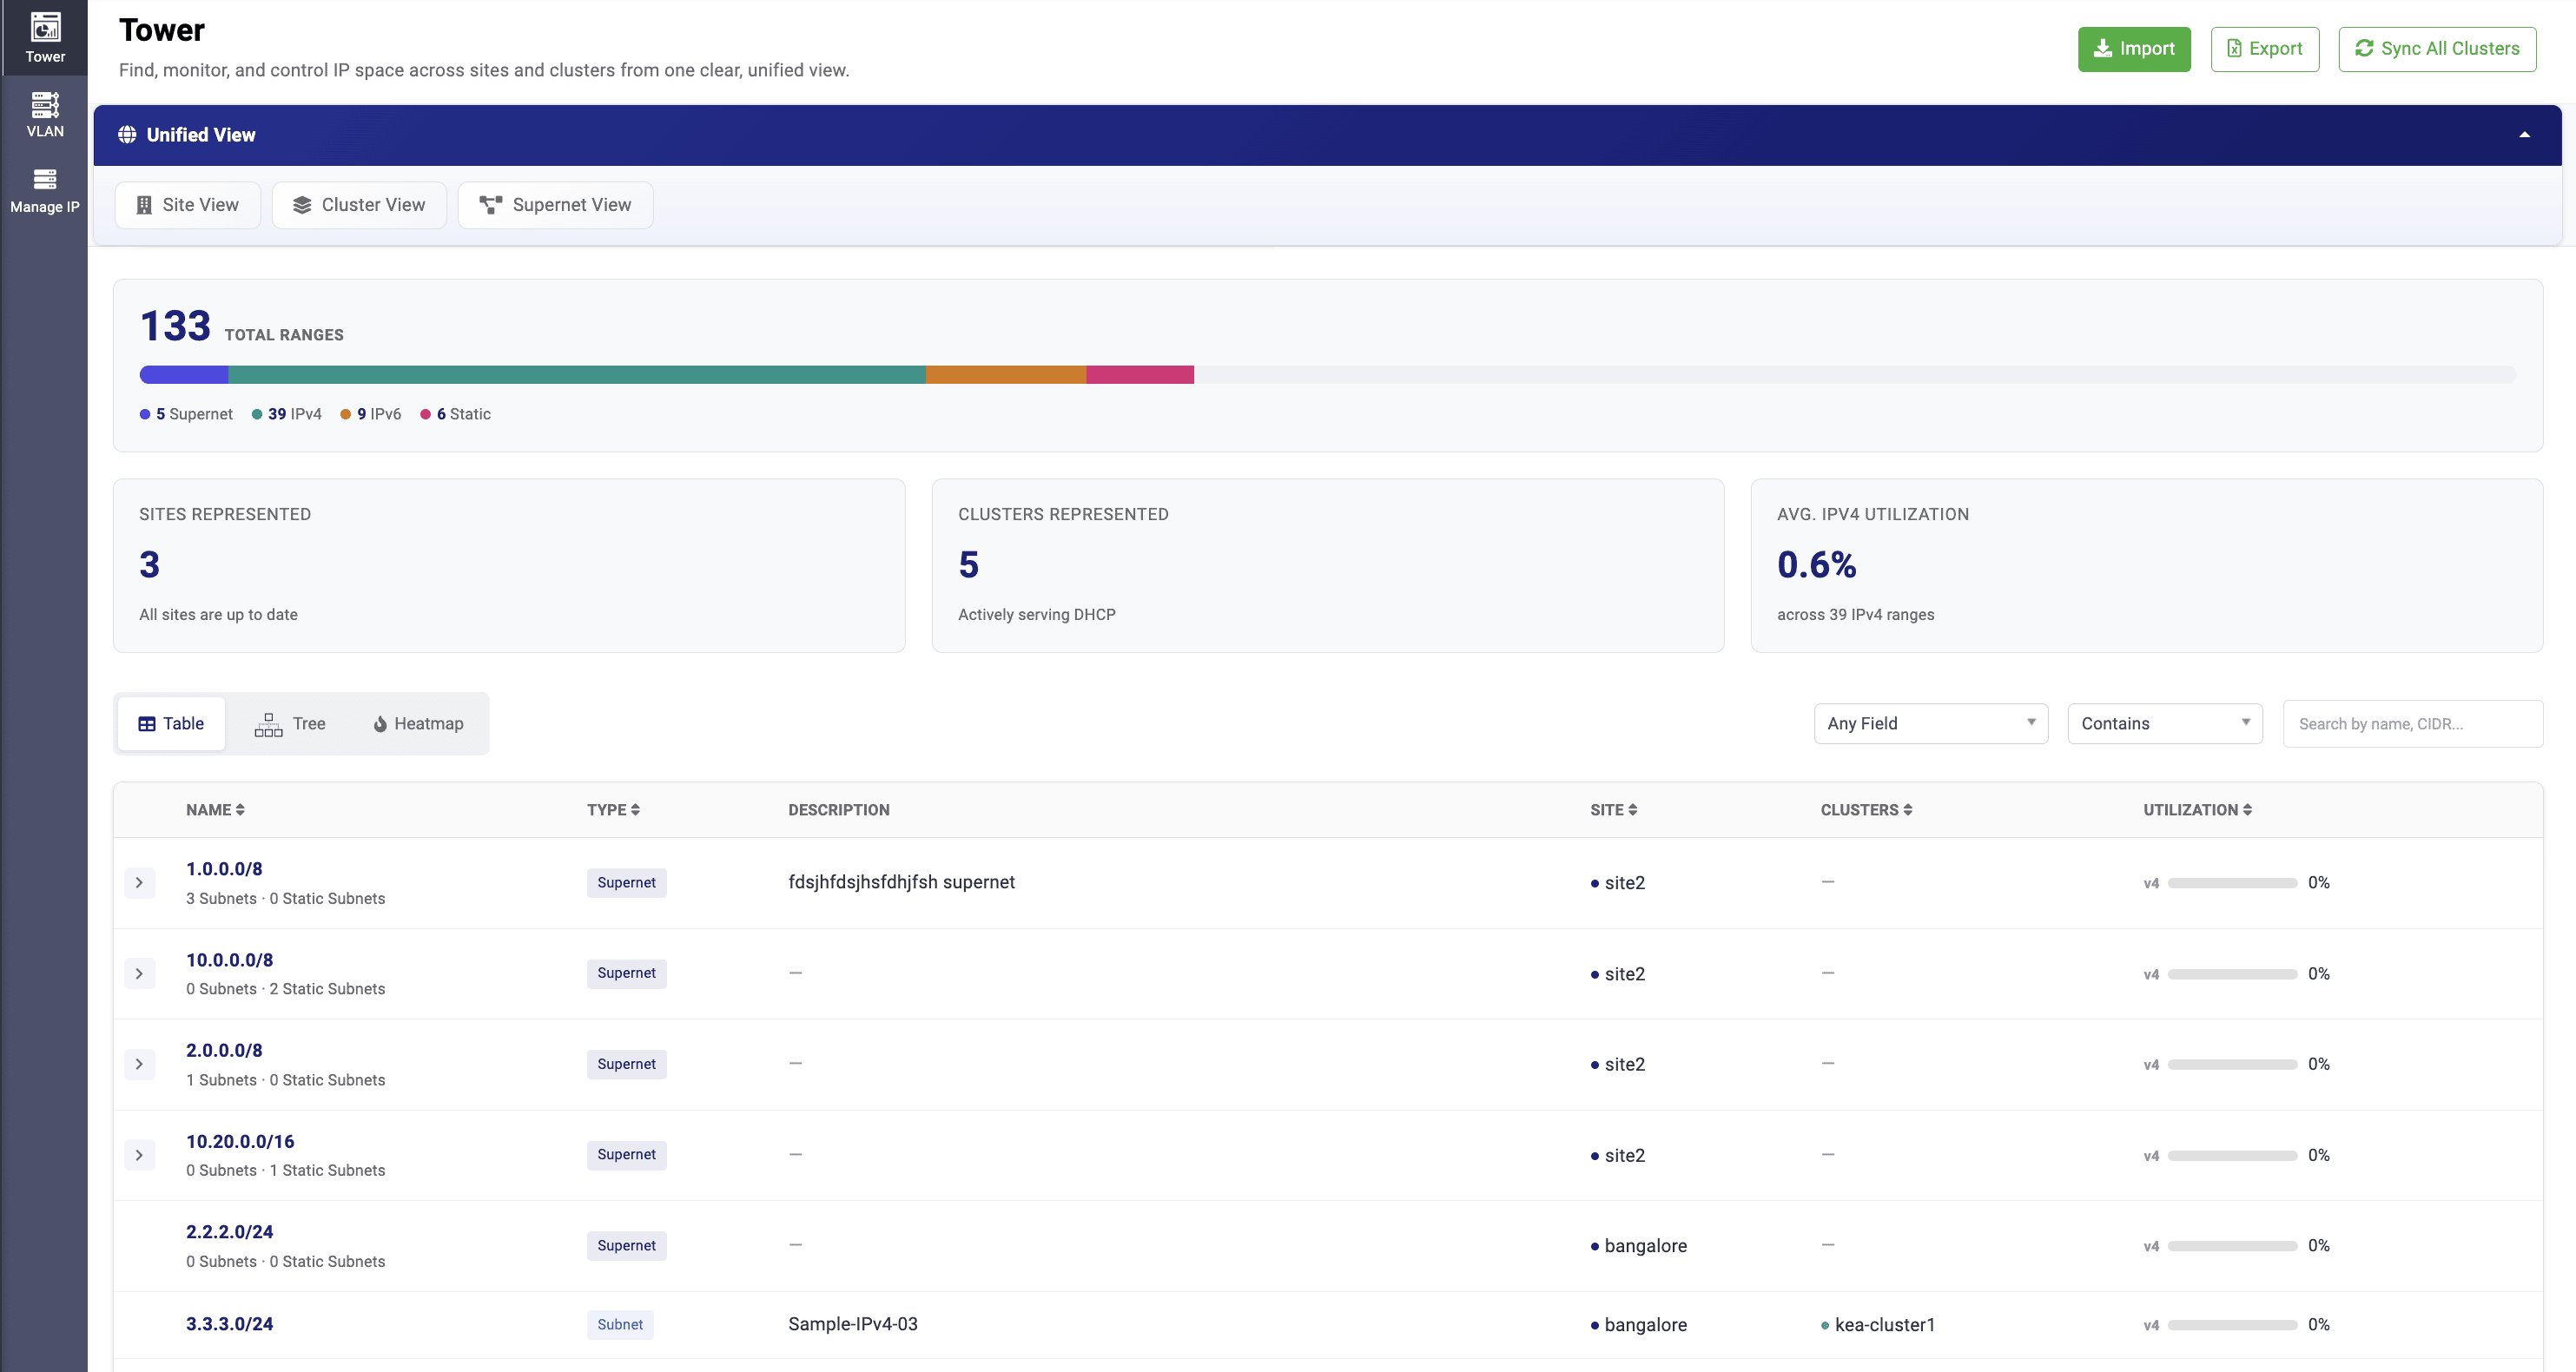
The Table View lists every supernet, subnet, static subnet, and IPv6 range with its type, description, site, associated clusters, and utilization. Columns are sortable, and rows can be expanded for more detail.
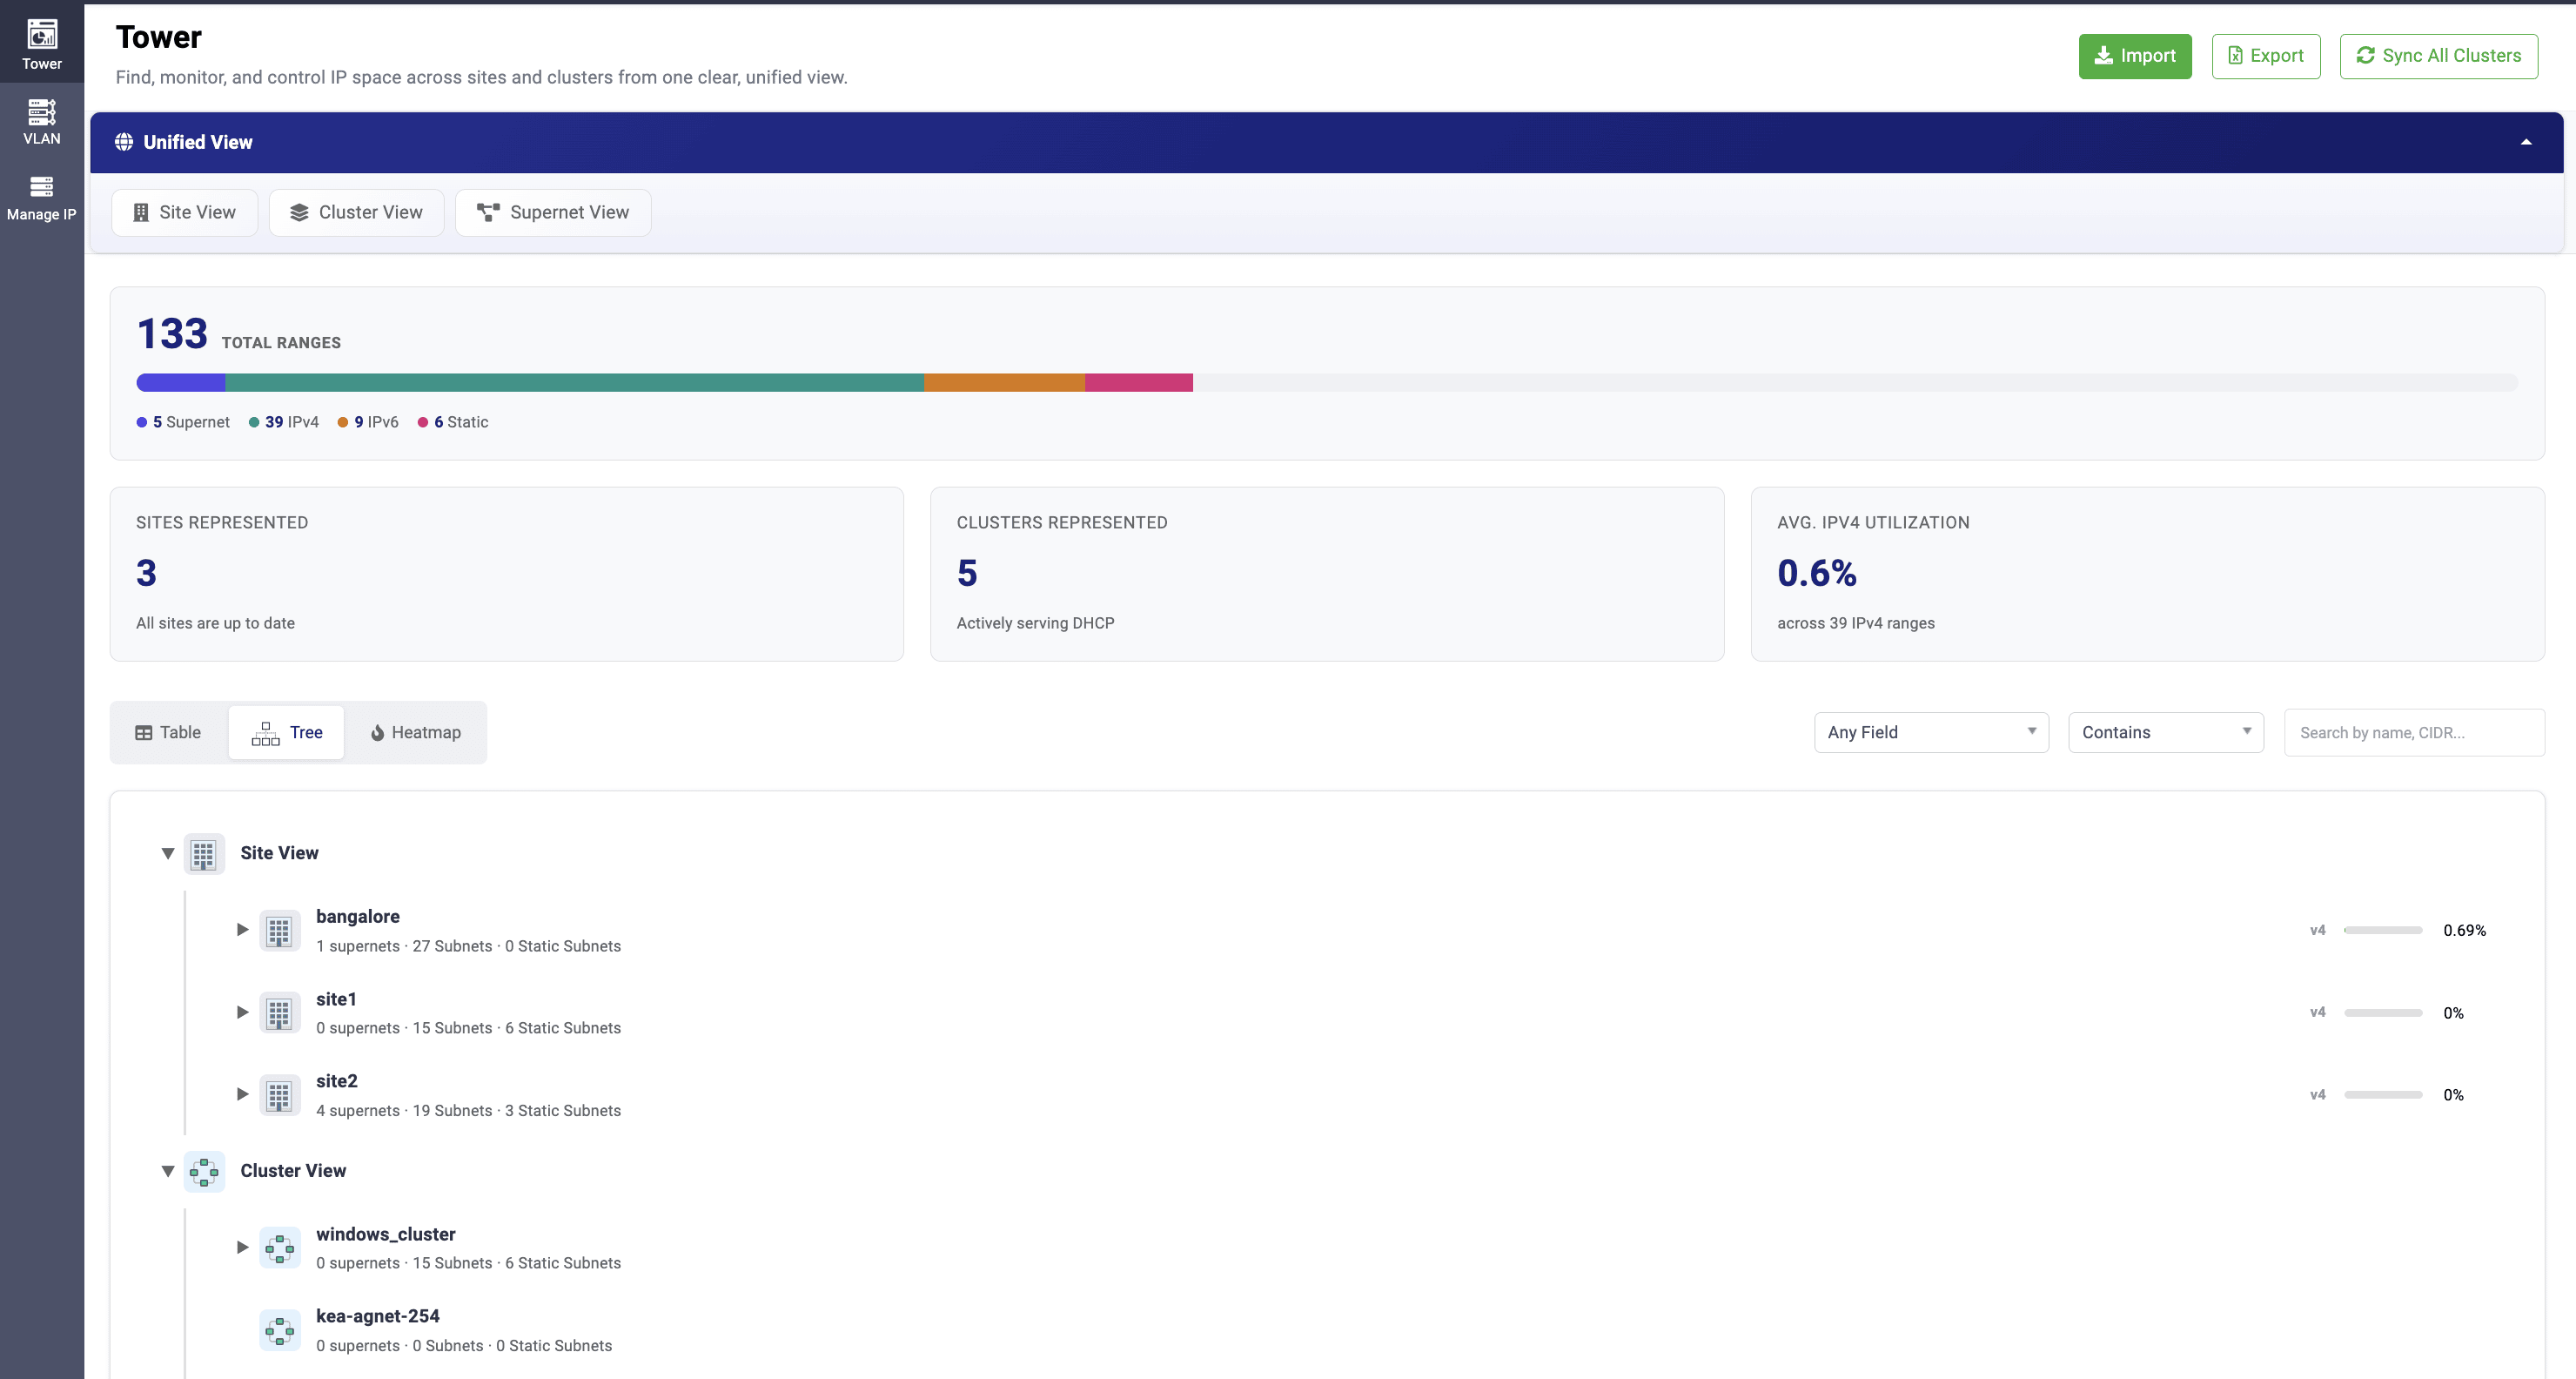
The Tree View presents the same data hierarchically, grouped first by Site View and Cluster View, with each site or cluster expandable to reveal its supernets, subnets, and static subnets — offering more structural context than the Table View.
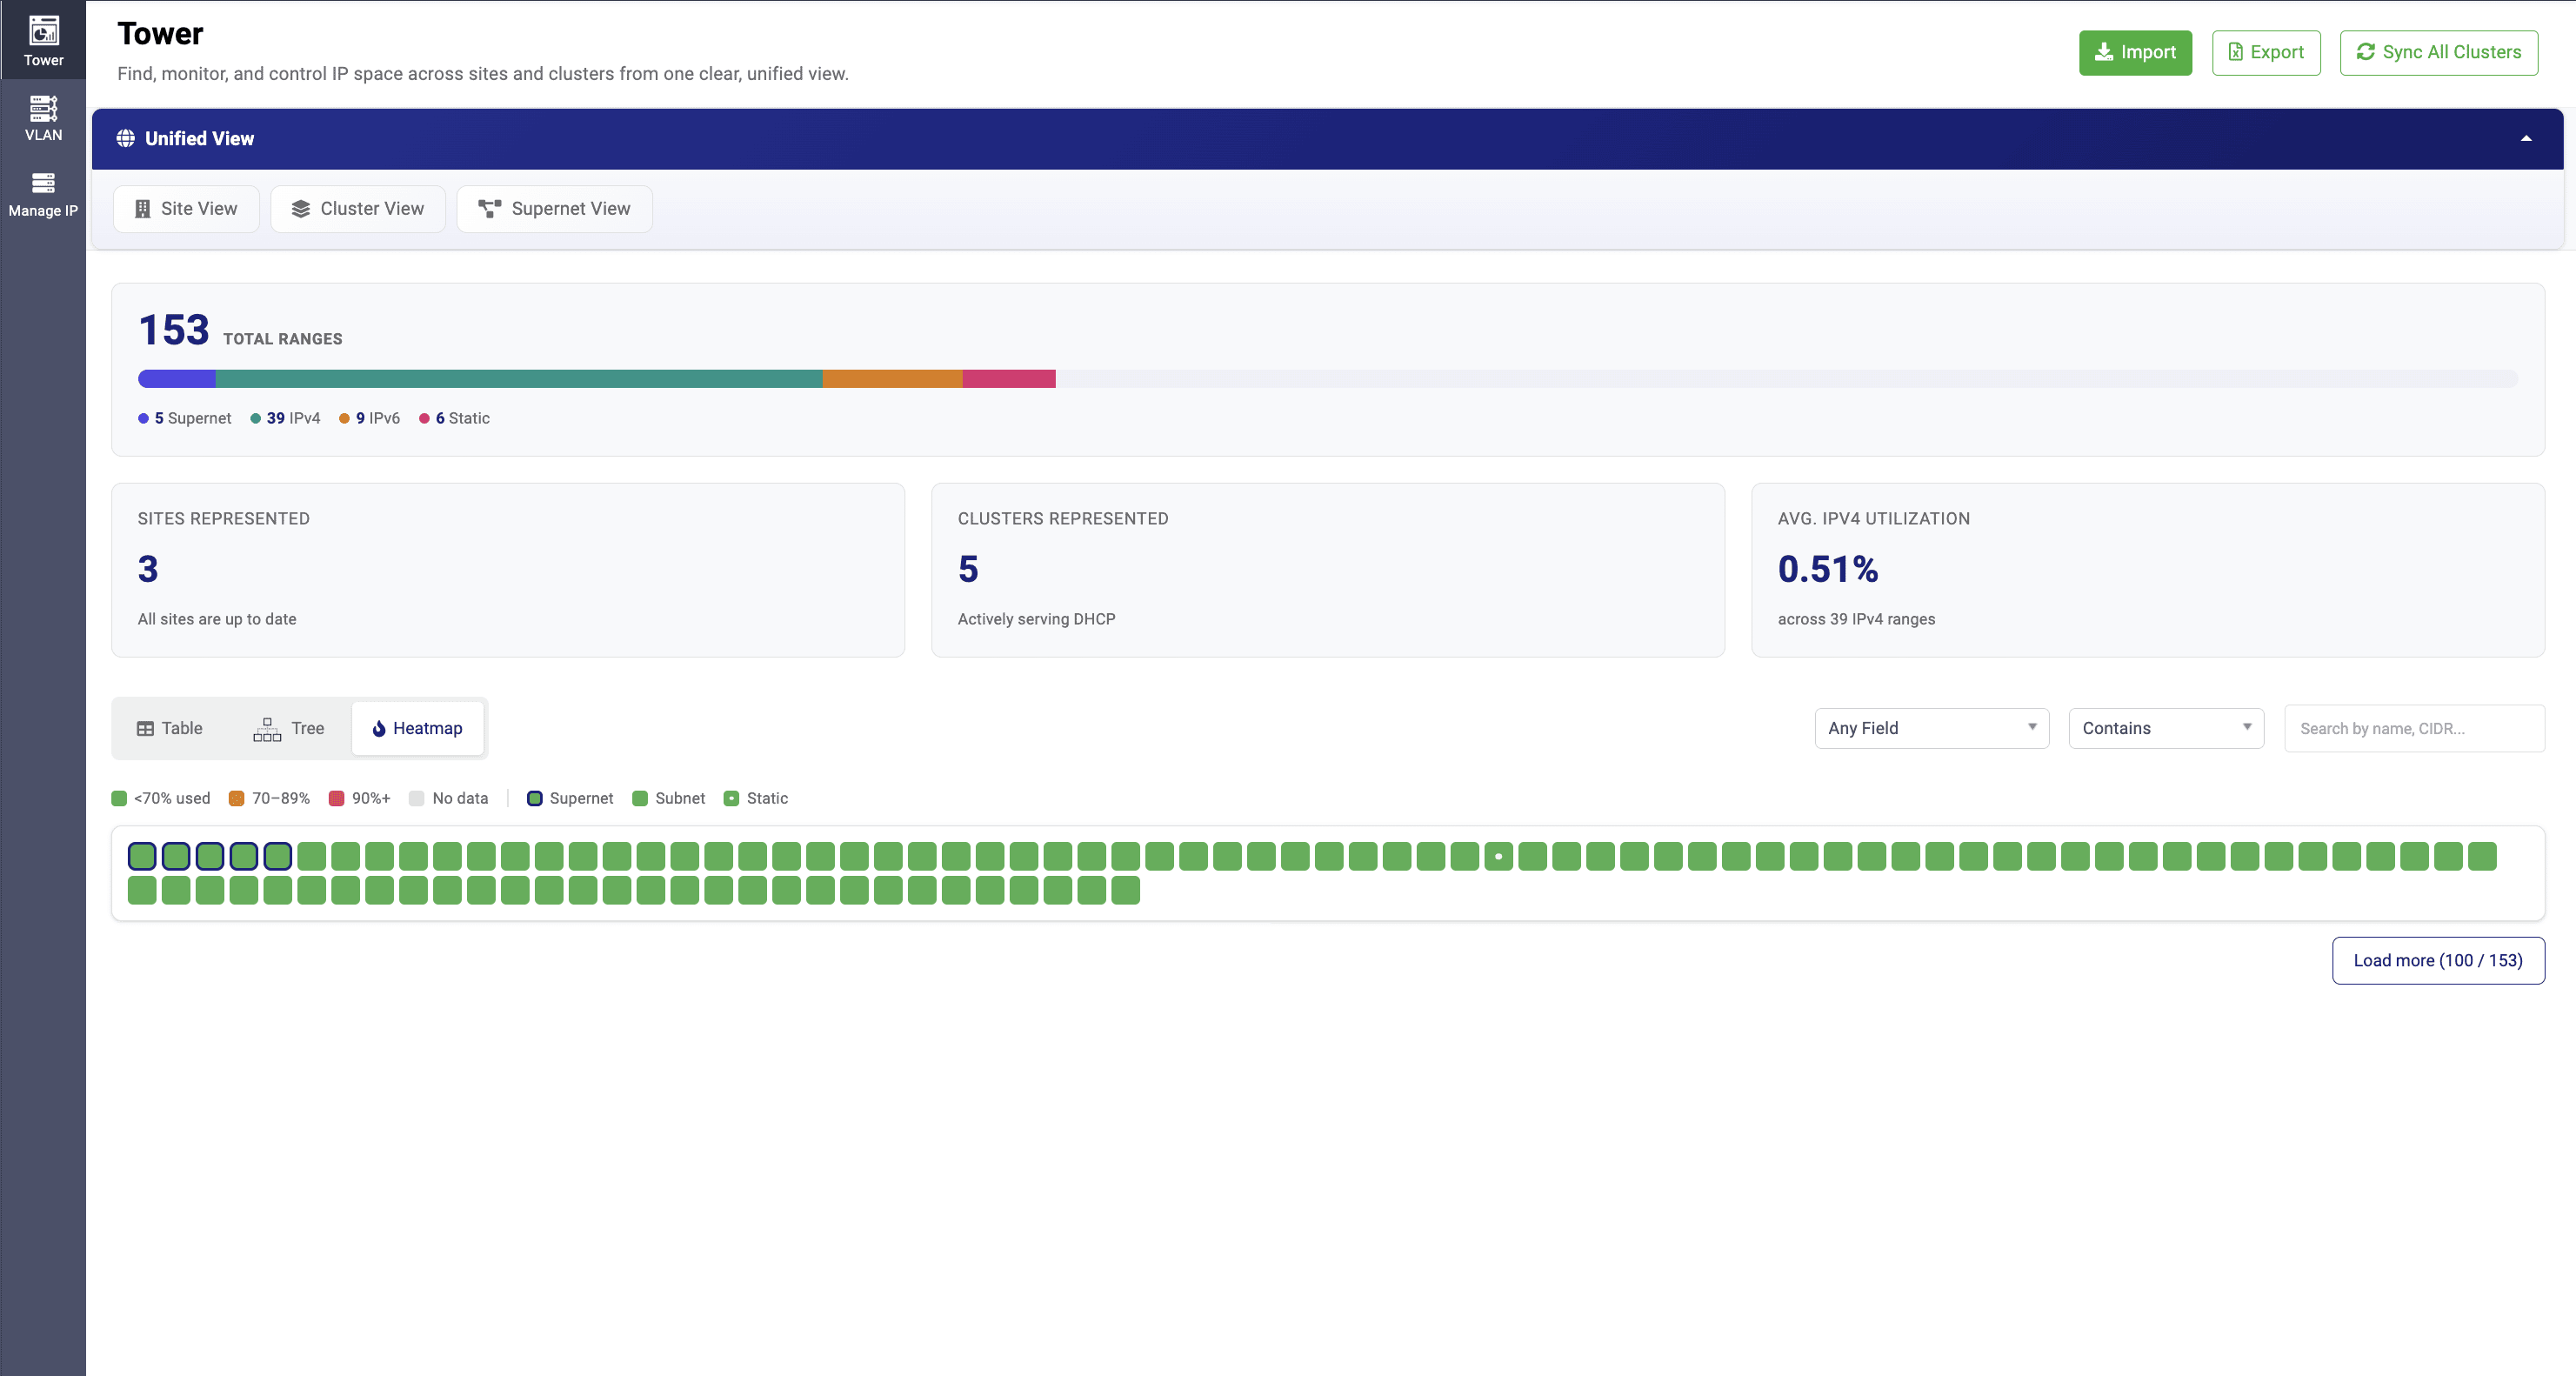
The Heatmap View gives a graphical, color-coded representation of utilization across all supernets, subnets, and static subnets in the network:
- Color indicates utilization: green for under 70% used, orange for 70—89%, red for 90% and above, and gray where no data is available.
- Border style distinguishes resource type: supernets, subnets, and static subnets each have a distinct visual marker.
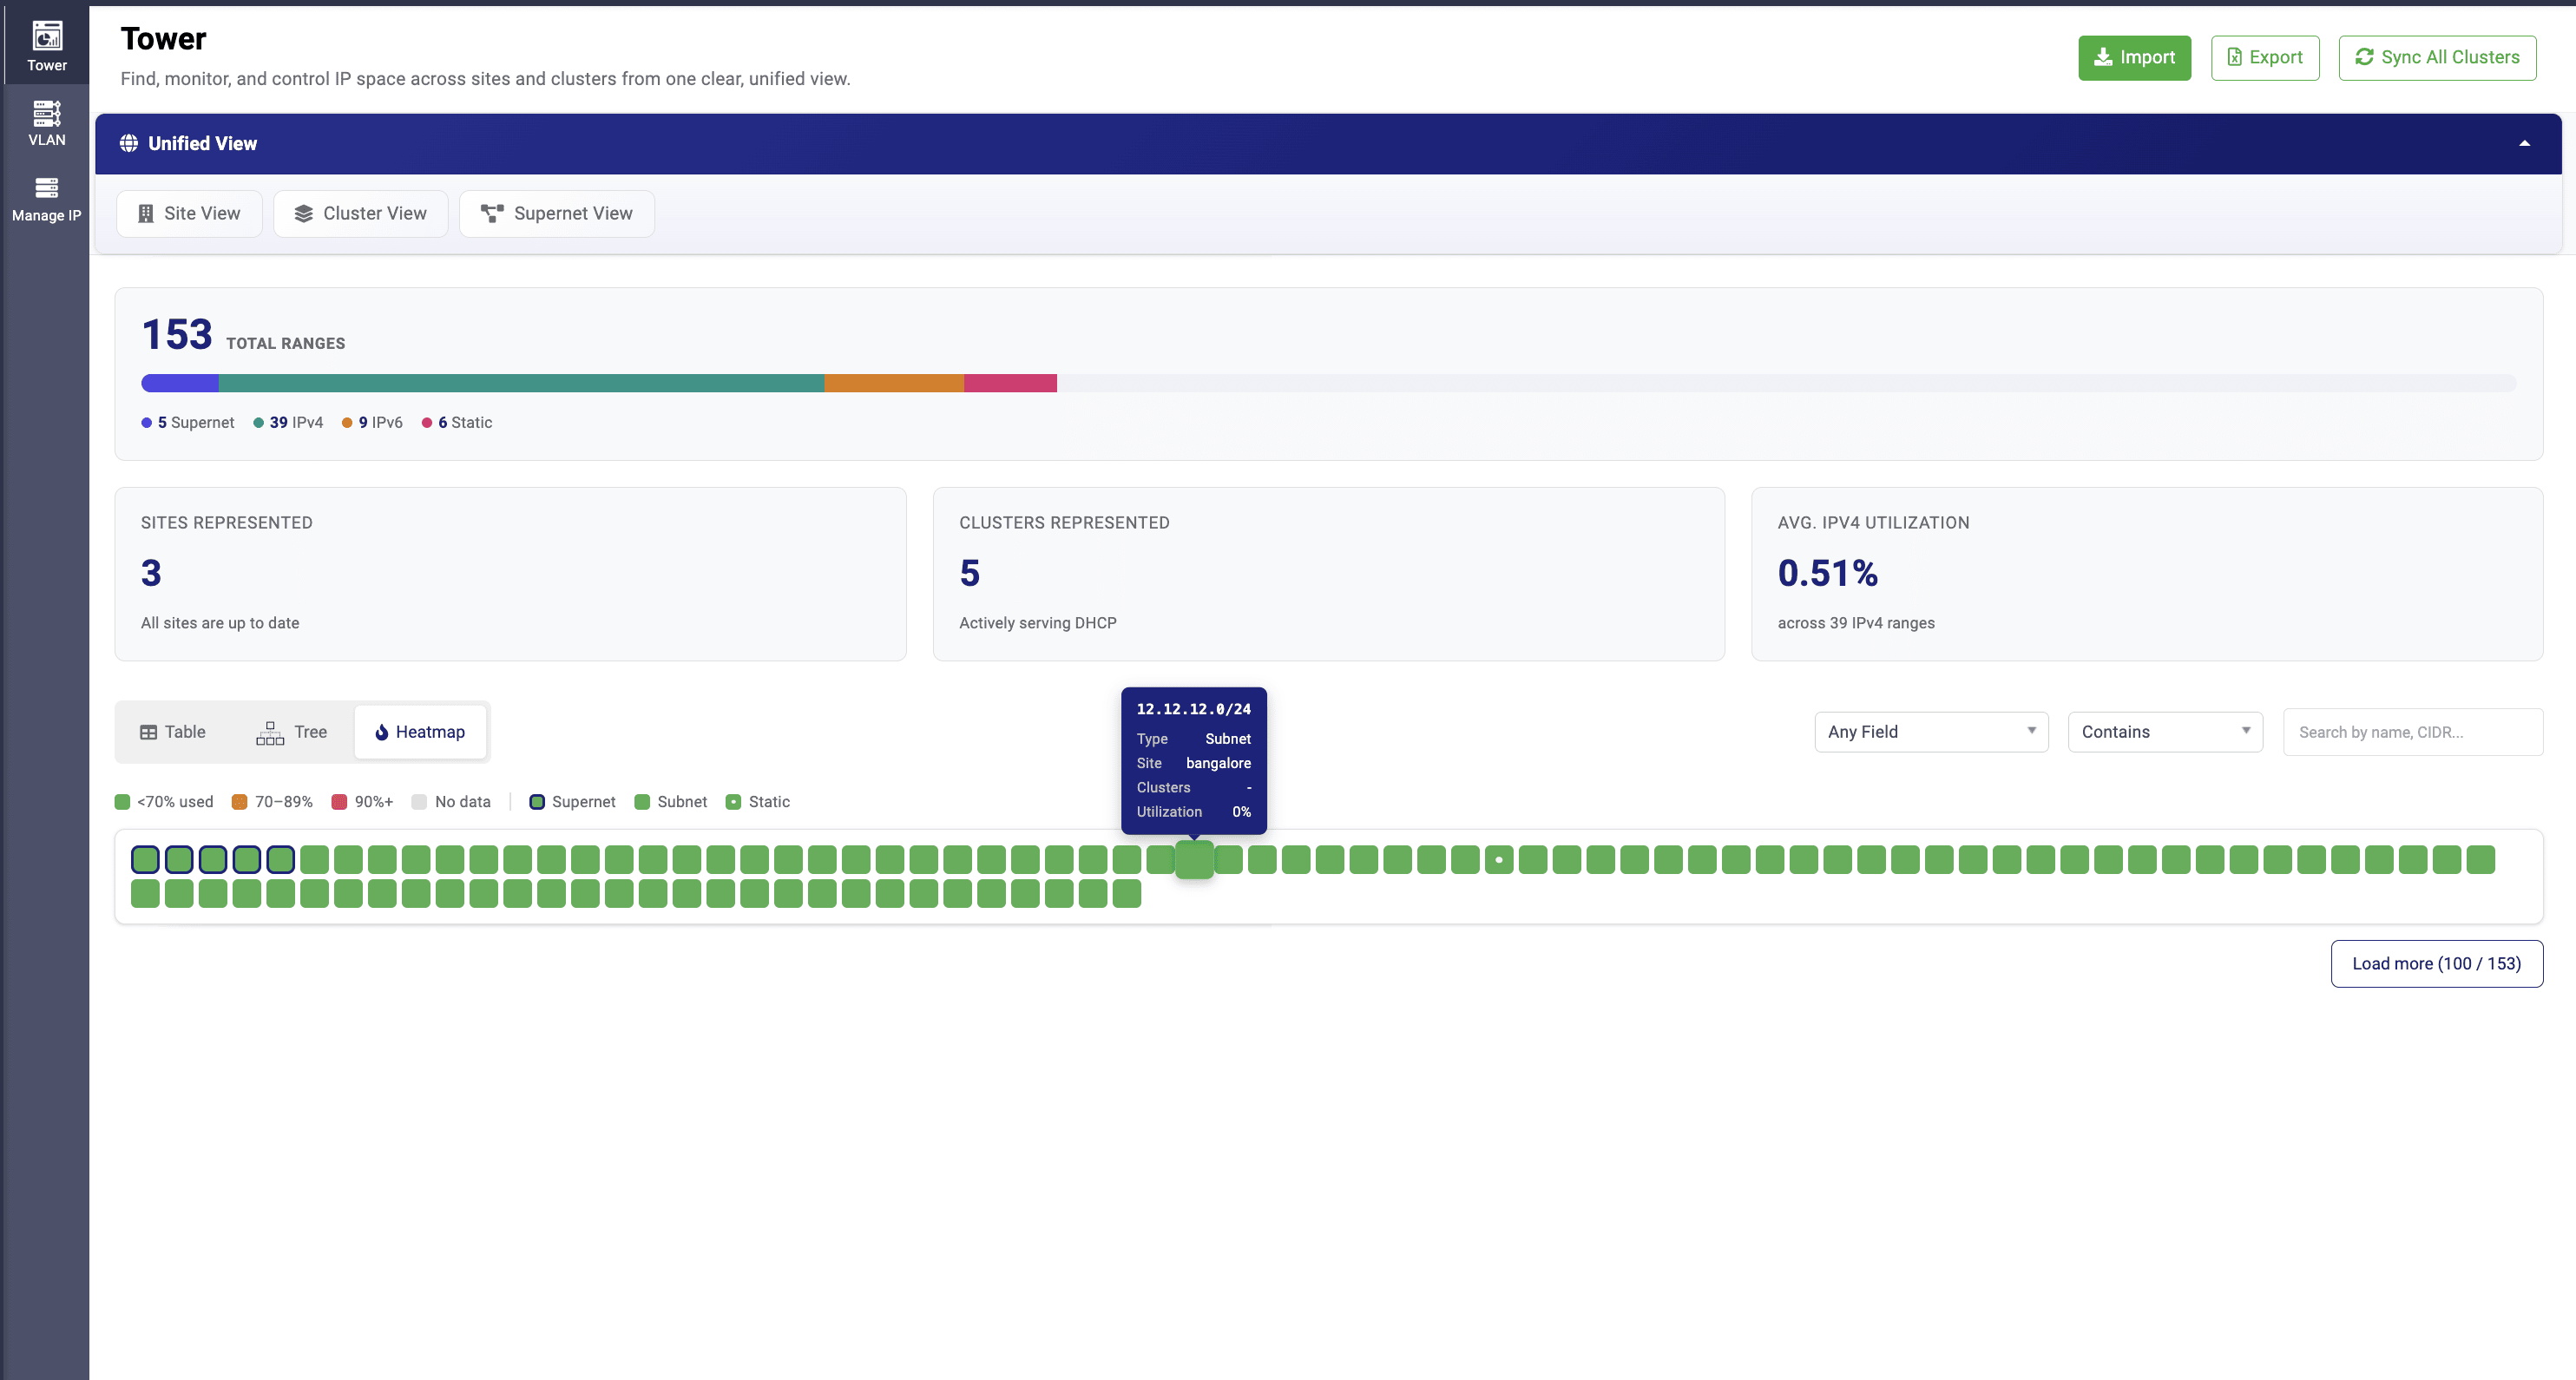
Hovering over any box shows details for that resource, including its type, site, associated clusters, and utilization. Since a network can contain far more ranges than fit on one screen, the Heatmap loads an initial batch of resources with a Load more option to bring in the rest.
Import, export, and sync
The Unified View also provides quick actions for managing IPAM data at the network level:
- Import: bring in existing IPAM data from a CSV file.
- Export: download the current IPAM data shown in this dashboard as a CSV file.
- Sync All Clusters: refresh data across all clusters to reflect their current, up-to-date state.