Integrating with PRTG
Analytics Plus integrates with PRTG, enabling you to import and analyze your network monitoring data through powerful dashboards and reports. With this integration, you can generate detailed insights on device availability, sensor performance, bandwidth usage, alerts, and historical trends to make data-driven decisions and optimize network performance.
General
Setup
How long should I wait for my PRTG data to appear in Analytics Plus initially?
Can I set up the PRTG integration in existing workspaces of Analytics Plus?
Reporting Features
Can I modify the pre-built reports that are offered as part of the PRTG integration?
How do I create reports using fields/columns across different PRTG modules?
Can I combine data from other sources with the data from PRTG and create reports and dashboards?
Sharing & Collaboration
How do I share reports, dashboards, and tables in Analytics Plus?
Why are my colleagues unable to access the reports I create?
Can other users create reports using the tables in the PRTG workspace?
Is it possible to share the same report to multiple users so that they each see different data?
How do I print the reports and dashboards created in Analytics Plus?
Help & Support
General
Analytics Plus is a self-service business intelligence and analytics software that empowers you to transform complex IT data into actionable insights without the data scientists. It allows you to create intuitive reports and dashboards and collaborate with the team for informed decision-making.
Analytics Plus offers the following important capabilities:
Import data from local files, web feeds, local and cloud databases, and cloud storage/drive.
Displays data in an easy-to-view excel format.
Build custom reports and dashboards easily with the drag-and-drop report builder.
Visualize the reports in the form of charts, pivot tables, summary views, and tabular views.
Organize and showcase the reports on dashboards along with KPIs.
Bring out the hidden insights in your data in seconds with Zia, Analytics Plus' intelligent analytics assistant powered by Machine Learning and Artificial Intelligence.
Create custom formulas using the built in formula engine that contains a wide range of mathematical, statistical, and logical functions.
Share reports and dashboards with your colleagues easily, through a wide range of collaboration features.
Export and publish reports and dashboards in various formats, and configure permissions and filters for the views.
Supports out-of-the-box integrations with a wide number of applications to give you pre-built reports and dashboards on your application's data within minutes.
2. What are the highlights of this integration?
The integration of PRTG Network Monitor with Analytics Plus enables organizations to combine real-time network monitoring with advanced data analytics. This integration helps optimize network performance and proactively address potential issues. Once set up, key data from PRTG is synchronized with Analytics Plus, delivering the following benefits:
Visualize and analyze network performance metrics from PRTG in a unified dashboard.
Leverage predictive analytics to identify trends, detect anomalies, and forecast potential network failures.
Generate detailed reports on device status, uptime, bandwidth usage, and performance metrics.
Share real-time insights and reports across teams for faster decision-making and issue resolution.
Setup
1. How do I integrate Analytics Plus with PRTG?
Follow the steps in this presentation to integrate Analytics Plus with PRTG
2. How long should I wait for my PRTG data to appear in Analytics Plus initially?
After setting up the integration, you might have to wait some time for the initial fetch to complete. Depending on the amount of data in your application, the reports and dashboards might take up to five minutes to display all the metrics. If you access the workspace before the initial fetch, it will not display any data.
3. What should I do when the data synchronization fails?
The import or synchronization process of your PRTG data can sometimes fail if PRTG's credentials are changed, or if the application is moved to a different server. To resolve this, click the Data Sources option from the side panel and click the Re-Authenticate link. In the popup that appears, click Authenticate PRTG. Enter the Username, password and Access Token and click the Authenticate PRTG button.
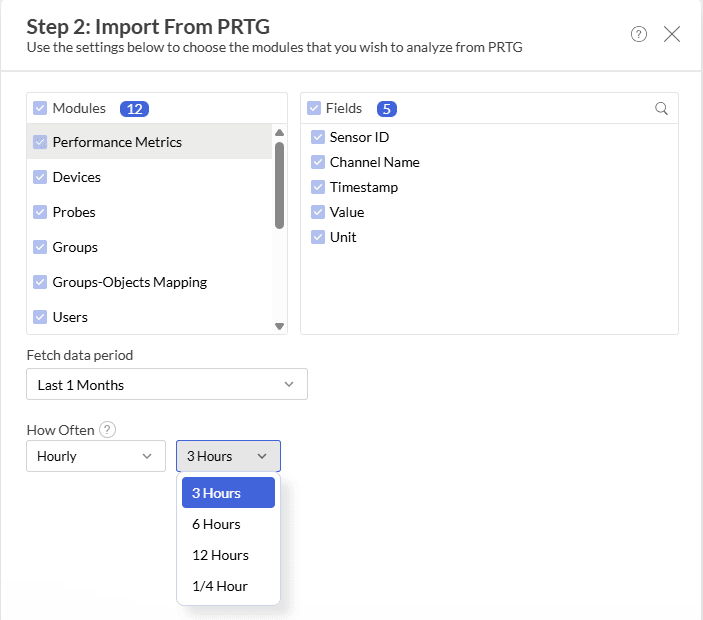
4. How frequently can I synchronize my data?
You will be able to synchronize your data daily.
1/4 hour
3 hours
6 hours
12 hours
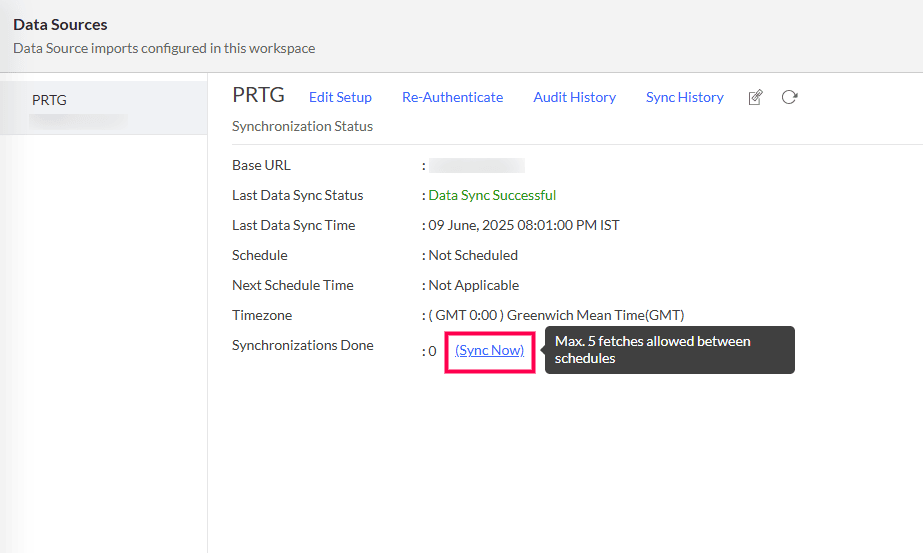
5. Can I edit the synchronization settings?
To edit the connection and synchronization settings, select Data Sources -> PRTG from the side panel.
The synchronization summary is displayed with the following data:
Last data sync status: Status of the most recent synchronization from PRTG.
Last data sync time: Time at which the most recent synchronization was completed.
Schedule: The frequency of data synchronization between Analytics Plus and PRTG.
Next Schedule time: Time at which the next data synchronization is scheduled to happen.
Manual Sync done: Number of times the data has been manually synchronized in a particular day.
6. Can I trigger a synchronization of my PRTG data on-demand?
Yes. To do this, select Data Sources -> PRTG from the side panel. In the Data Sources page that appears, click Sync Now.
7. How do I create custom reports over my PRTG data?
You can easily create custom reports in the form of charts, pivot tables, summary, and tabular views in Analytics Plus. Click the corresponding links to learn more about creating reports. These reports can also be organized together to form intuitive dashboards. Refer this documentation to learn more about creating dashboards.
8. Can I set up the PRTG integration in existing workspaces in Analytics Plus?
Yes. Follow the steps below to do this.
Open the required workspace, click the Create button from the side panel, and select the New Table / Import Data option.
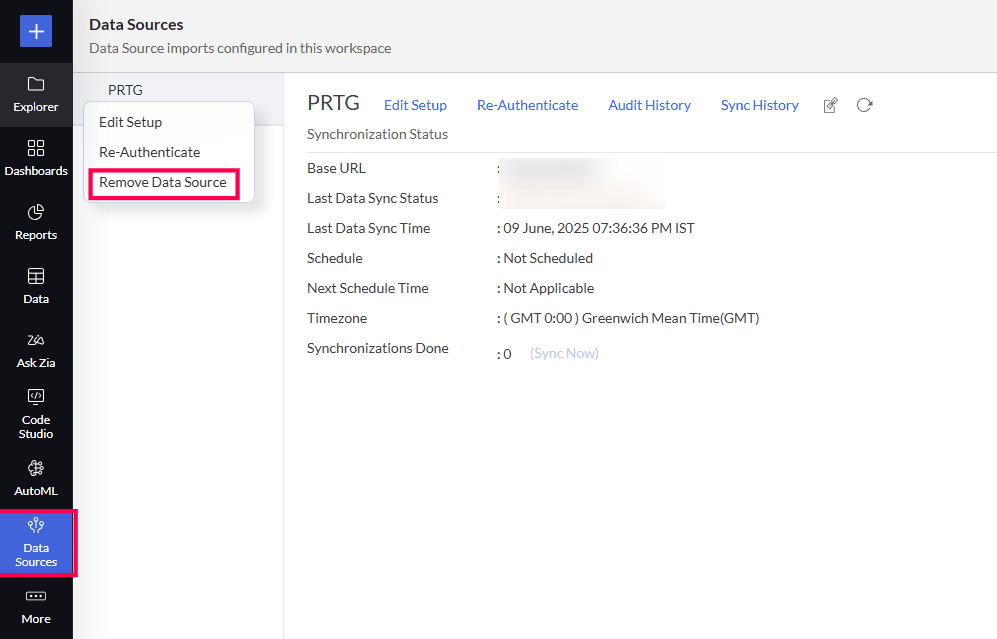
9. How do I remove this setup?
Open the corresponding workspace, and click the Data Sources option from the side panel.
Hover over the data source name, click the Settings icon, and select Remove Data Source from the options.
Reporting Features
1. What are the report types supported by Analytics Plus?
Analytics Plus supports a wide variety of reports, in the form of charts, pivot tables, summary views, and tabular views. To learn more about the various types of reports, click here. To know more about dashboards and KPI widgets, click here.
2. Can I modify the pre-built reports created on integrating with PRTG?
Yes. If you are the Server Administrator or a workspace administrator of the workspace in which the integration is set up, click the Edit Design button in a report's toolbar and make the required changes. If you are a user to whom a report is shared, save a copy of the report by clicking Save > Save As, and modify the copied version as needed.
3. How do I create reports using fields/columns across different PRTG modules?
Columns from different PRTG modules are joined by default. Therefore, reports can be created over this data by simply dragging and dropping the respective columns in the report builder. Click here to learn more about creating reports.
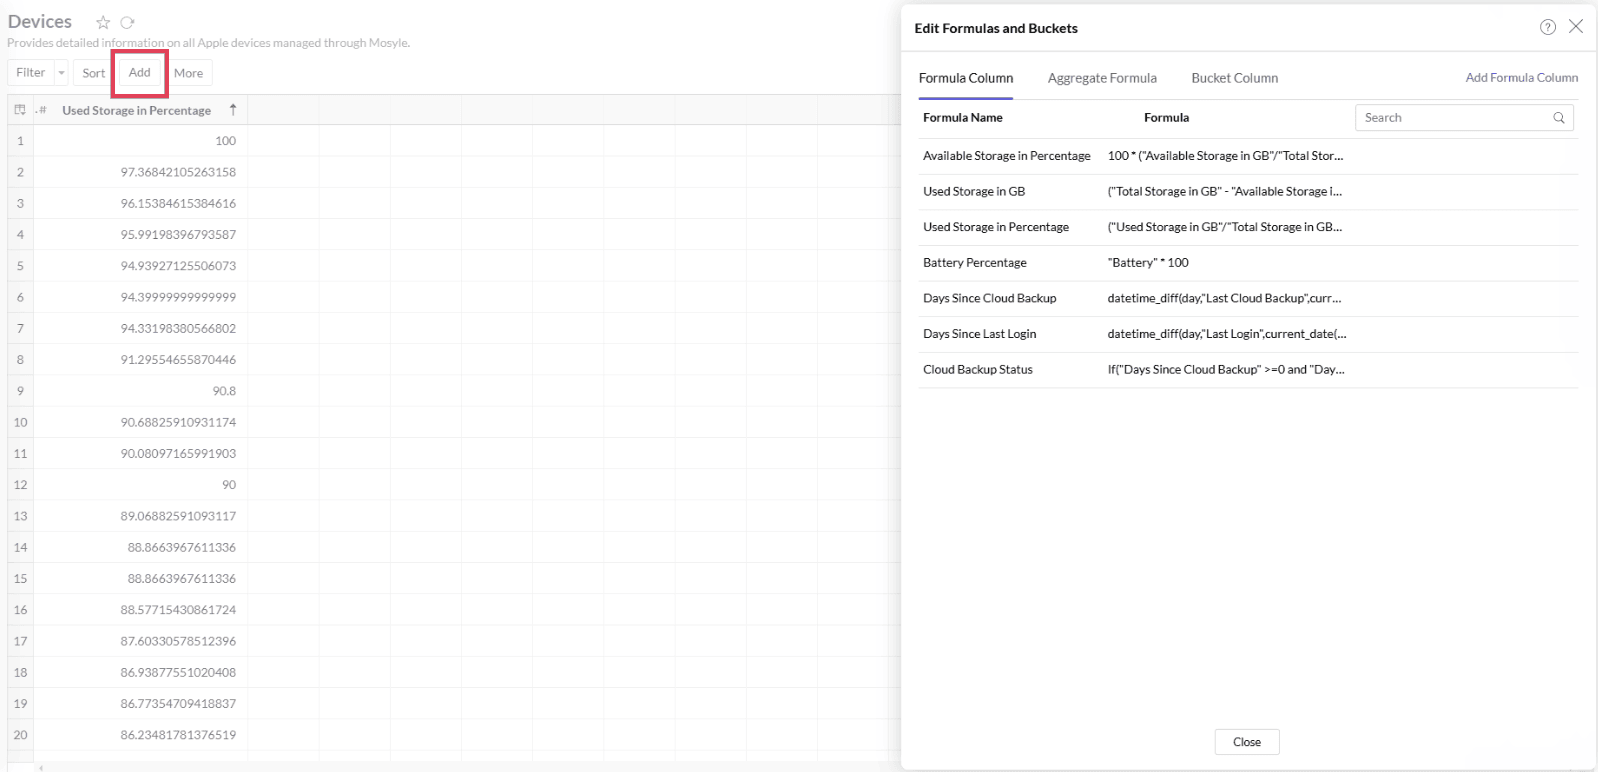
4. What are formulas in reports?
Formulas are calculations that can be defined using the powerful formula engine to create required reports. Refer this documentation to know more. There are also several default formulas created based on the PRTG modules. To view the default formulas, open the required table, click Add, and select the Edit Formulas option.
5. Is it possible to create custom formulas in Analytics Plus?
Yes. Refer this documentation to learn more.
6. Can I modify the tables imported from PRTG?
The data from PRTG is synchronized with Analytics Plus automatically and stored in the form of various tables. Therefore, it is not possible to add data or modify the existing data present in these tables.
7. Can I add new columns to the tables imported from PRTG?
No. However, you can add Formula Columns and Aggregate Formulas to these tables to help create custom reports. Refer to this documentation to know more.
8. Can I import new tables into the PRTG workspace?
To do this, open the PRTG workspace, click Create from the side panel, and select the New Table / Import Data option. You can integrate with other applications, or choose to import data stored in local files, web URLs, local databases, cloud databases and cloud drives. Click the corresponding links to know more.
9. Can I combine data from other sources with the data from PRTG, and create reports and dashboards?
Yes. To do this, import or add a new table to the PRTG workspace and define a lookup relationship between the added data and the existing data in the workspace. To define a lookup relationship between two tables, it is essential that the tables have at least one column in common between them. Follow the below steps to establish a lookup relationship.
Open the corresponding table, right click the column header, and select the Change to Lookup Column option.
In the popup that appears, select the column from the second table to look up.
Click Save & Close.
Click here to learn more about lookup columns.
Using query tables, Analytics Plus allows you to import the required data by writing standard SQL queries. This feature also allows you to combine data from different tables and create reports from the combined data. Refer this documentation to know more.
Sharing & Collaboration
1. How do I share reports, dashboards, and tables in Analytics Plus?
You can share the out-of-the-box reports, dashboards, and tables, and the ones you create, with other users easily. Refer this documentation to know more.
2. Why are my colleagues unable to access the reports I create?
The PRTG workspace can be accessed only by the administrator who set up the integration. To allow other users to access the out-of-the-box reports and dashboards, you can share the reports and dashboards as needed. Refer this documentation to know more. You can also share the entire workspace with a user. Refer this documentation to know more.
3. Can other users create reports using the tables in the PRTG workspace?
Yes. To do this, share the required table with the users with the required permissions and filters.
4. Is it possible to share the same report to multiple users such that they each see different data?
Yes, you can do this by creating Variables. This allows you to share the report with several users, with associated filter criteria so that each user can access only the data specific to them. To learn more, refer this documentation.
5. Can I export a report or a dashboard?
Yes, you can export the report or dashboard in various formats such as CSV, EXCEL, PDF, HTML, and image. To learn more, refer this documentation.
6. How do I print the reports and dashboards created in Analytics Plus?
To do this, export the report or dashboard in the required format and print the exported file. To learn more about exporting a view in Analytics Plus, refer this documentation.
Note: To export a shared report or dashboard, the Export permission has to be enabled.
7. Can I email reports and dashboards at scheduled times?
Yes, you can easily set up email schedules. Refer this documentation to learn more.
Yes. You can easily embed reports and dashboards into websites, applications, or blogs. Refer this documentation to know more.
Help & Support
1. How do I get technical support on Analytics Plus?
Technical support is free for all users, even during the trial period. You can contact the technical support team using the information below.
Phone:
United States: +1 4695016108
United Kingdom: +44 2076602649
Australia: +61 892100050
You can also get answers straight from our community.
2. Can I have a personalized demo of this integration?
Yes, please register for a demo using the form on this page.