Analyzing AWS Elastic Container Services in DDI Central
How DDI Central’s Cloud Observability Helps:
With DDI Central’s ECS integration, network teams gain unprecedented visibility into containerized environments that were previously opaque:
- Track Container IPs: Instantly map container tasks and services to their associated Elastic Network Interfaces (ENIs), IPs, and subnets.
- Visualize Network Placement: Understand how ECS services are distributed across VPCs, subnets, and availability zones.
- Resolve DNS Conflicts: Detect and validate DNS records associated with ECS containers to avoid routing issues or name resolution failures.
- Audit Cluster Infrastructure: Correlate ECS task definitions, service names, and cluster tags with network data to ensure infrastructure integrity.
- Troubleshoot with Context: Identify which IPs, ENIs, and ECS services are involved in anomalies, blocked domains, or traffic issues—all from one console.
Why It Matters for Network Admins:
- Say goodbye to blind spots in containerized environments
- Gain end-to-end traceability from ECS tasks to IPs, DNS records, and ENIs
- Enable faster incident response and stronger network segmentation in cloud-native apps
To access and analyze ECS resources within DDI Central:
- Log into DDI Central using the web UI. Only an Admin or Operator with pertinent access privileges to a cloud cluster can access a Cloud Observability cluster.
- Select an AWS-integrated Cloud Observability Cluster, created during cloud integration setup, from the top right corner within the Web UI.
- Navigate to IPAM->ECS menu inside the selected cluster. Click the Cluster tab at the top of the page. This opens a dedicated dashboard for AWS ECS observability.
- Select the required Availability Zone from the drop-down menu in the top right corner. Based on the selection, the dashboard enables admins to easily monitor containerized infrastructure deployed in Amazon ECS. Each panel offers visibility into ECS clusters, tasks, subnets, containers, and their network attributes.
5. ECS Cluster Dashboard Overview
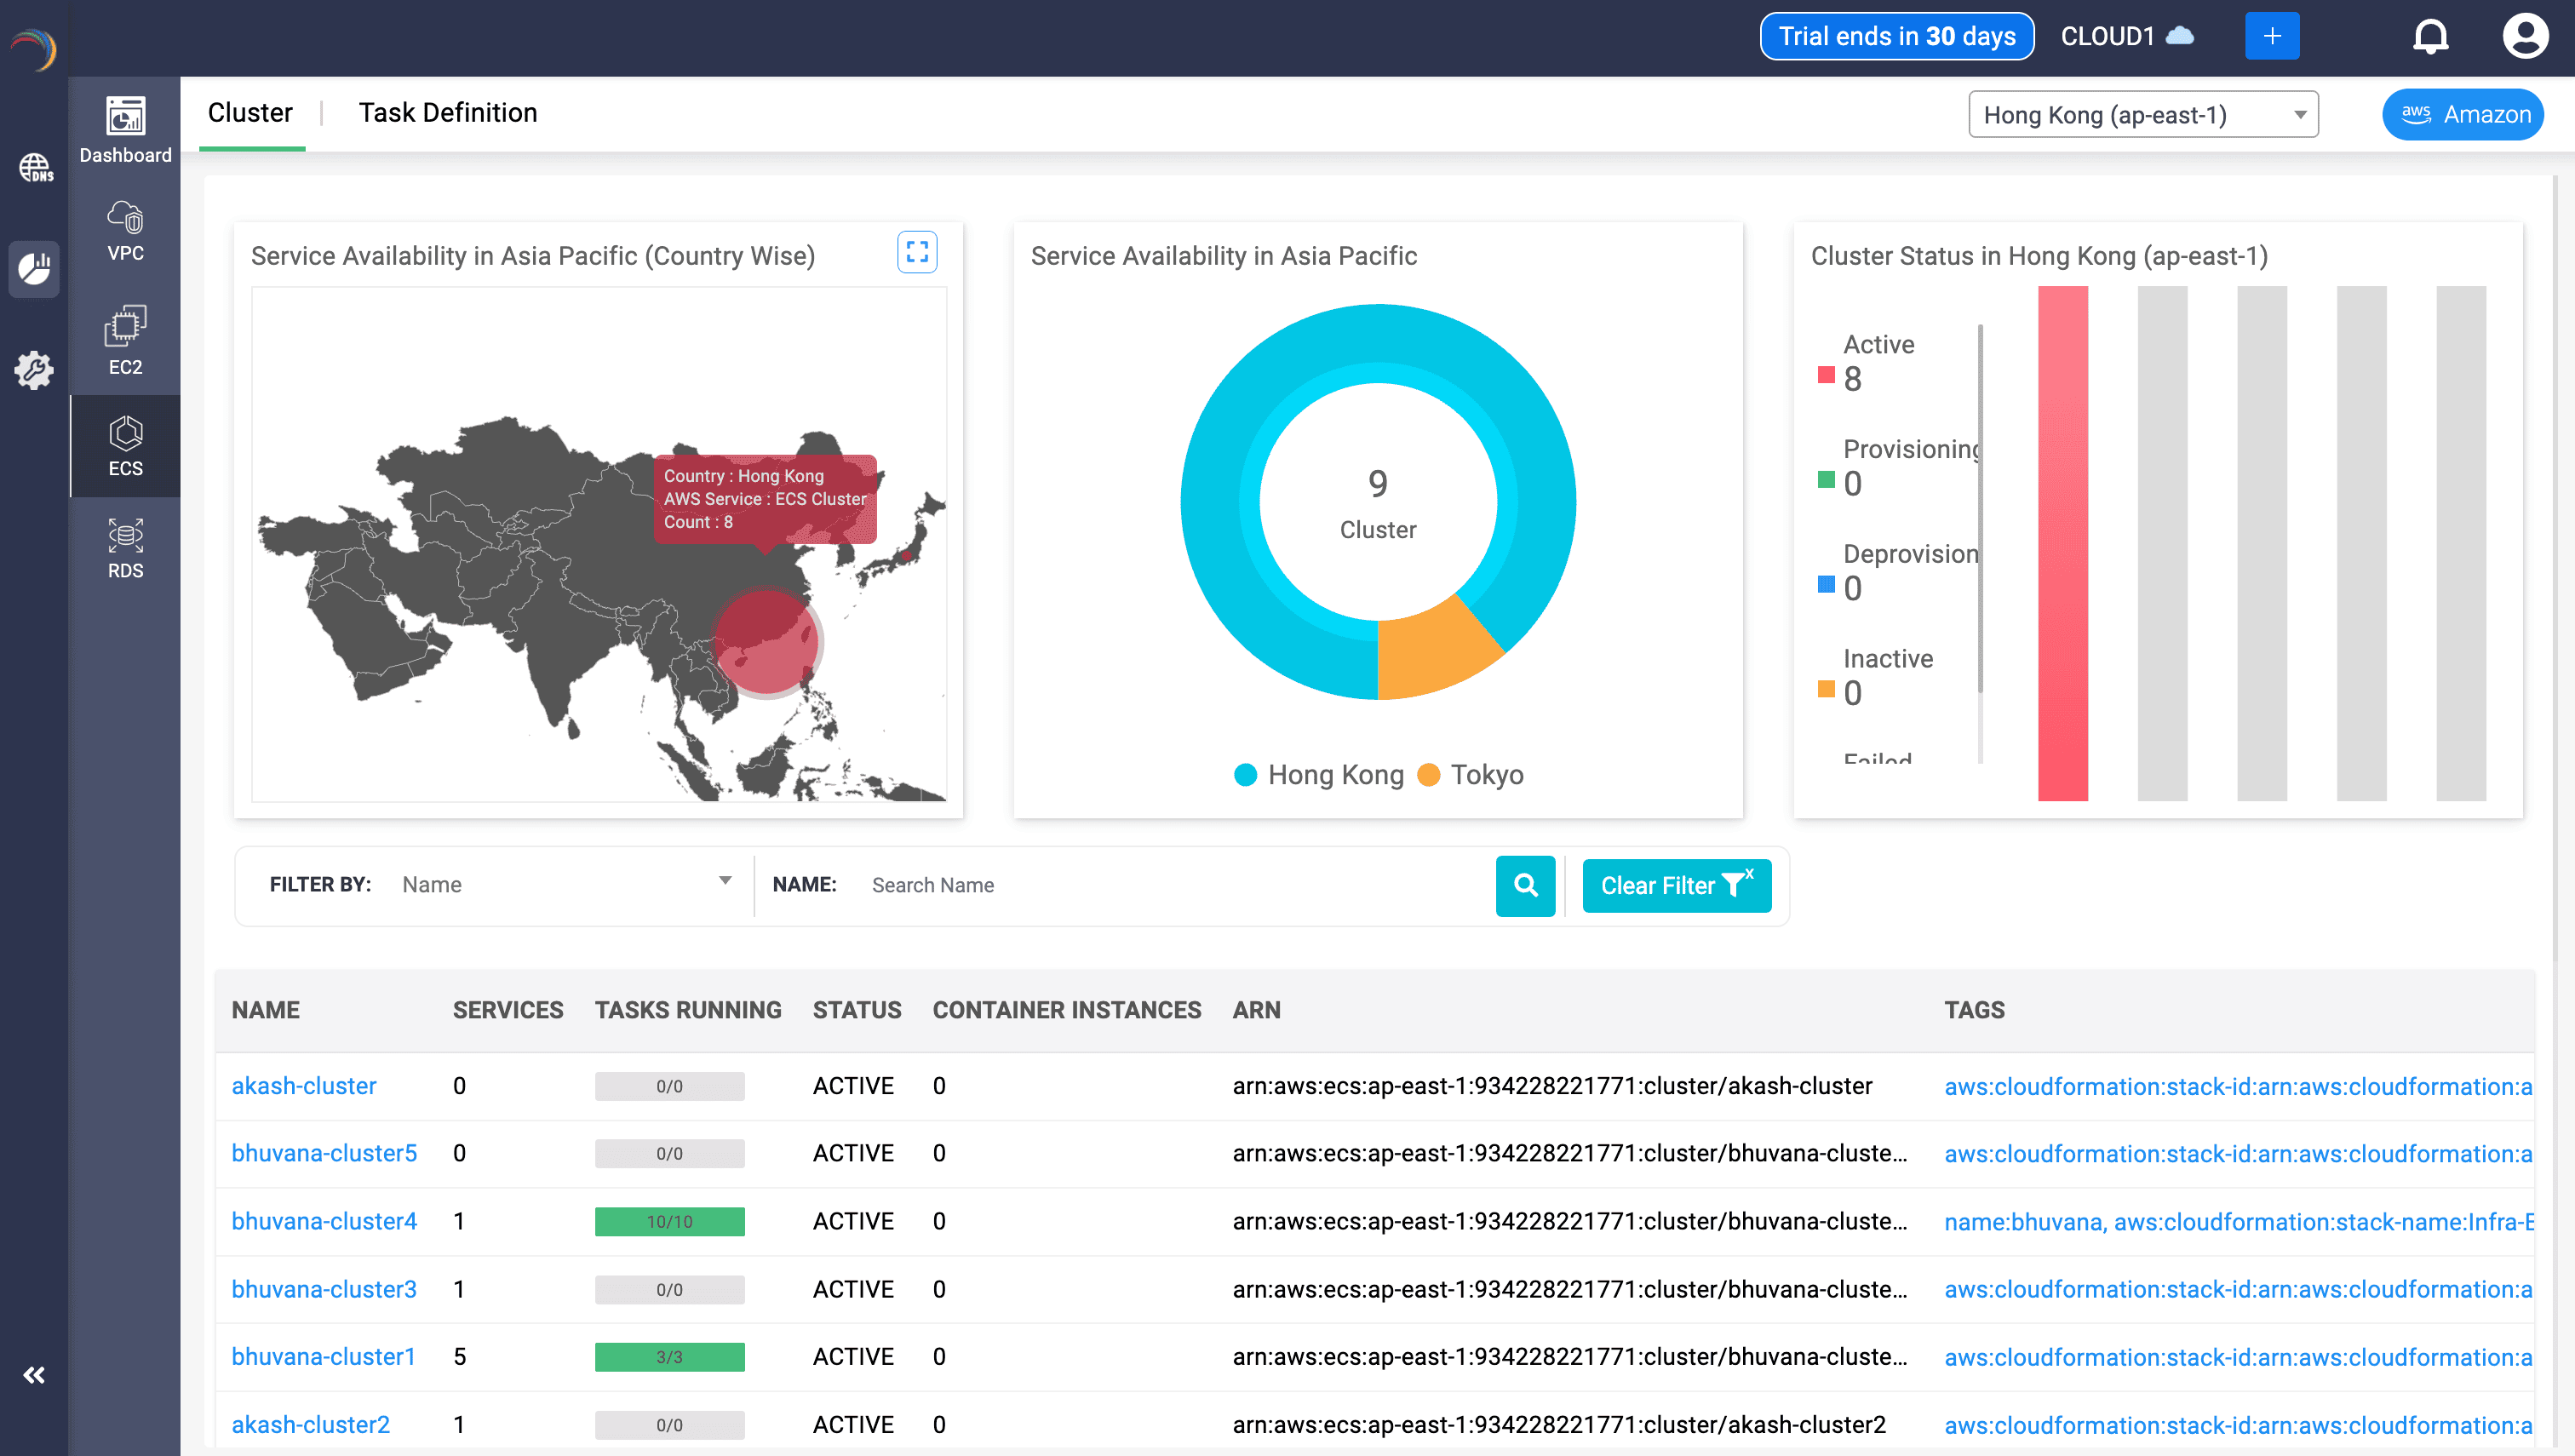
ECS Cluster Heatmap & Distribution Charts
- Components:
- Geographic map showing ECS cluster count by country.
- Donut chart indicating cluster distribution by region.
- Bar graph denoting cluster status (Active, Provisioning, Inactive, etc.).
- Uses:
- Helps SREs and architects instantly spot deployment density across Asia-Pacific.
- Assesses provisioning velocity and fault distribution across AWS regions.
ECS Cluster Inventory Table
- Fields:
- Cluster name, Task count, Services, Container Instances
- Cluster status, ECS ARN, CloudFormation stack tag links
- Uses:
- Serves as a launchpad for task-level and service-level health checks.
- Ties infrastructure-as-code context through stack identifiers.
ECS Cluster Tag Modal
- Details:
- Name, Stack Name, Logical ID, Stack ID
- Uses:
- Provides clarity on origin, ownership, and deployment toolchain.
- Accelerates incident audits and asset discovery.
- Components:
Cluster-Level Service & Task Breakdown
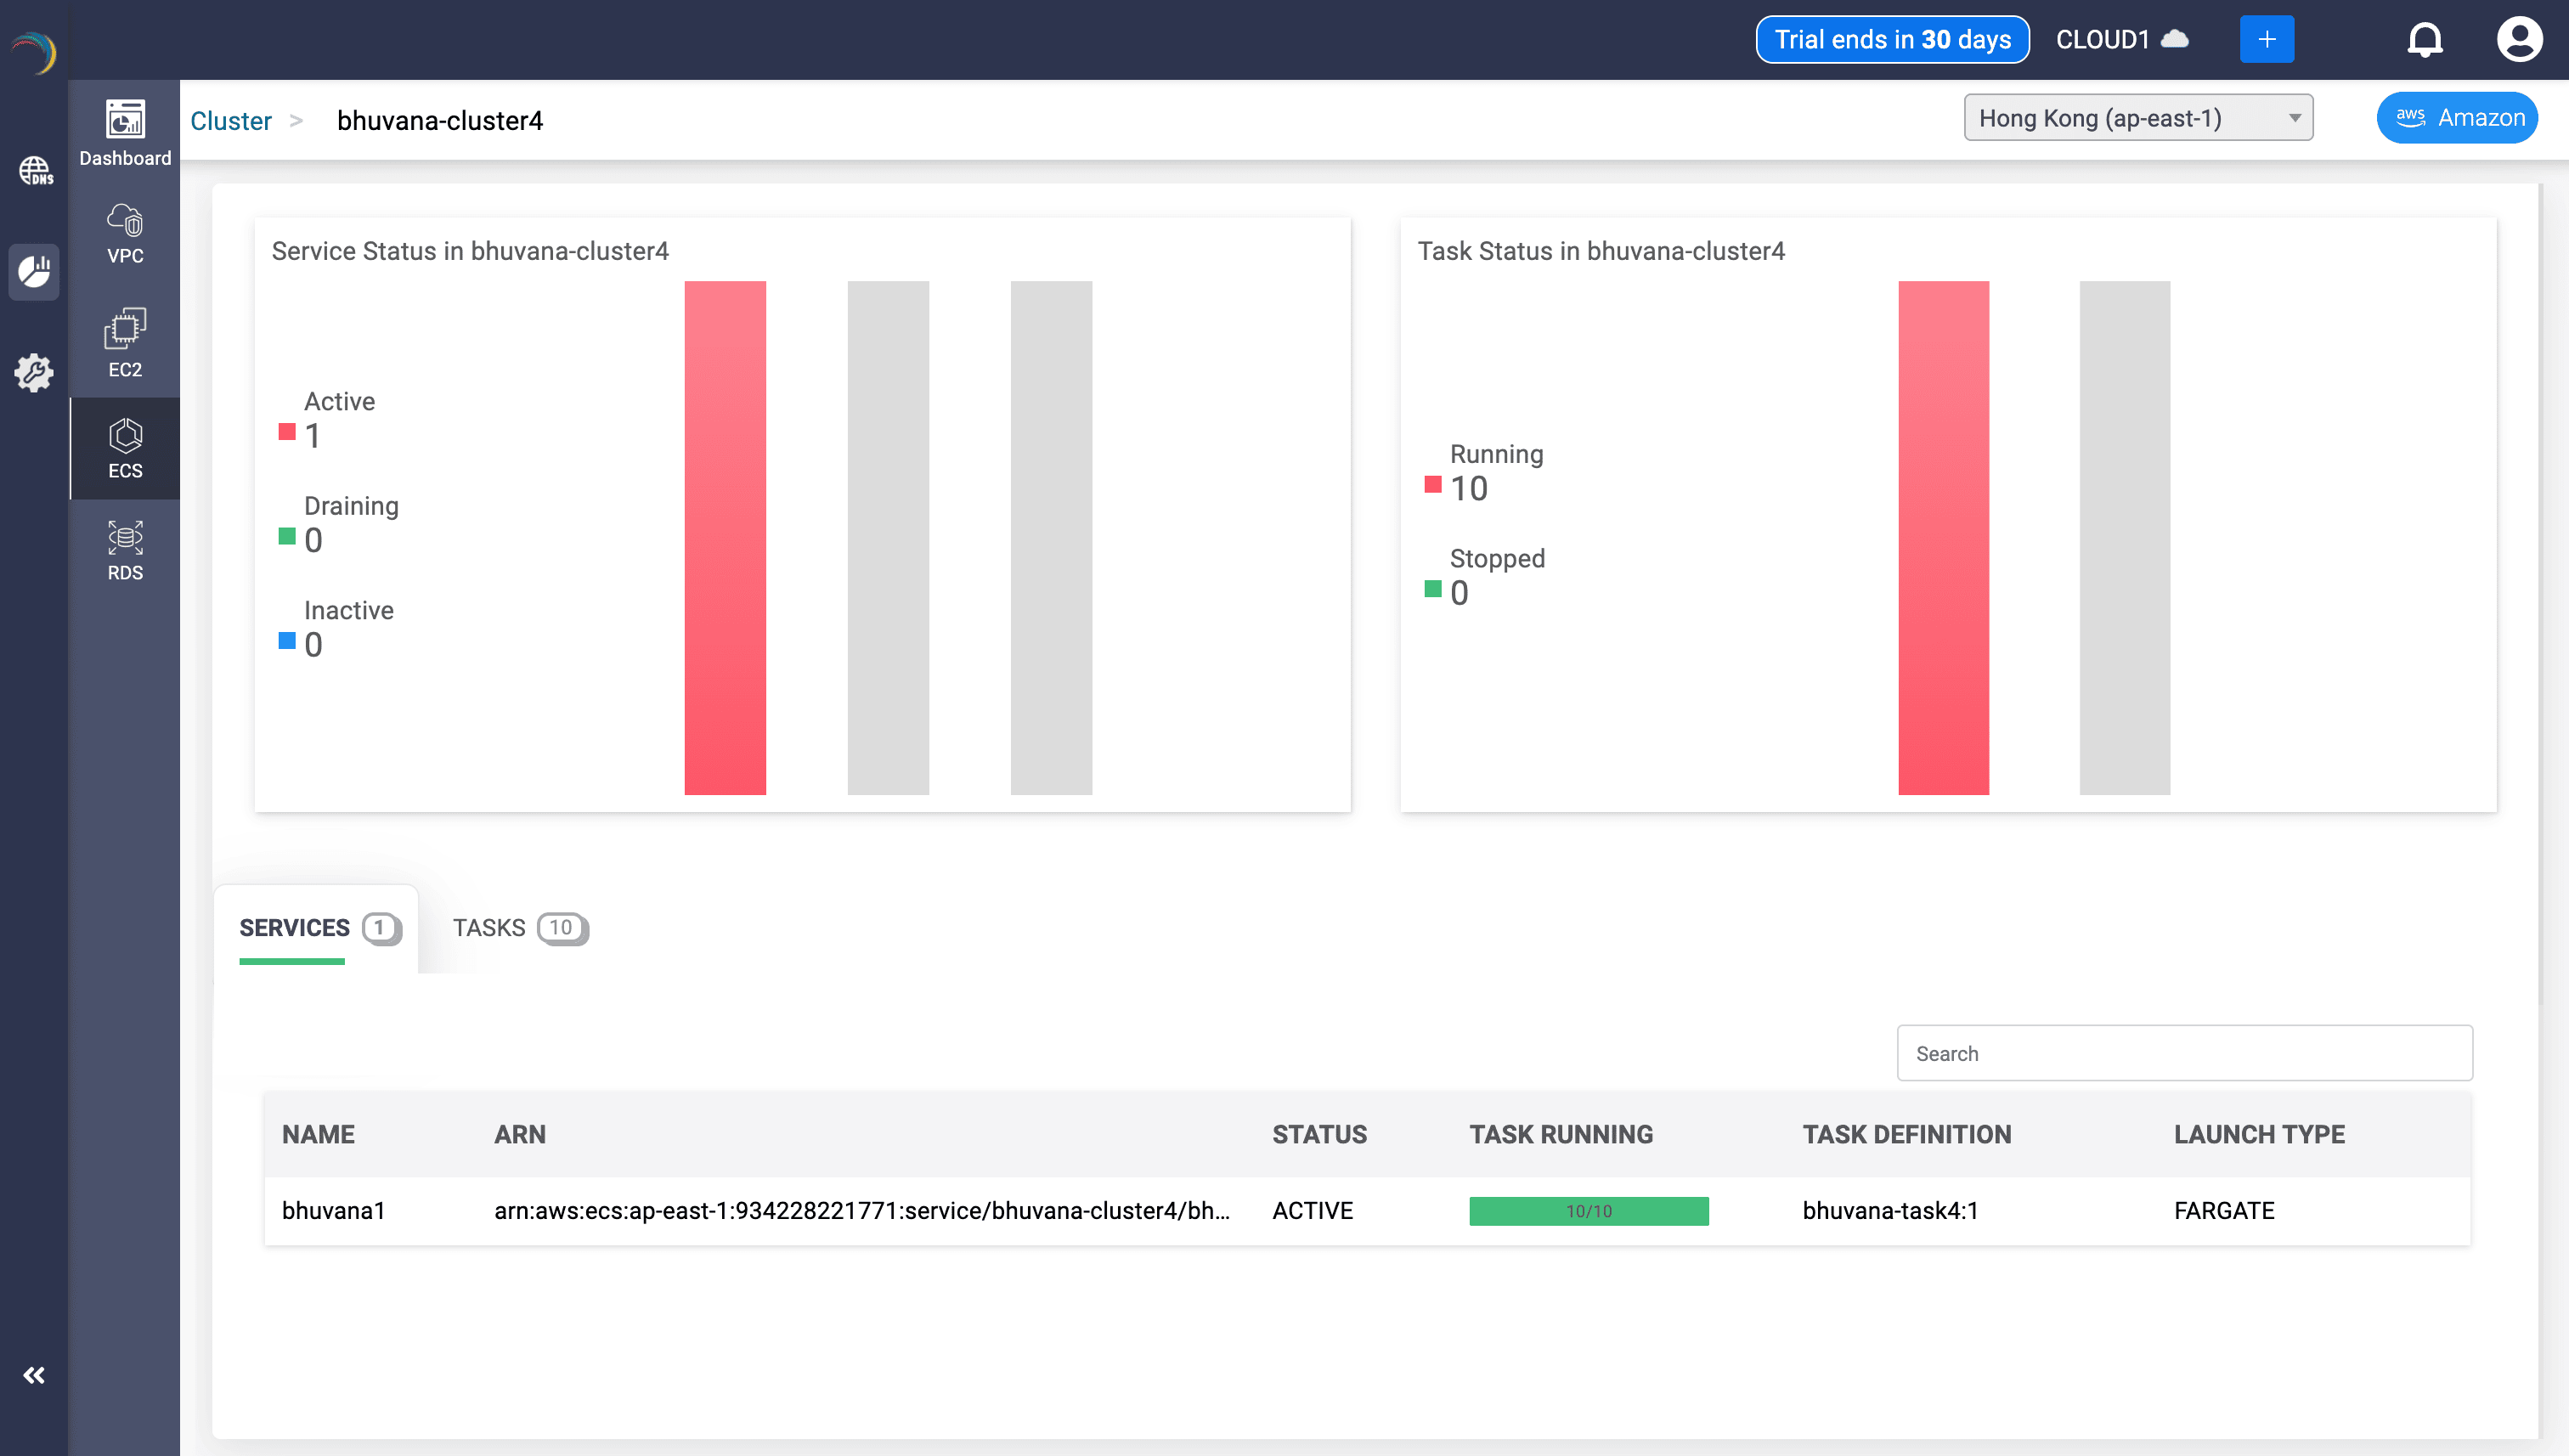
Service Status Overview
- Panels:
- Active, Draining, Inactive service counts per cluster
- Running vs. Stopped task bar chart
- Uses:
- Validates real-time service health.
- Visualizes whether expected tasks are live or crashing.
Service Inventory Table
- Fields:
- Service name, Status, Running Task Count
- Launch Type, Task Definition
- Uses:
- Instantly correlates ECS services with runtime state.
- Differentiates between Fargate and EC2-based launches.
Task Inventory Table
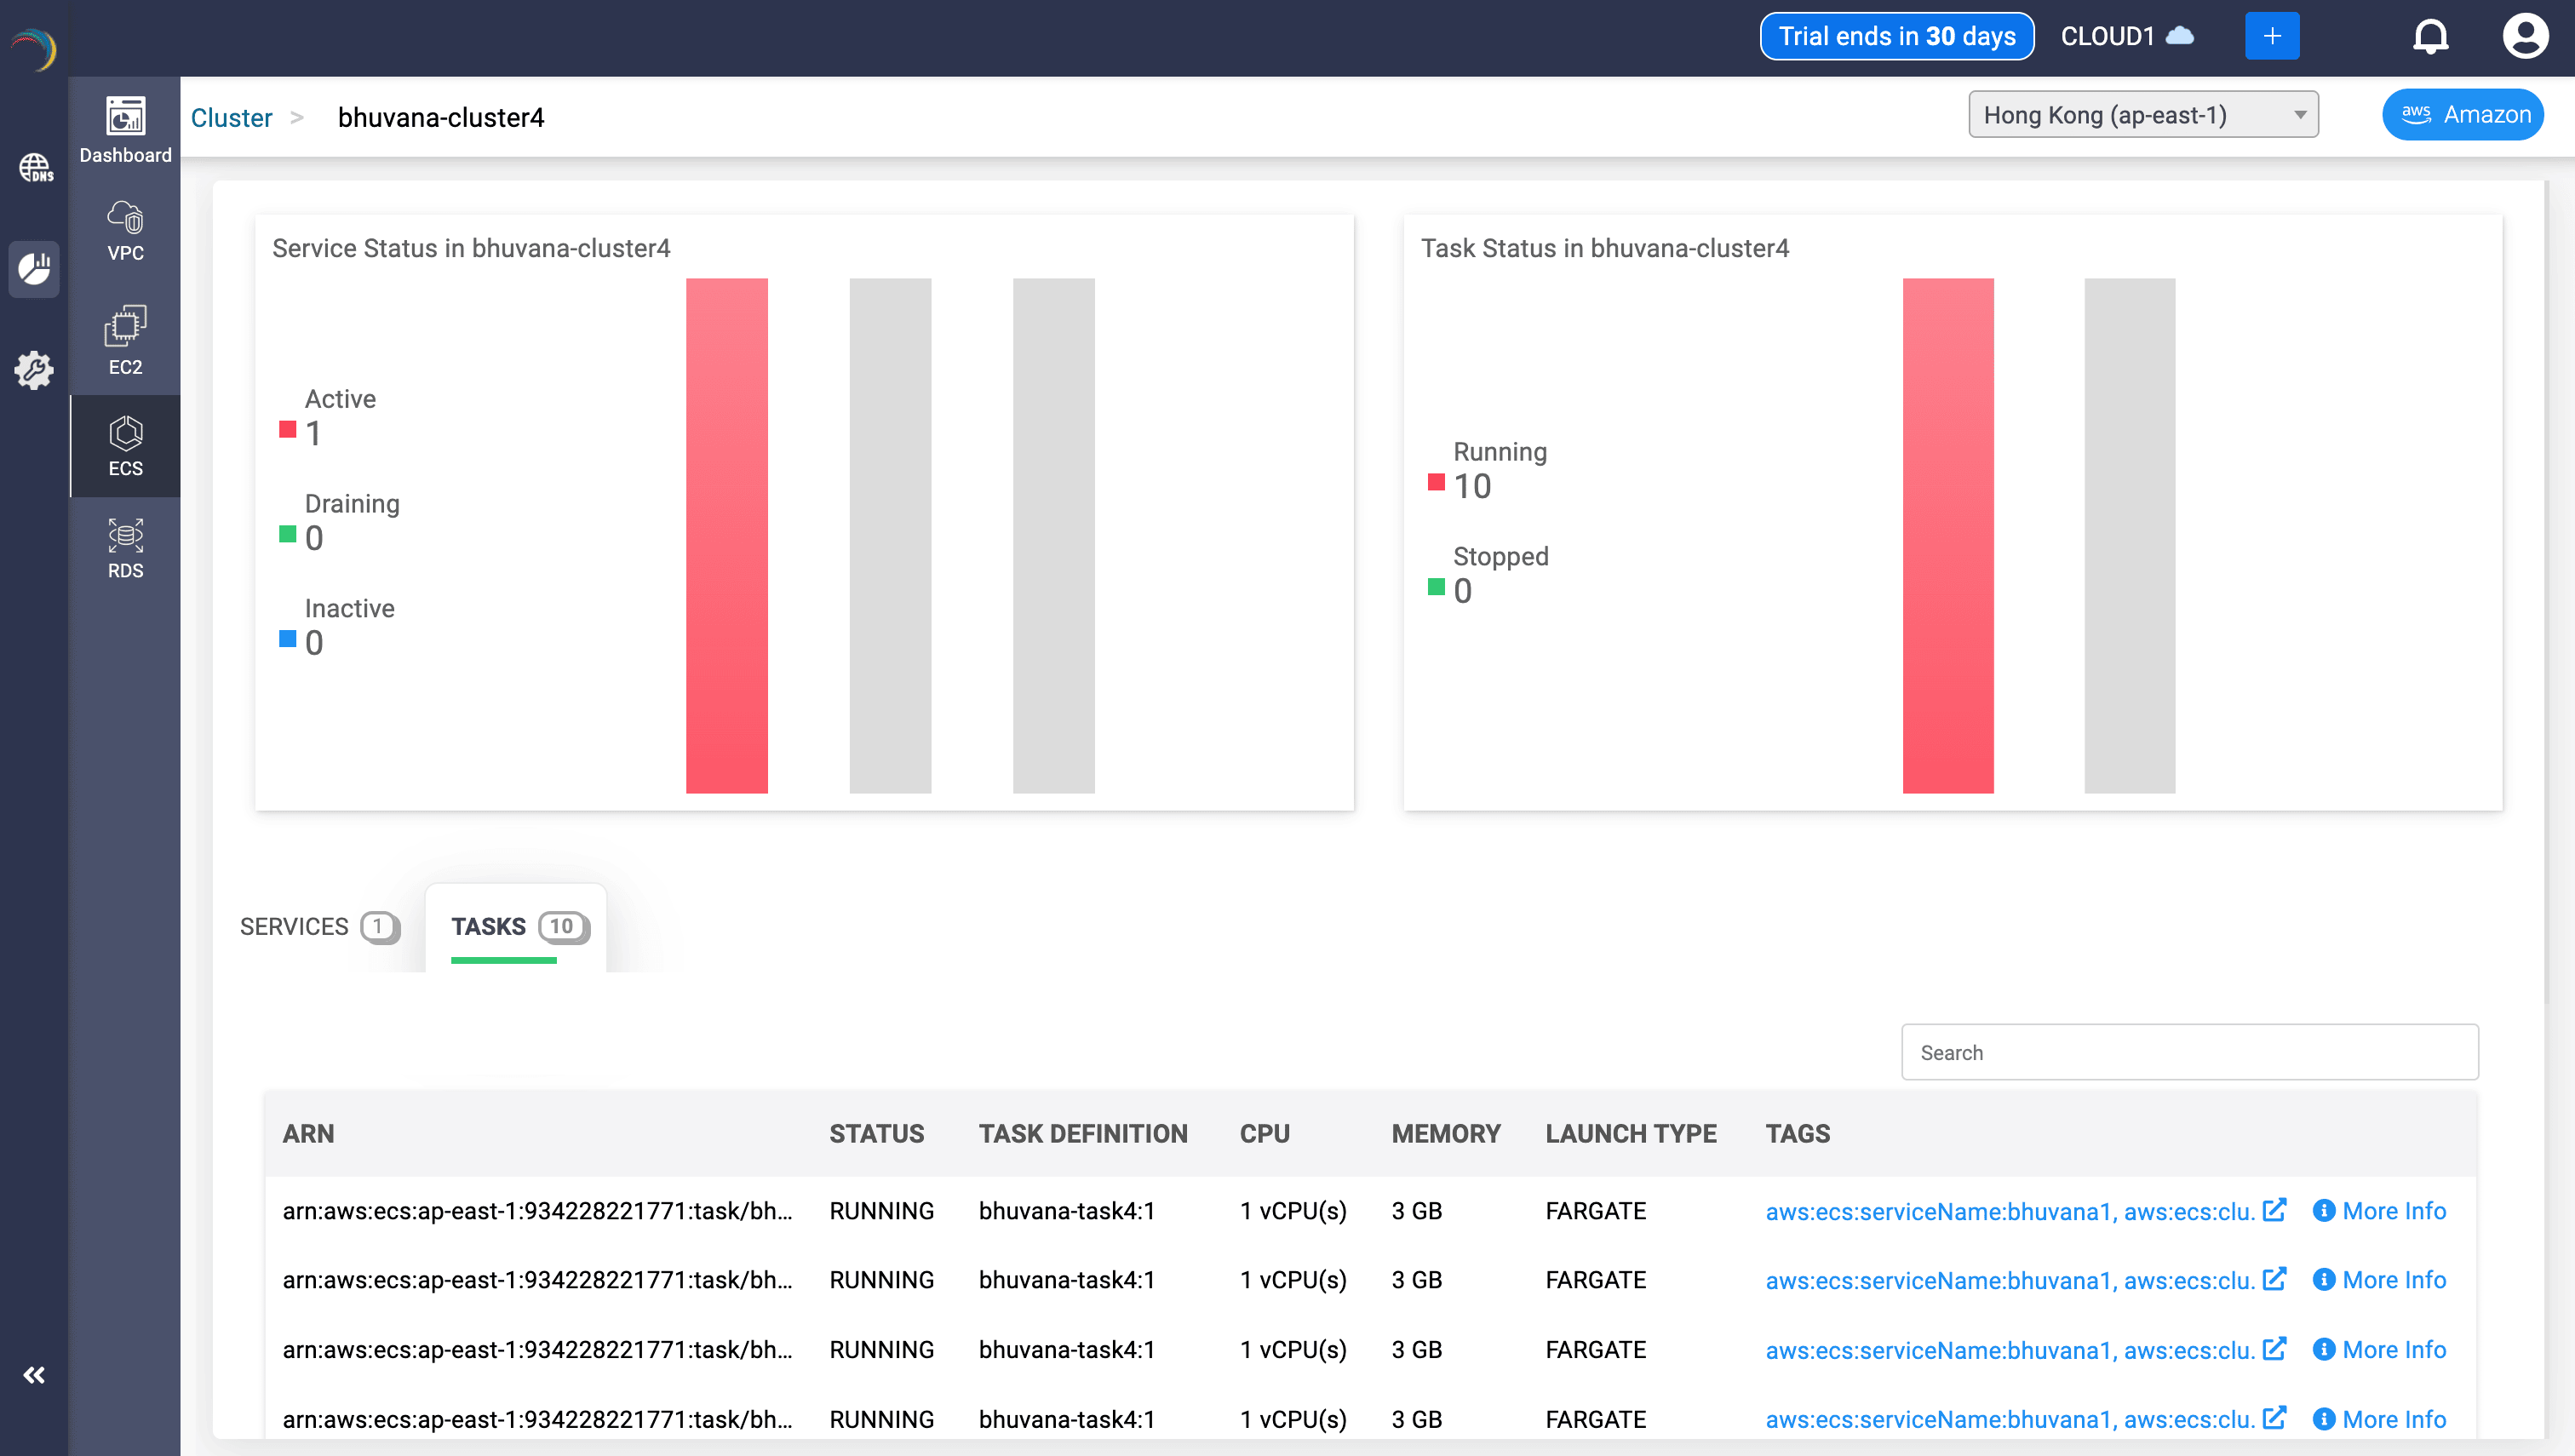
- Fields:
- Task ARN, Status, CPU & Memory reservation
- Launch Type, Task Definition, Tags
- Uses:
- Surfaces over/under-provisioning risks.
- Enables microservice tracing and runtime diagnostics.
- Panels:
Task-Level Deep Dive
To drill down each task further, select a task and click on More Info link in the extreme right end of the chosen task entry. A dedicated page for the chosen task appears detailing the following:
Subnet Mapping
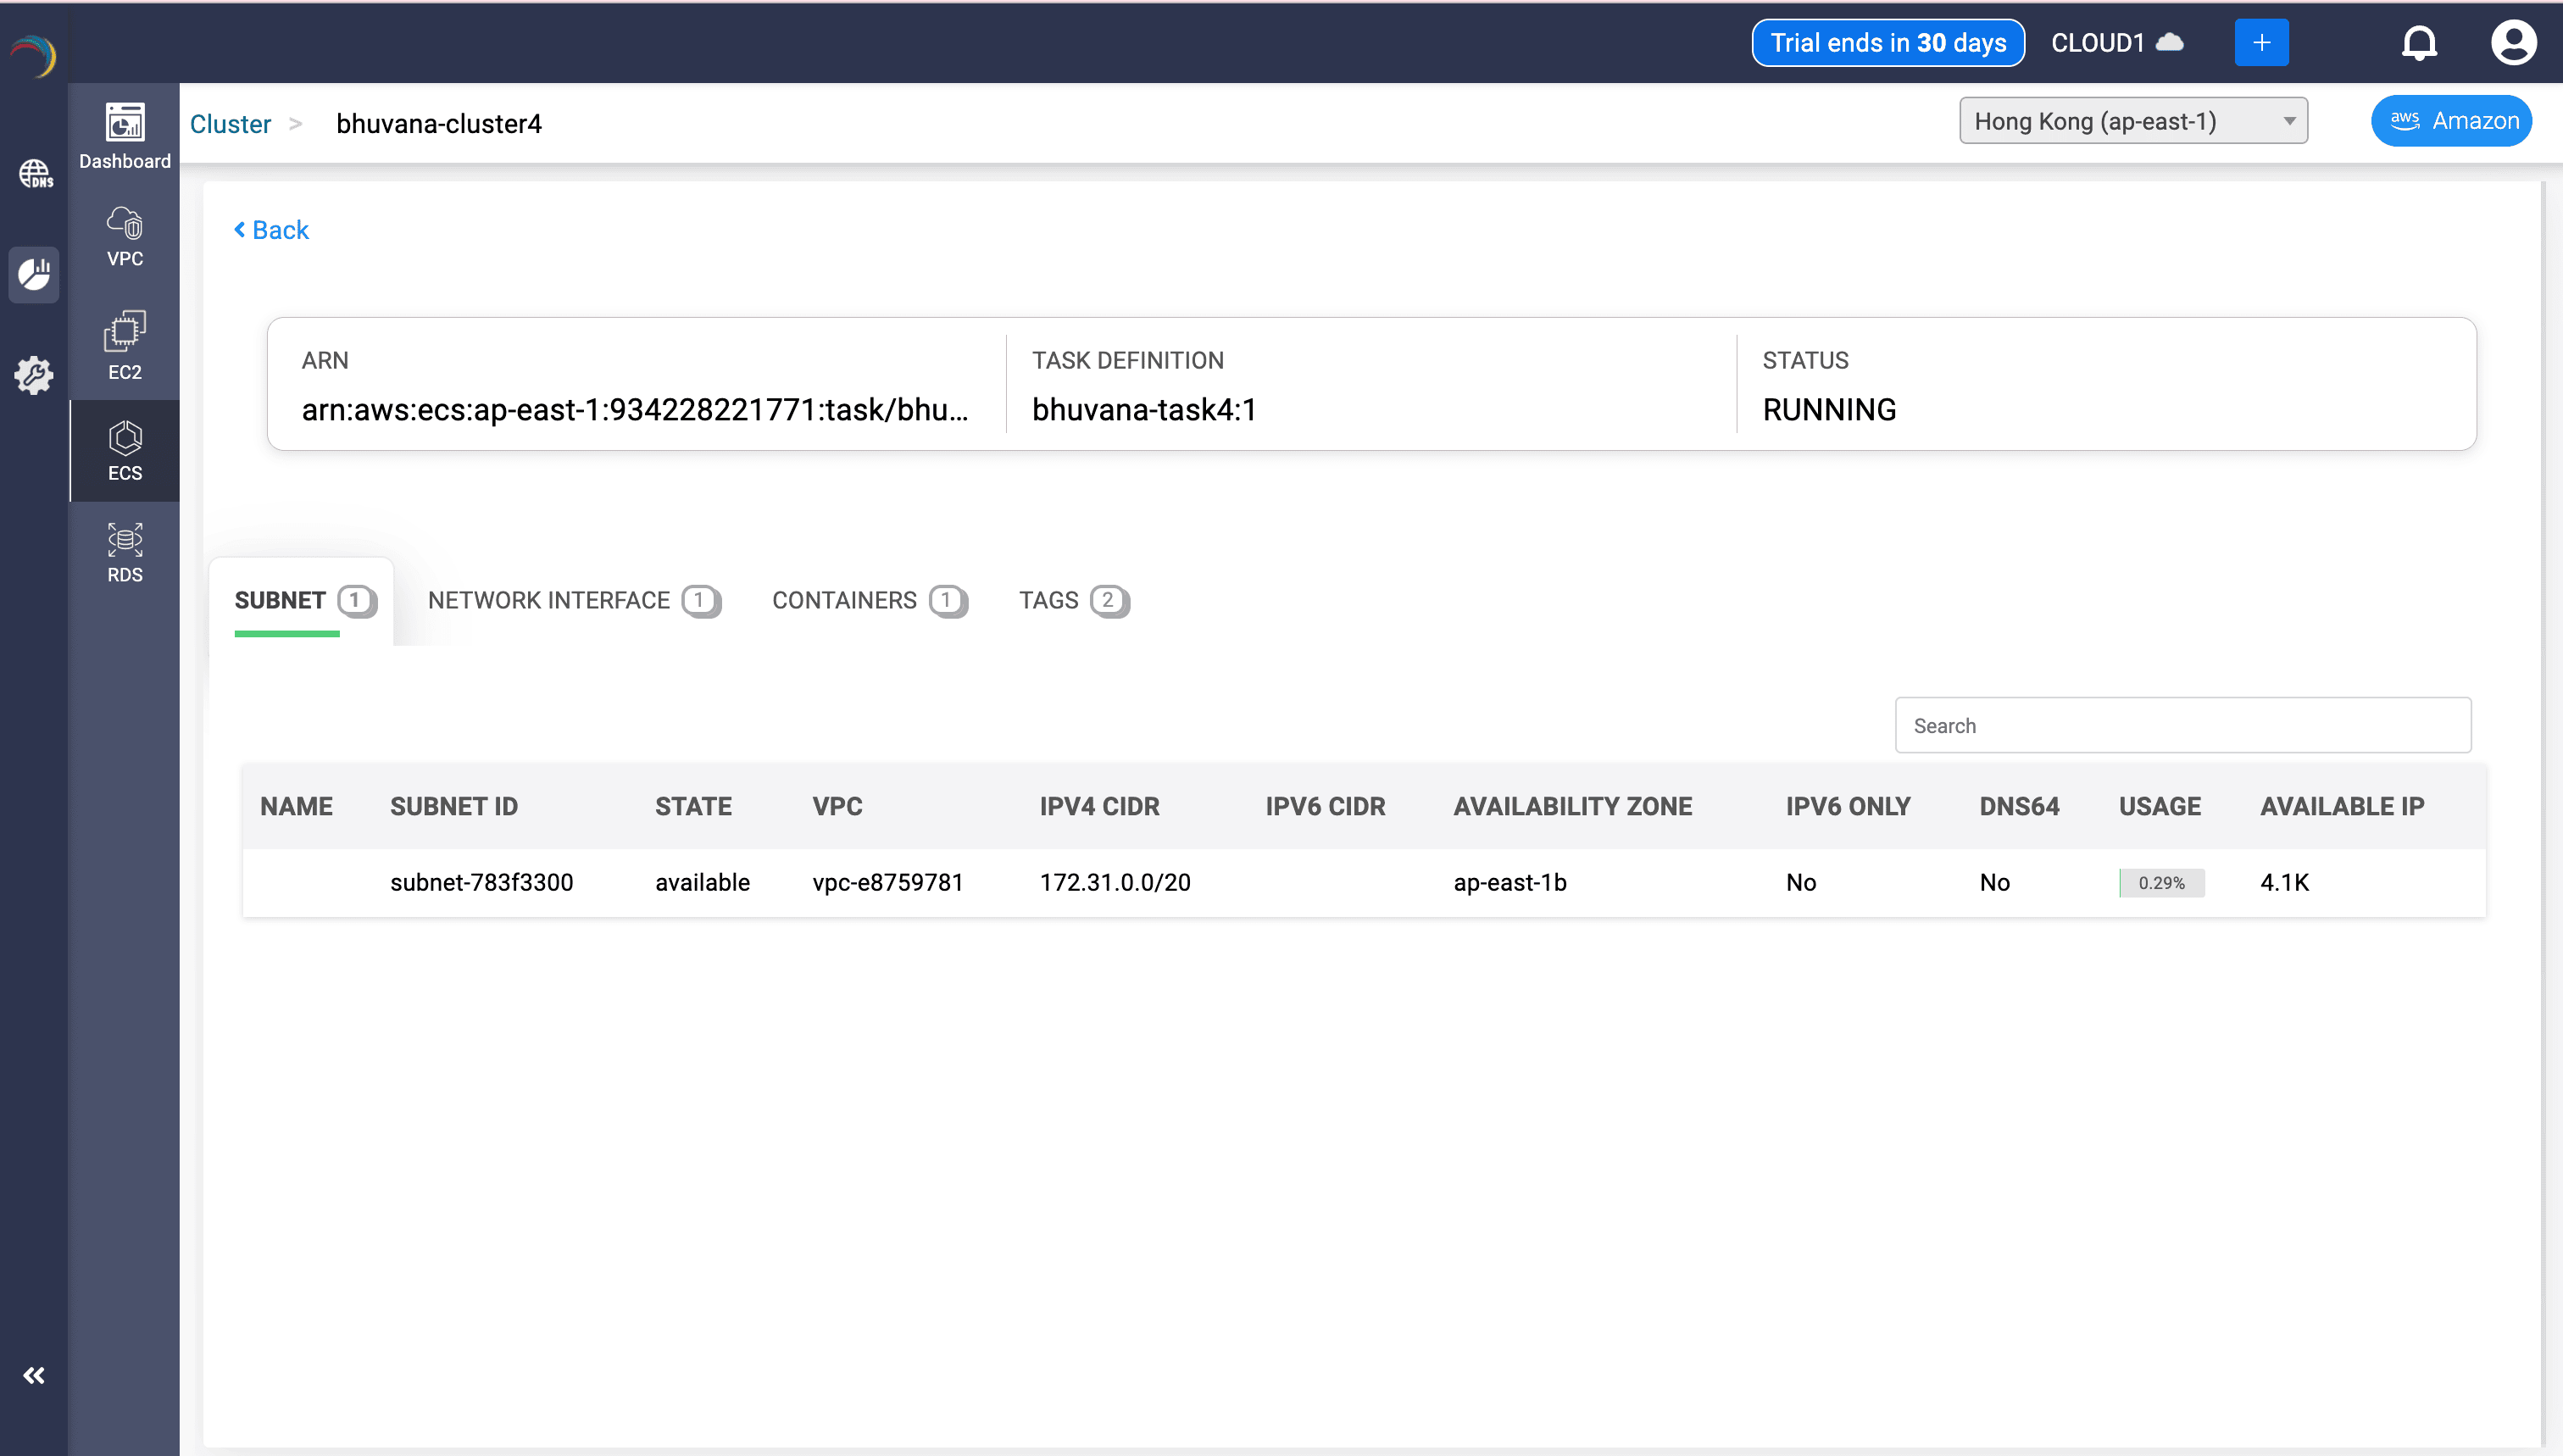
- Details:
- Subnet ID, CIDR block, AZ, Usage %, Available IPs
- IPv6 & DNS64 flags
- Uses:
- Verifies container placement at the subnet level.
- Assists in subnet utilization planning and IPv6 transition readiness.
ENI Mapping

- Fields:
- ENI ID, Subnet ID, VPC ID, Instance ID, Security Groups
- Public DNS, Public/Private IP, MAC Address
- Uses:
- Confirms the network identity of the ECS task.
- Links network interface with security posture and public exposure.
Container Metadata
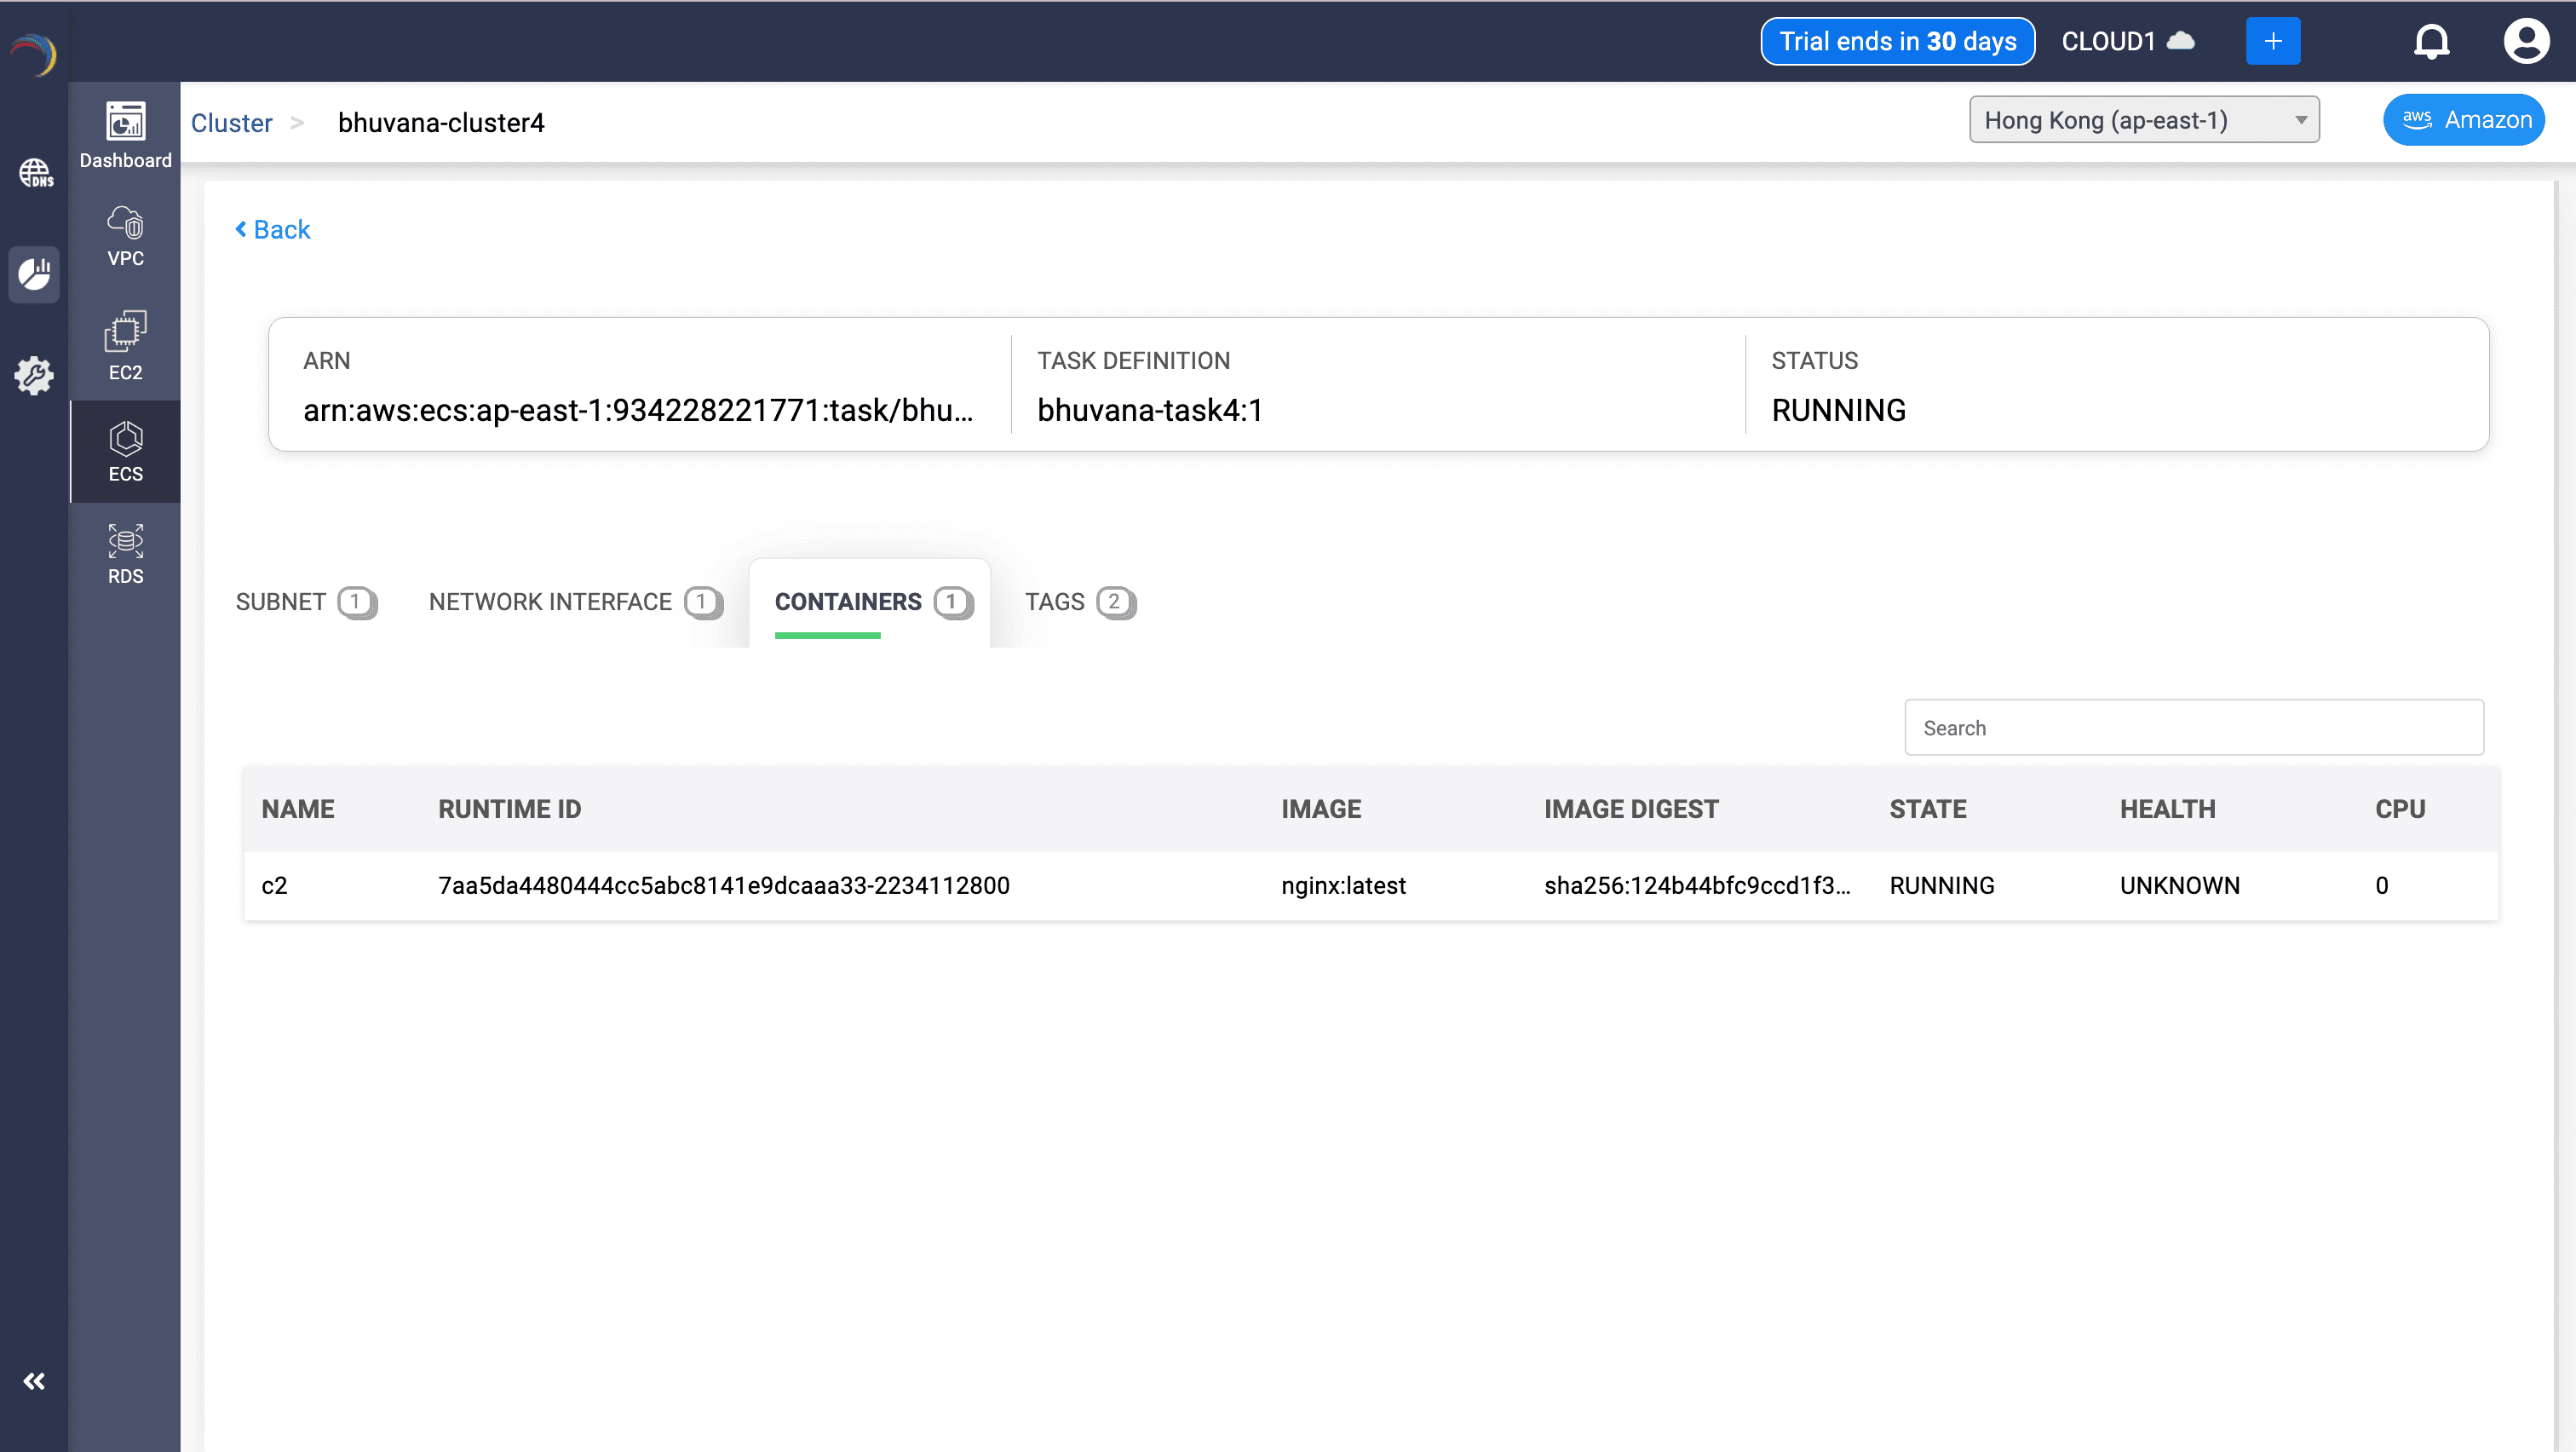
- Fields:
- Container Name, Runtime ID, Image, Digest
- CPU, State, Health
- Uses:
- Links the ECS task to the container image.
- Enables debug of container lifecycle & performance metrics.
Task Tag Mapping
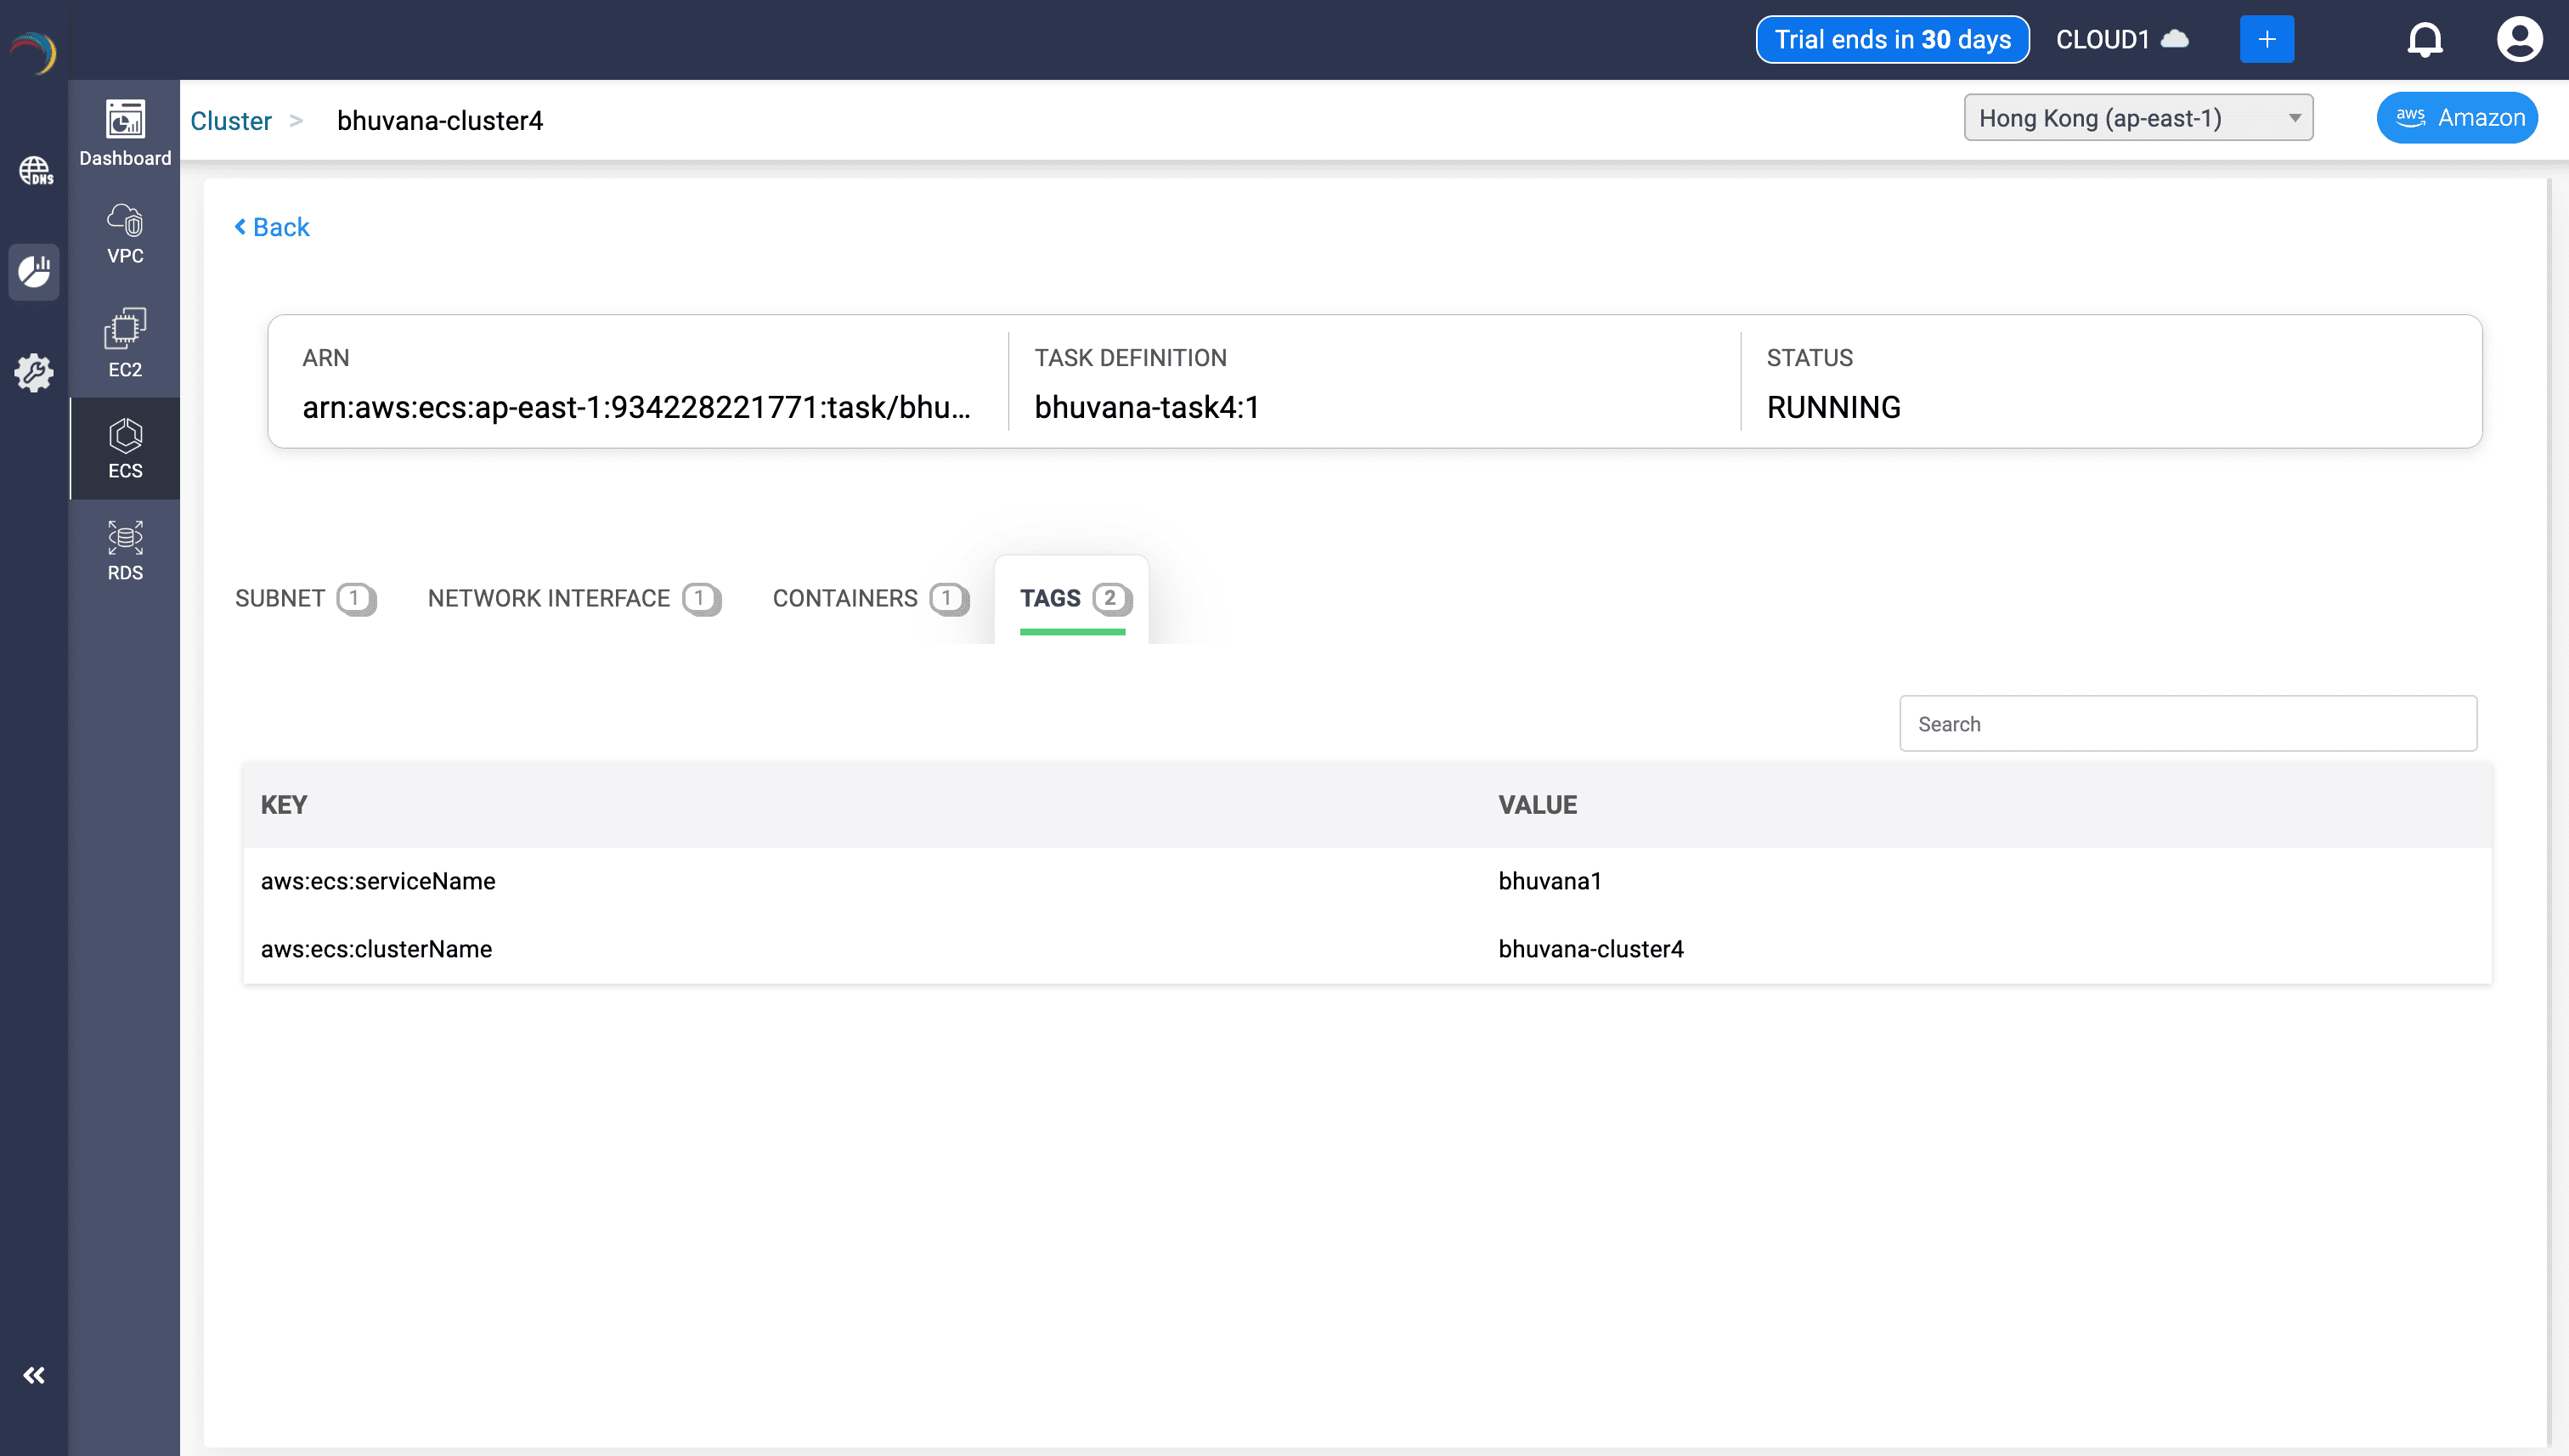
- Tags:
- aws:ecs:serviceName = bhuvana1
- aws:ecs:clusterName = bhuvana-cluster4
- Uses:
- Maintains traceability across ECS architecture.
- Supports cost attribution and ownership compliance.
- Details:
Why It's Effective
Using DDI Central's ECS observability capabilities, administrators can:
- Monitor ECS cluster density and health at a glance
- Drill into ECS task placement, performance, and container context
- Link network interface properties to ECS microservices
- Validate public vs. private access and DNS exposure
- Visualize regional service distribution and runtime task count
- Strengthen incident diagnosis and container lifecycle governance
DDI Central bridges the gap between ECS compute orchestration and granular network visibility—empowering you to manage containers with confidence.