Observability as a concept explains to what extent a network or an environment can be perceived with the help of data gathered from external sources contributed by the environment itself. A fully observable ecosystem answers the question, "What changed?" with contextual information that will help you pinpoint an issue, track it, find the root cause, and fix it before it can affect the business as a whole.
Rudolf E. Kálmán introduced the concept of Observability as a measure of how well the internal state of a system can be inferred from knowledge of its external outputs. Gartner defines observability as the characteristic of software and systems that allows them to be “seen” and allows questions about their behavior to be answered.
Observability lets you understand a network better, making resource management easier and enabling you to improve the performance of your distributed IT infrastructure by providing transparent and deep visibility into it.
Network observability is attained from information gathered through telemetry. Telemetry is the process of recording or representing the data acquired from monitoring your network as a whole. The data collected is then analyzed to provide an in-depth understanding of your environment, the components in it, and its overall behavior.
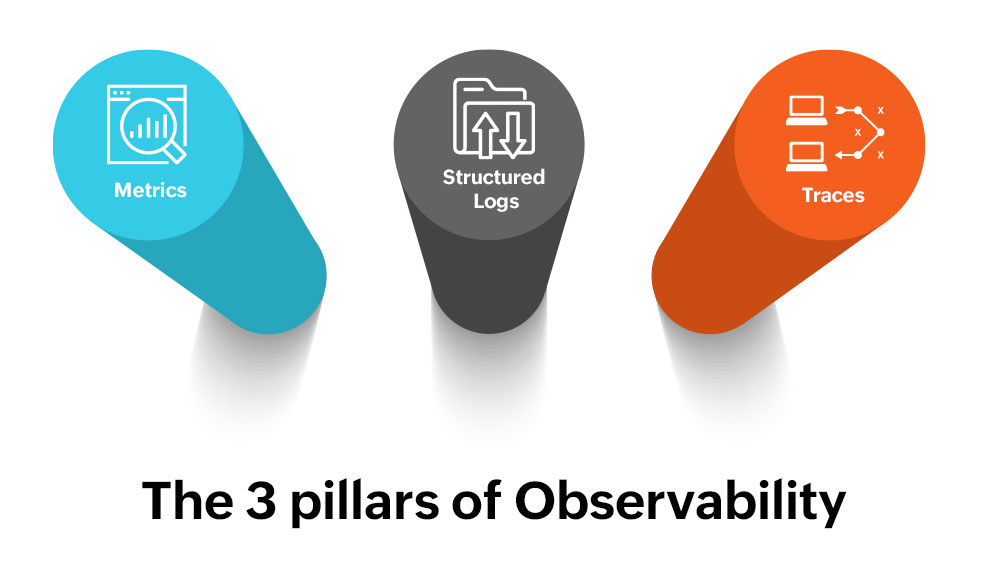
Observability uses telemetry data to determine the behavior of an environment. Telemetry data gathered through metrics, logs, and traces, commonly known as the three pillars of Observability, is then employed to achieve a fully observable environment.
Metrics: Metrics are data measured or acquired from the individual components of a network. Latency and traffic in a network, error and discard rates, and saturation data acquired from network devices all contribute to metrics.
Structured logs: Logs record events that occur in a system. Be it system logs or application logs, recording and analyzing the acquired logs will help you determine the events and actions occurring in the system.
Traces: Traces give you the step-by-step approach an application takes in executing a specific functionality. They help you identify the lowest performing functions or components in an application, help in troubleshooting, and provide critical visibility into the behavior and overall health of an application.
A fully observable network will facilitate and simplify the flow of processes. This includes service deployment, configuration changes, workload distribution, cloud dependency, customer experience, service performance, and resource consumption.
Observability and monitoring: The similarities and differences
Monitoring deals with "known unknowns." Network monitoring, or environmental monitoring in general, involves error detection, data collection, and being aware of the availability of your network components. When monitoring, a network admin generally decides on what to monitor and subsequently discovers problems in areas that are known to be error-prone. In doing so, they overlook what they are not aware of or miss the root cause of the issue.
On the other hand, Observability deals with "unknown unknowns." Observability is surveilling your environment to avoid the above-mentioned anomalies and predicting changes, if any. Monitoring is a part of its operation, with AIOps, cross-domain correlation, application correlation, and performance analytics as counterparts.
Observability isn't just about the whats but lets you understand the whys and hows, too. It is always easier to find the change that caused a disruption, but the hard part is understanding how and why it happened and what caused it in the first place.
Gartner's definition of observability:
Observability is the evolution of monitoring into a process that offers insight into digital business applications, speeds innovation and enhances customer experience.
Unlock the power of full-stack observability
Integrated infrastructure and application visibility from a single console
Meet user expectations - build strong user journeys and digital experiences
Stay nimble in dynamic IT environment with proactive detection and troubleshooting capabilities
Thank you for downloading.
Why observe your network, and why now?
Distributed networks and dynamic environments are the new normal in helping scale up infrastructure multifold without a hassle. With the whole world leaning towards AIOps and machine learning as their primary focus, the first step towards any AI-powered service is to be aware of the behavior of the service itself and also the components associated with it. Here, Observability becomes a necessity rather than a luxury in order to determine the the overall behavior of your environment.
Observability gives you superior control over complex networks and distributed systems that are unpredictable or dynamic in nature. As explained earlier, you get answers for what has gone offbeat as well as the reason for it and other related issues that may arise. The Observability data collected can be analyzed to determine the business impact on your expanding ecosystem since it adapts and delivers through dynamic changes.
What can Observability guarantee modern businesses?
Utilize a fully observable network to help maintain the order in which services function and keep an eye on on crucial SLAs.
Design and develop strategies for complete observability of highly resilient applications, and implement end-user application performance monitoring using proper end-user monitoring tools to ensure customer expectations are met.
Cloud-native adaptability
Cloud-native applications operate on distributed microservice environments that are dynamic in nature. In this case, observability is the only way complete visibility can be promised by analyzing how, when, and where problems exist.
Use observability to help map resources in an IT architecture, making interrelated functioning possible, and facilitate seamless automation deployments for applications.
Identify where and why a distributed application has broken down and fix it with root cause analysis.
Application modernization
With observability, you can more easily deal with your application's quality control when modernization and legacy transformation are adapted.
Compare and analyze your application behavior by setting benchmarks, and manage configuration changes that happen on the application level.
Get deeper visibility into application performance and availability. Detect, troubleshoot, and drill down to the core reason of an issue that's affecting your application.
Threat detection and forensic log analysis
Use threat detection techniques to forecast interruptions or pinpoint errors that interrupt your application performance.
Leverage observability to get constant and continuous feedback in the form of logs and reports, and use advanced machine learning capabilities linked with full network observability to predict any upcoming mishaps with the help of historical data collected.
Observability works best when it is designed to help predict issues, understand changes, and find ways to deal with them. We at ManageEngine OpManager Nexus lean towards pragmatic observability—leveraging AI and ML technologies, combining the plethora of data collected using multiple network management tools, and providing with you an all-in-one unified observability tool.
Packed with out-of-the-box capabilities for monitoring networks; managing bandwidth and network configurations; analyzing firewall rules, logs, and policies; and tracking application performance and usage, ManageEngine OpManager Nexus serves as an integrated solution for system and application observability. With OpManager Nexus, you can:
Manage your dynamic environments with adaptive thresholds - With the help of ML and AI, OpManager Nexus observes the constantly changing values of performance metrics, forecasts highly reliable values, and sets thresholds automatically. Learn more.
Have complete control over your revenue critical applications and ensure they meet end user expectations. Observe the health and performance of your critical cloud infrastructure and cloud hosted applications with precision. Learn more.
Monitor the changes and irregularities in your network, and identify the exact source of the anomalous traffic. Monitor top talkers, conversations, and protocols, and identify the top applications in your network. Learn more.
Detect the onslaught of any virus attack or worm attack instantly, and be aware of malicious attacks that often cause corporate networks to go down, leading to lost business days. In addition, trigger and record alerts for security and traffic anomalies. Learn more.
Fix bandwidth bottlenecks using configuration change templates, and automate configuration changes by executing commands for things such as password changes or enabling SNMP with the help of Configlets, or configuration script templates. Learn more.
Monitor and generate reports on all applications accessed through firewall devices, and identify suspicious applications. Use our customizable network management console to transform monitored data into actionable intelligence with over 90 widgets on tap. Visualize your entire IT infrastructure, and allow administrators to customize dashboards to their liking. Learn more.