What is Process monitoring?
Every business operates with some processes and procedures to accomplish their business goals. The same applies to a network. Process monitoring in a network is the practice of analyzing, tacking and managing various activities occurring within a network to improve the network's performance and capability.
Now you might know what process monitoring is. But to know what the basic processes in a network you should monitor, read on.
Basic processes in a network that need to be monitored
Monitoring system resources (CPU utilization, memory utilization, CPU temperature etc.) and having alerts set-up to be notified on unhealthy utilization levels cannot completely help guarantee optimal server or application performance. To understand the source of the load on the system resources fully, one also needs to know about the performance of each critical process associated with the application or services running on the server and this calls for an extensive process monitoring tool.
- Performance: The aim of monitoring a network is to improve the performance of the network. Proctively monitoring the performance of the network helps meet the organization's business needs effectively.
- Resource utilization: Tracking the resources of a network like CPU, memory and other physical components keeps the network functioning seamlessly and identify under/ over utilized network resources. This helps save costs incurred on impromptu purchases.
- Fault identification: The network should be monitored continuously for faults since they lead to network downtime and other disturbances, holding back the network from seamless functioning. Remediating these faults with automated alert mechanisms helps the network function seamlessly.
Advantages of monitoring process using a robust process monitoring tool
Here are a few advantages of process monitoring system:
Enhanced efficiency:
By proactively monitoring the processes running within a network, it would be much easier for the organization to identify the inefficiencies and remove any process that is no longer serving purposefully to their network.
Quicker fault resolution:
The real-time insights obtained through continuous monitoring helps organizations understand the fault at a glance and resolve them much faster, before it affects the end user.
Cheaper maintenance:
By monitoring the processes from time to time, the network administrators can point out resource utilization trends and performance bottlenecks. This helps reduce costs involved in unnecessary purchases, maintenance and operational costs.
Improved visibility:
The real time process monitoring enables the administrators gain at the moment visibility into the process progress. This not just guarantees continuous improvement but also ensures enhanced quality control.
Better Scalability:
Organizations using process monitoring tools experience better scalability as process monitoring always paves the way for improvement and breaks down the business goals into achievable processes.
What makes OpManager the top choice for process monitoring?
OpManager serves as an integrated process monitoring software, enabling administrators to remotely monitor and manage processes that are running on discovered devices. OpManager's process monitoring module also enables it to act as a Windows process monitor / Linux process monitor software, thereby allowing you to leverage proactive process monitoring for critical processes running on Windows, Linux, Solaris, Unix, HP UX, IBM AIX, ESX VMware servers etc. through SNMP/WMI/CLI.
Here is a snippet of process monitoring with OpManager.

Easy and Quick configuration of process monitor
'Process Templates' allows one to discover, manage and set thresholds easily across multiple servers, from a single window. Options to configure individual process thresholds are also provided from the device snapshot page. Assigned process monitors give an immediate snapshot of the process status, CPU and memory utilization, with the number of instances of each process.
OpManager also allows you to perform SNMP process monitoring, to manage and monitor processes running on your SNMP-enabled devices. This way, you can monitor processes of almost any device if it just has SNMP enabled in it.

Remote Process Monitoring and Diagnostics
Situations like an unexpected CPU spike or memory leak will require immediate diagnosis and troubleshooting. OpManager's remote process monitor diagnostics allows administrators to view Top 10 processes by CPU or Memory utilization and also provides the ability to terminate the problem-causing processes remotely to save the server from crashing.

Alerts, Notification, Actions and Reporting
OpManager's process monitor tool comes with a fault management module that can trigger alerts (Email or SMS) or notify technician (Web alarm or Log a ticket) when a particular process exceeds the set threshold point. Besides these proactive monitoring functionalities, OpManager has options to run any script or a batch file to resolve any unforeseen network anomalies e.g. restarting a particular service/server, when a process exceeds a set upper limit. All processes data monitored are also stored for graphing, trending and reporting purposes.
Feature highlights of server process monitoring in OpManager
- Complete discovery and listing of processes running in discovered devices.
- Listing with Process ID, Process Name, Process Path and Process Arguments.
- Option to perform customized monitoring to identify multiple processes having different paths or arguments and same process name.
- Option to edit the path and arguments of the added process monitors to obtain user-defined values.
- Monitored parameters include CPU utilization, memory utilization and number of instances of the process.
- Individual thresholds for parameter monitored.
- Advanced fault management - email, SMS, web alarm, ticket logging, workflows for automated resolution, running a program.
- Reports on process trend for different time intervals - Today, Yesterday, Last 7 days, last 30 days or a customized time-period.
- "Process Template" feature for association of processes to multiple devices.
- Remotely stop any processes that violate set thresholds.
Download our free, fully functional, 30-day trial today and learn about OpManager's process monitoring all by yourself or sign up for a personalized demo and talk with one of our product experts.
FAQs on Process monitoring
Why is process monitoring important?
+How does a process monitor work?
+What are the 4 key steps in process monitoring?
+What are the benefits of process monitoring?
+Make your network monitoring simple and efficient!
Download OpManager nowCustomer reviews
More than 1,000,000 IT admins trust ManageEngine ITOM solutions to monitor their IT infrastructure securely
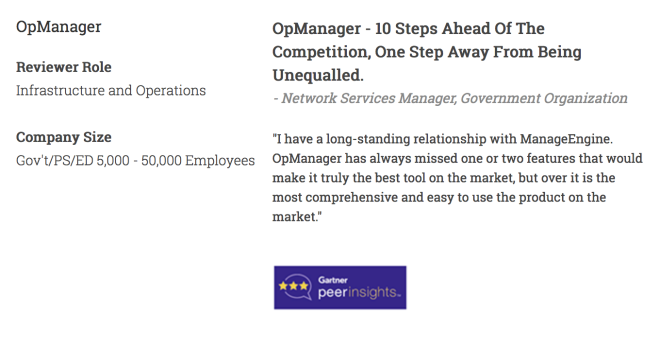
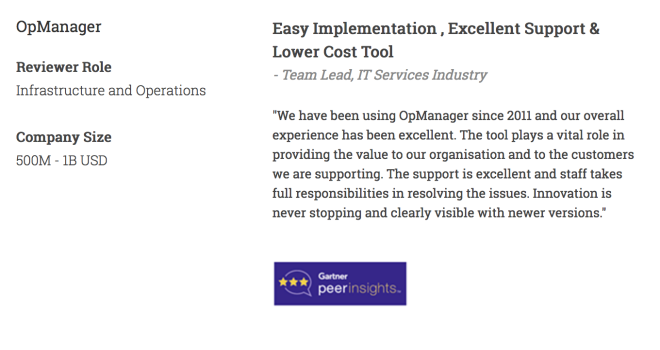
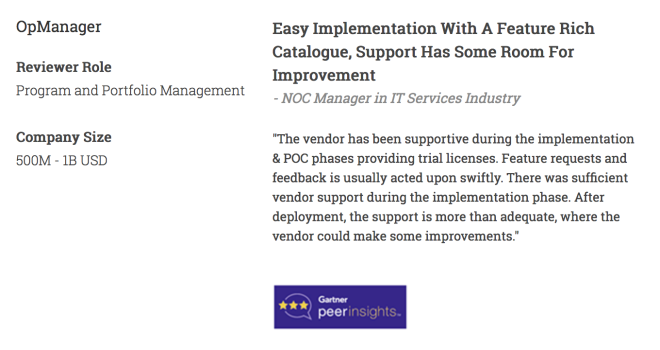
Case Studies - OpManager
Awards & Honors
- Recognized as a May 2019 Gartner Peer Insights Customers' Choice for Network Performance Monitoring and Diagnostics Software
- Recognised as an April 2019 Gartner Peer Insights Customers' Choice for IT Infrastructure Monitoring Tools.
- Network Management and Monitor Vendor of the Year 2018, 2019
- Entered the 2019 Gartner NPMD Magic Quadrant.
- Ranked #2 in the Infotech Research Software Reviews Data Quadrant 2018.