Add Log Profile
A Log Profile defines which logs should be collected from your servers and how they should be parsed and associated with monitors. Creating a log profile is the first step in collecting and analyzing logs using AppLogs.
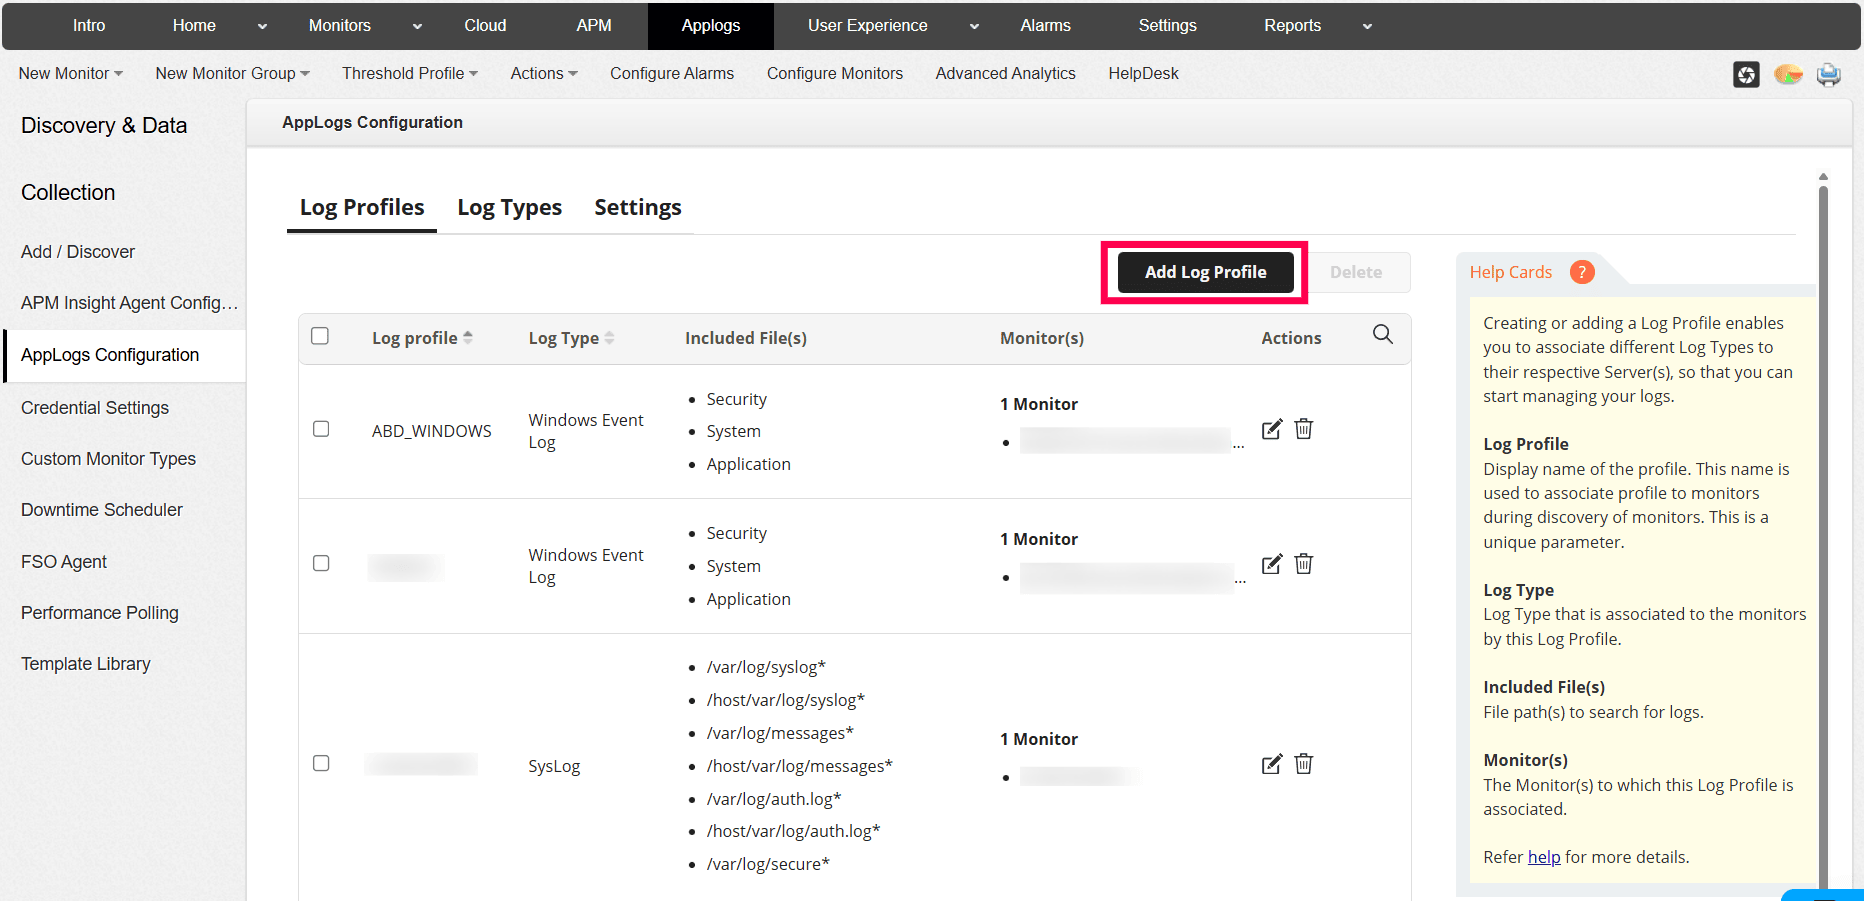
To add a log profile, navigate to the AppLogs tab → Configurations → Log Profiles → Add Log Profile and enter the following details:
Enter the log profile details
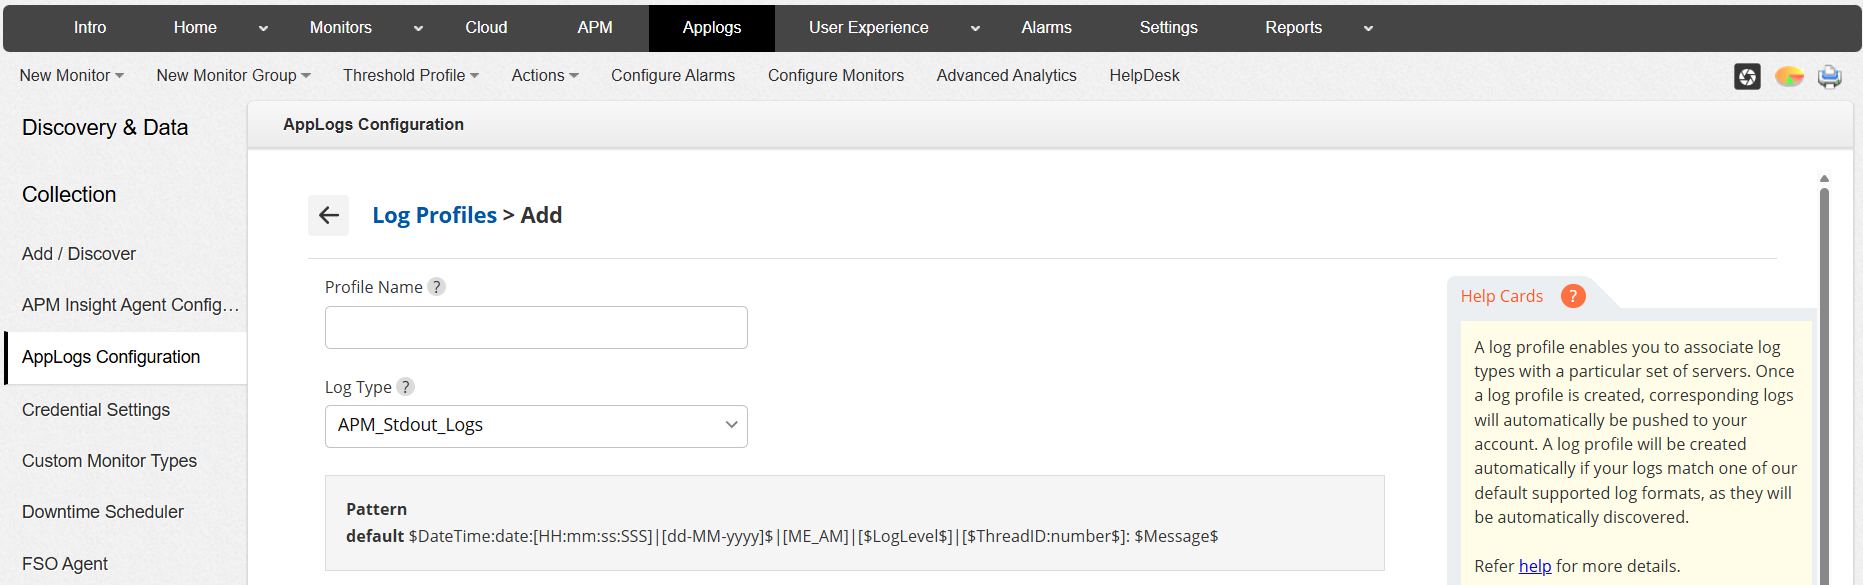
- Profile Name: Enter a unique name to identify the log profile. This name is used to associate the profile with monitors.
- Log Type: Select the log type that matches the format of the logs you want to collect. The selected log type determines how log entries are parsed and indexed. Supported Log Types.
- Pattern: Displays the parsing pattern associated with the selected log type. This pattern defines how log fields such as timestamp, severity, and message are extracted. Ensure that the derived log pattern fully matches the provided sample logs.
Note: If the pattern does not align with the sample logs, entries may be collected with missing or unknown fields. Review and update the sample log and parsing pattern as needed to ensure all required fields are accurately captured.
Specify the log file paths
In the List of files to search for logs field, you can enter the full file path or directory path of the log files. Wildcards can be used to include multiple files.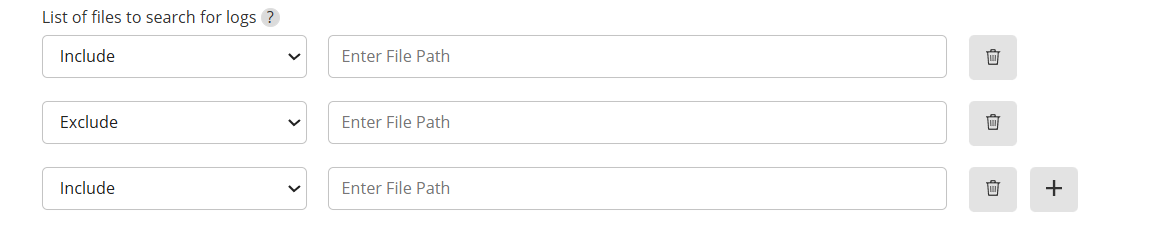
- To include all files in a particular folder:
To include all files under a particular folder, mention the folder name suffixed with
/followed by*in the List of files to search for logs field and click the Include option. For example,home/sas/cassandra/*
will include all the files under the folder cassandra. This option considers only files and excludes sub-folders.
- To include all files and folders in a folder:
To include all files and folders under a particular folder, mention the folder name suffixed with
/followed by**in the List of files to search for logs field. For example,home/sas/cassandra/**
will include all the files and sub-folders within the folder cassandra. This option includes all sub-folders and files within the specified file path.
- To exclude certain files:
Exclude a particular file by clicking the + button, adding the specific file path to be excluded, and selecting the Exclude option. Follow the same format mentioned above while specifying the file path.
You can add multiple file paths if logs are stored in different locations.
- To include all files in a particular folder:
Associate the log profile with monitors
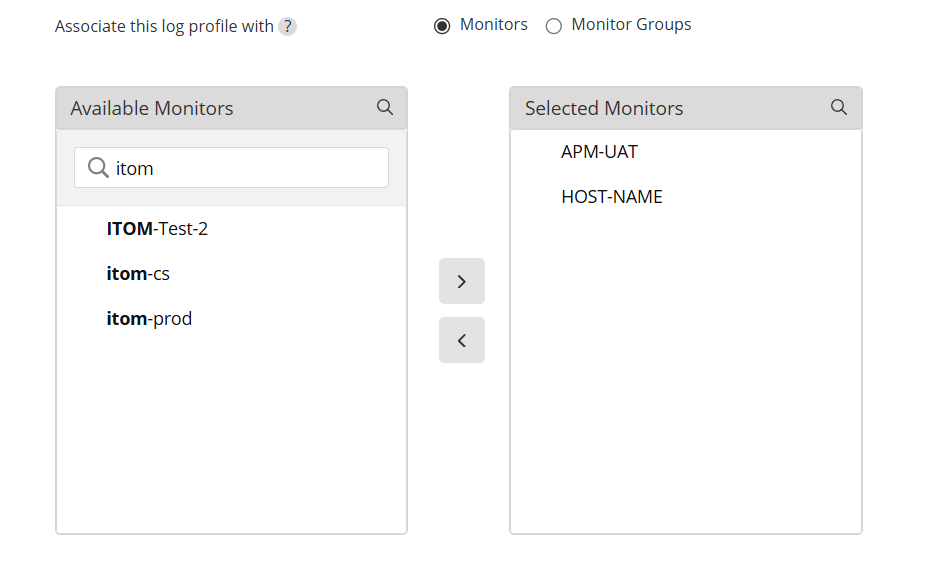
- Monitors: Select individual monitors to associate with this log profile.
- Monitor Groups: Associate the log profile with a monitor group to apply it to multiple monitors at once.
Use the available and selected lists to move the required monitors or monitor groups.
Configure advanced options
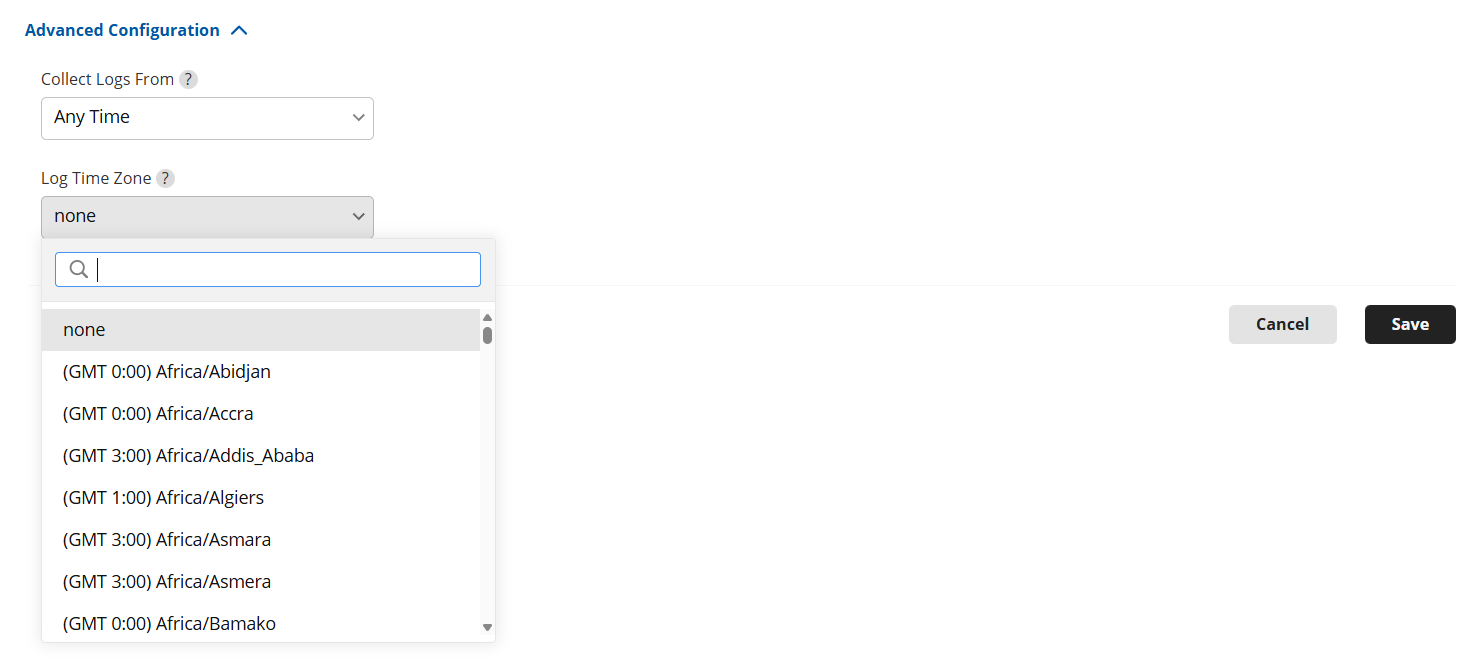
- Collect Logs From: Specify the time range during which logs should be collected.
- Any Time — Collects all available logs from the configured log file paths, regardless of when the log entries were generated.
- New Logs — Collects only the newly generated log entries from the moment the log profile is enabled or last executed. Previously collected logs are skipped, making this ideal for continuous monitoring.
- Last 24 Hours — Collects log entries generated within the past 24 hours from the current time. This helps in analyzing recent issues or short-term activity.
- Last 2 Days — Collects log entries generated over the last 48 hours. Useful when troubleshooting issues that may have occurred over the past couple of days.
- Last 3 Days — Collects log entries generated within the last 72 hours, allowing broader historical visibility for recent events.
- Last 7 Days — Collects log entries generated during the past 7 days.
- Last 30 Days — Collects log entries generated over the last 30 days, providing extended historical data for long-term analysis, audits, or compliance needs.
- Log Time Zone: If the time zone is not present in the log line, choose the appropriate time zone for your logs. If not, Applications Manager automatically fetches the time zone from the machine on which the monitoring agent is installed.
- Collect Logs From: Specify the time range during which logs should be collected.
- Save the log profile.
Once saved, Applications Manager will begin collecting logs based on the defined profile and make them available in the AppLogs search page.
Note: A log profile becomes effective only after it is associated with at least one monitor or monitor group.
When a monitor group is associated with a log profile, logs are collected only from servers where the FSO Agent is installed and AppLogs monitoring is enabled.
