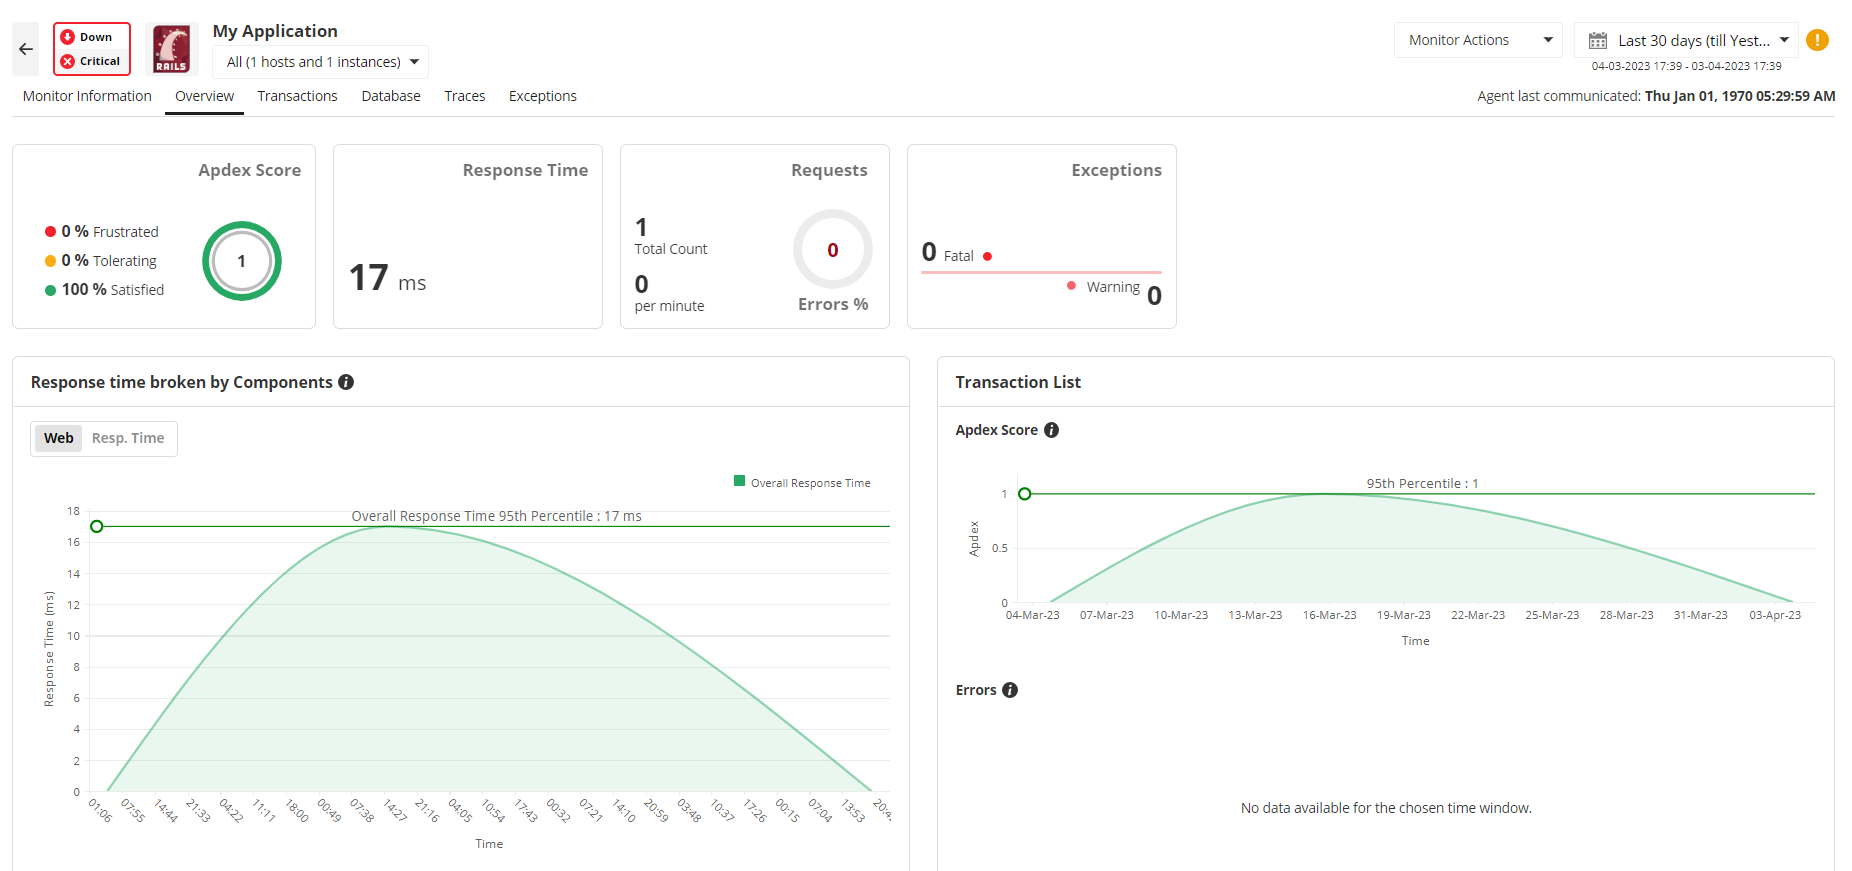
The key to effective application performance management is unmatched visibility into the way business applications behave for end users. Applications Manager's APM Insight is an integrated approach to managing and monitoring the performance of complex Ruby on Rails Web Transactions. Now you can

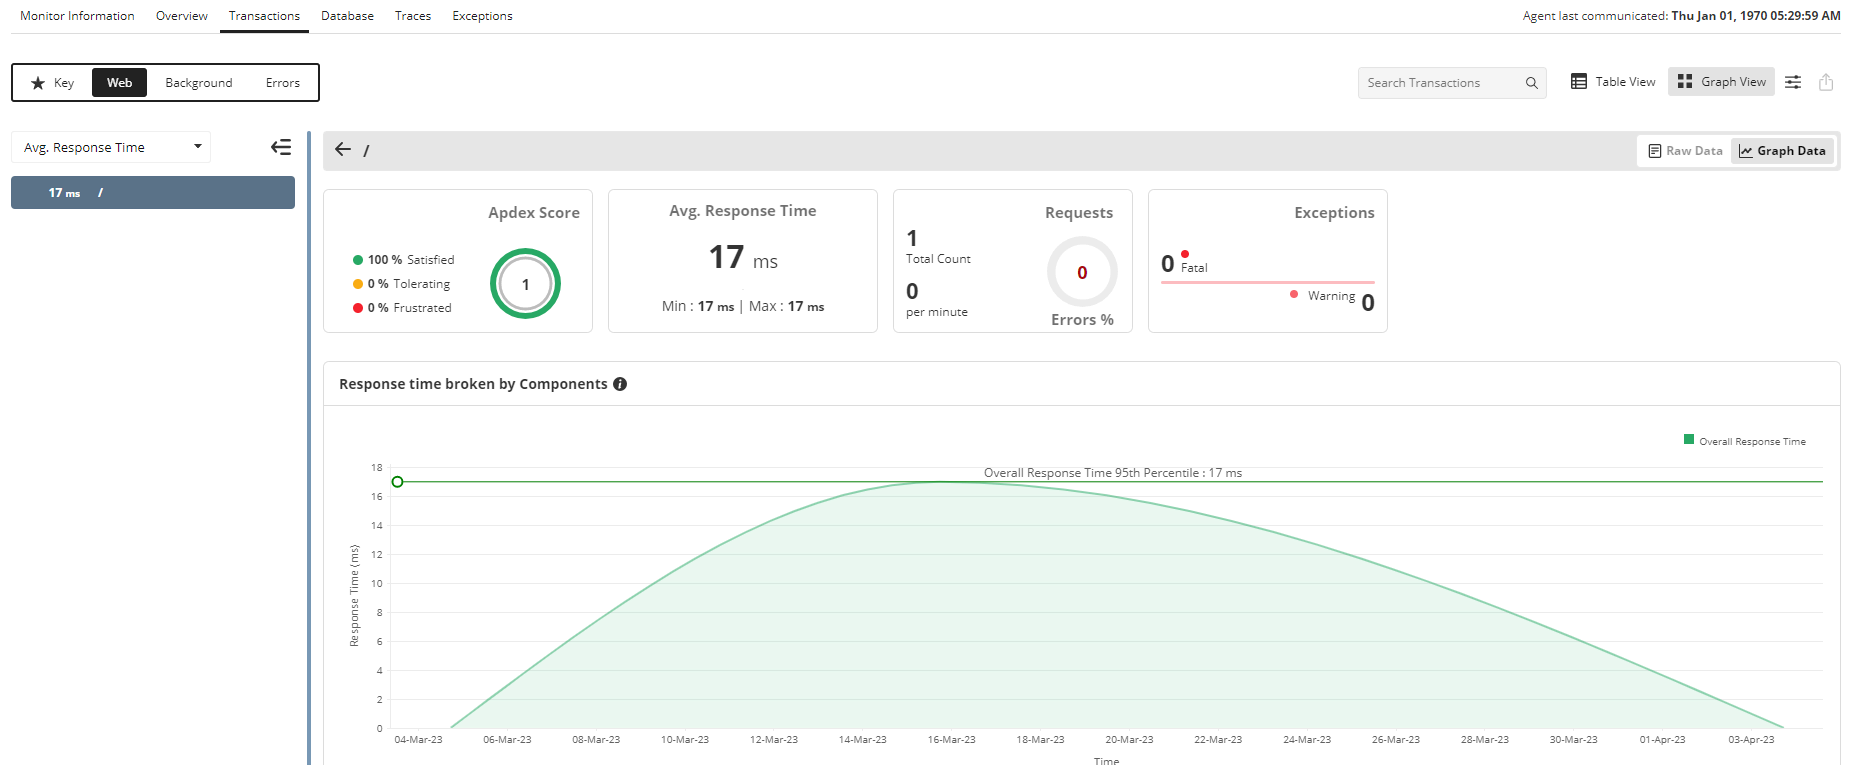
Applications Manager APM Insight helps to better visualize Ruby on Rails Web transactions, with insight into key performance metrics starting from response times to URLs to SQL queries. With end-to-end visibility into all tiers of your transaction, you can now identify and resolve performance degradation issues, no matter where they originate.

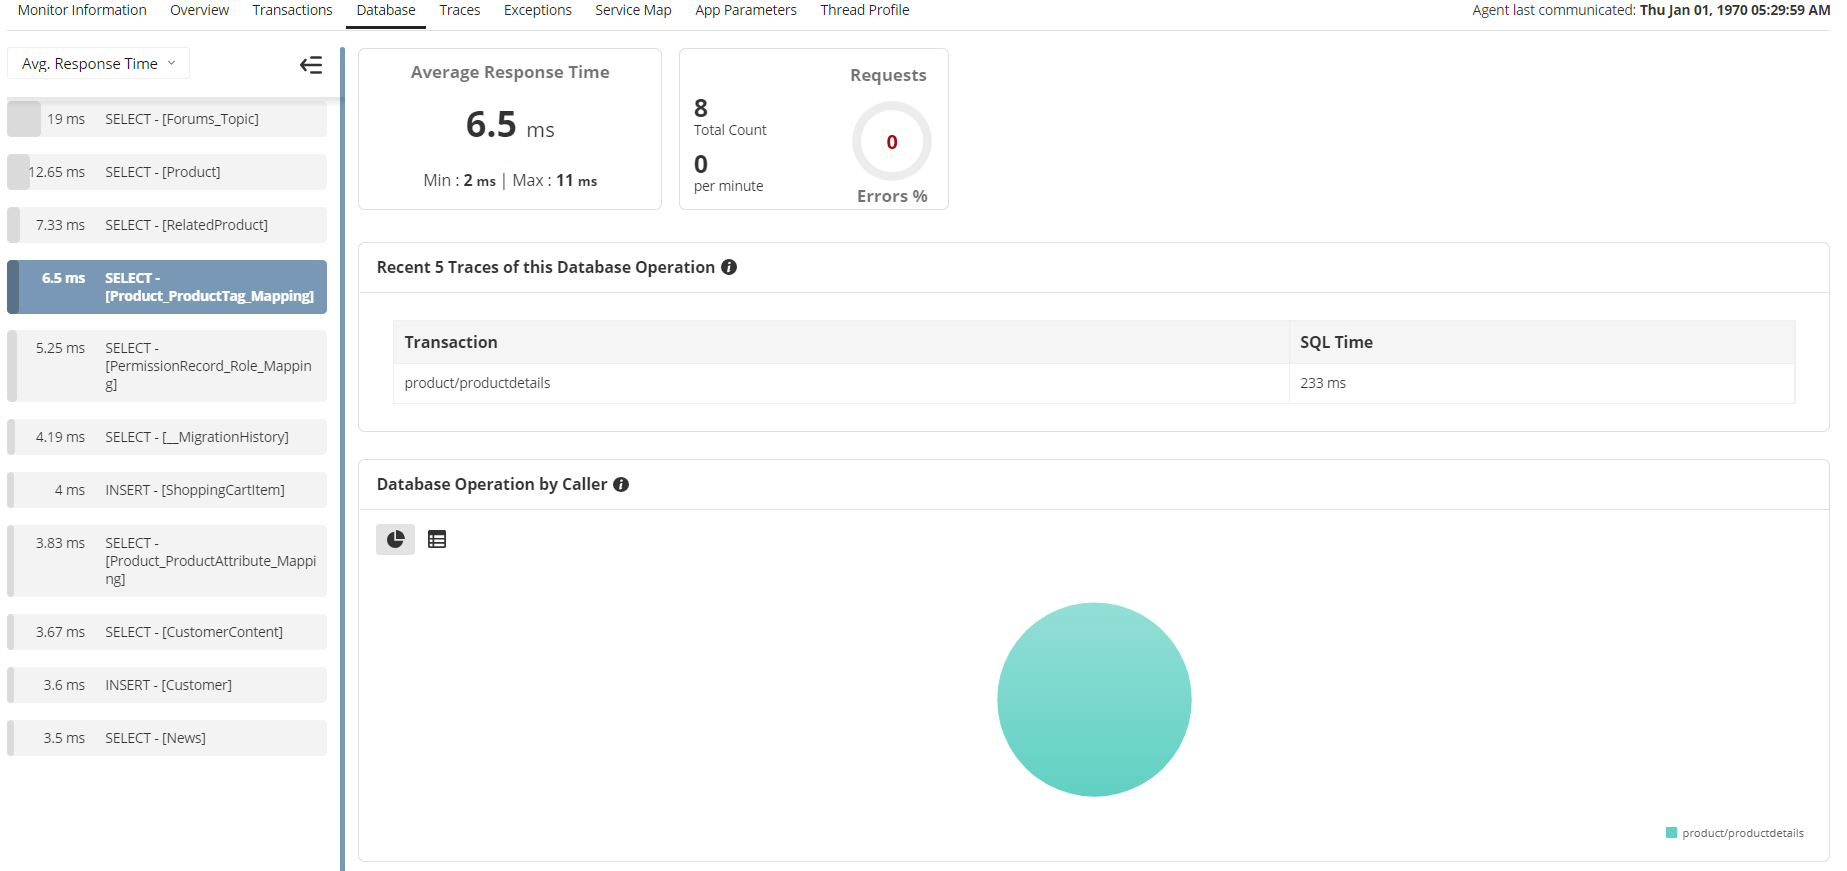
Listing web transactions performed by a database helps you narrow down and isolate the root cause of performance slowdown. With APM Insight you can get detailed performance metrics to identify the slow database calls, database usage and overall performance of the database furnished with detailed graphical and tabular representations.

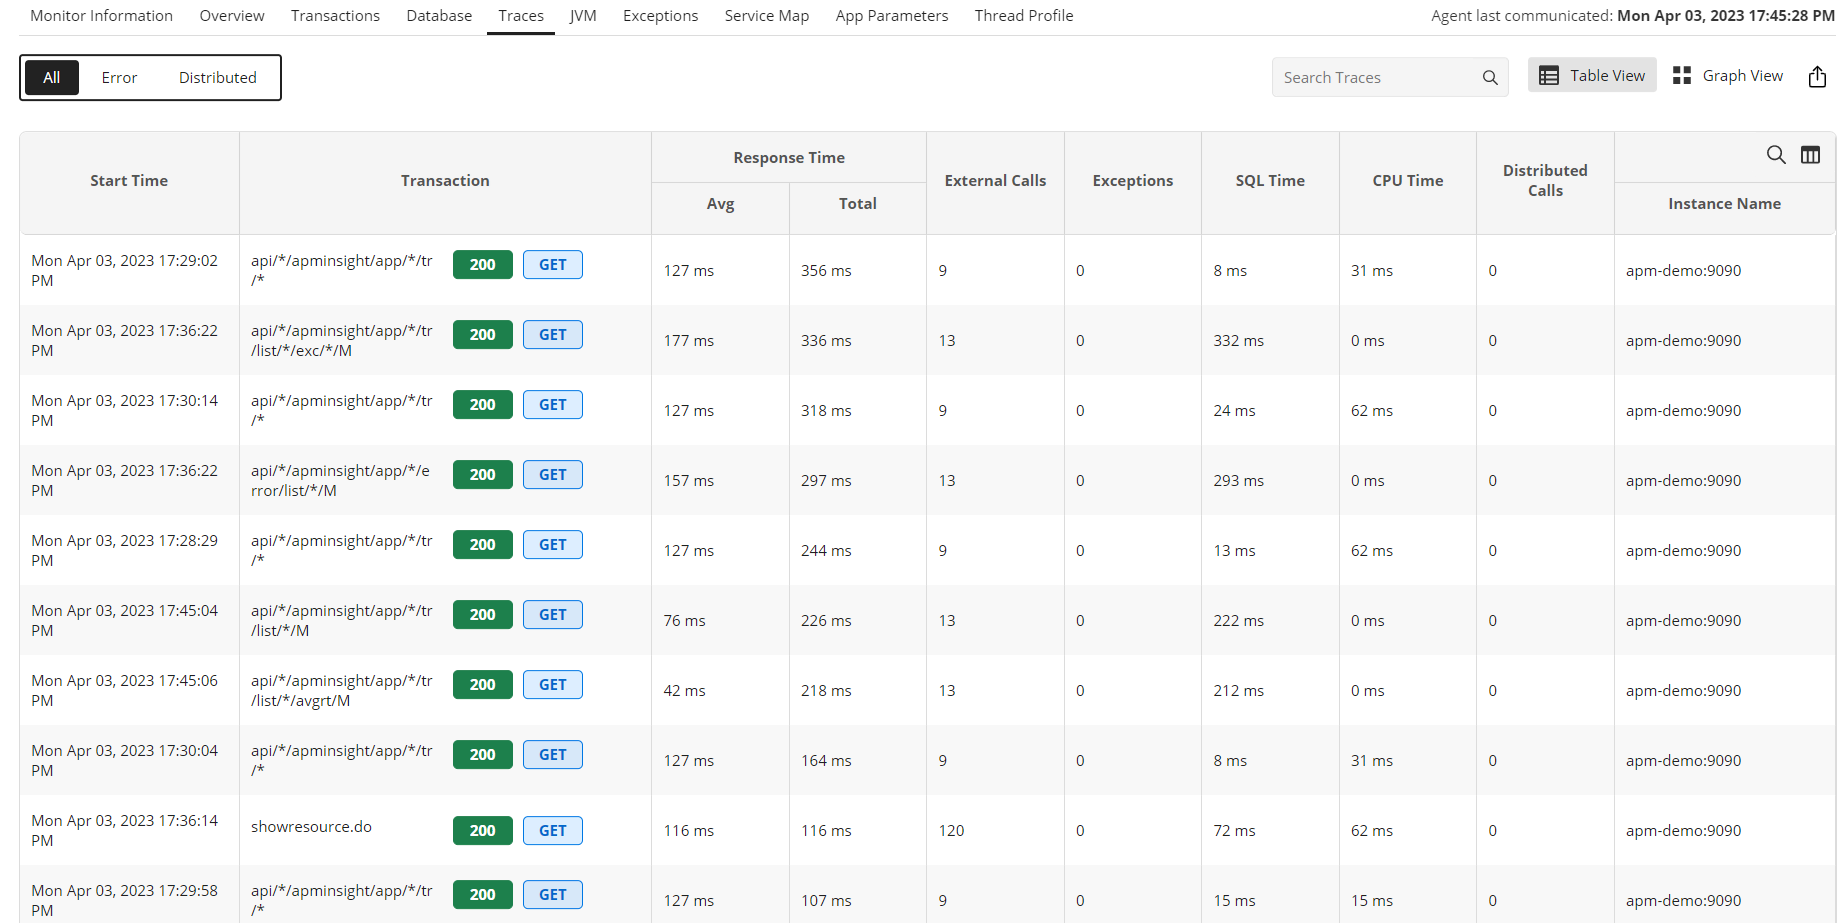
Get the execution details trace for URLs displayed in a tree structure. The trace will chart the sequence of internal invocations (methods) of the URL.
You can also identify the SQL queries executed during the transaction and thereby identify the worst performing database queries.

In today's competitive digital landscape, a seamless user experience is non-negotiable, and scalability is key to sustained growth. Effective "ruby on rails monitoring" with ManageEngine Applications Manager is not merely about fixing problems; it's about continuously enhancing the end-user experience and ensuring your applications can scale to meet increasing demand. By providing comprehensive insights into application behavior under various load conditions, our solution helps you perform capacity planning with precision.
You can identify which parts of your application might become bottlenecks as user traffic grows, allowing for proactive optimization and infrastructure scaling. Understanding the performance impact of new features or updates before they reach production users is also crucial, and Applications Manager provides the data to facilitate this. Ultimately, by maintaining peak performance and ensuring optimal resource utilization, ManageEngine Applications Manager empowers businesses to deliver exceptional digital experiences, build user loyalty, and confidently grow their Ruby on Rails applications without performance becoming a limiting factor.
Note: Ruby Web Transaction Monitor can be evaluated with our Professional Edition or Enterprise Edition (trial for 30 days). You can place a request for evaluation license here.
It allows us to track crucial metrics such as response times, resource utilization, error rates, and transaction performance. The real-time monitoring alerts promptly notify us of any issues or anomalies, enabling us to take immediate action.
Reviewer Role: Research and Development
Trusted by over 6000+ businesses globally