SAP Monitoring
The SAP architecture can be complex as it's composed of a number of disparate elements and multi-tiered applications. Each element must be performing optimally to ensure responsive and reliable service levels. Managing such a complex system can be quite daunting, which is why the use of a robust tool for SAP monitoring is absolutely essential.
Capabilities of SAP monitoring:
1. Reduce the MTTR and optimize performance
ManageEngine Applications Manager's SAP performance monitoring offers tracking of various SAP components with comprehensive data to understand the level at which they are operating. By analyzing the data, one can easily isolate the anomalies and study them further to understand the root cause of the problem. Applications Manager makes it easier to analyze and troubleshoot performance problems with capabilities such as capacity planning, fault management, forecast prediction, inventory management and more.
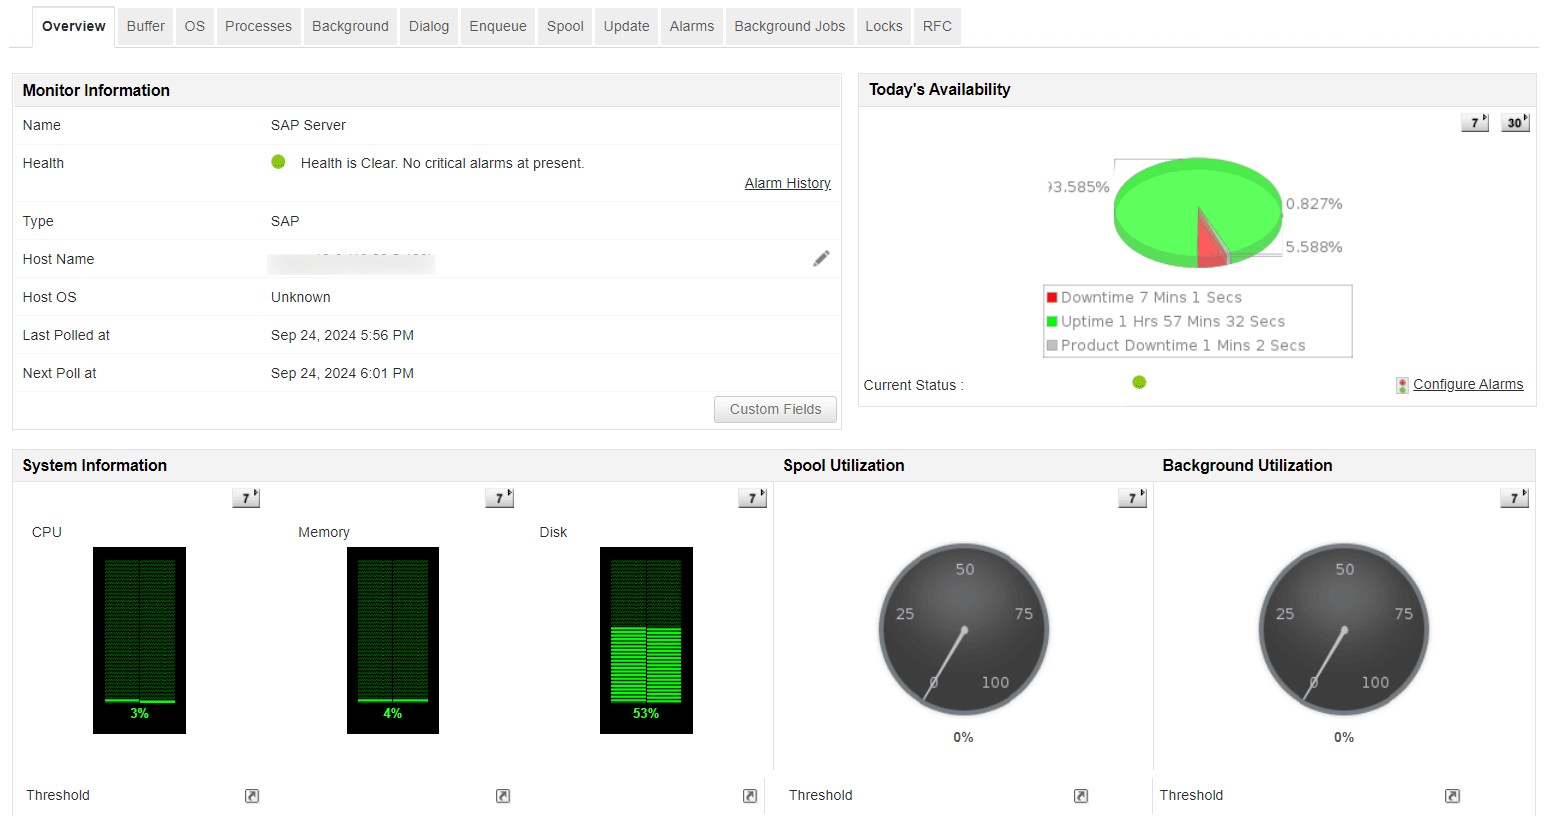
2. Receive notifications on a slow process
SAP monitoring tools like Applications Manager allows constantly keeps a close watch on background processes so that you can make decisions on optimizing the usage of SAP computing resources. Critical data on system load paints a picture on how efficiently resources are being consumed and highlights areas that lead to slow processing.
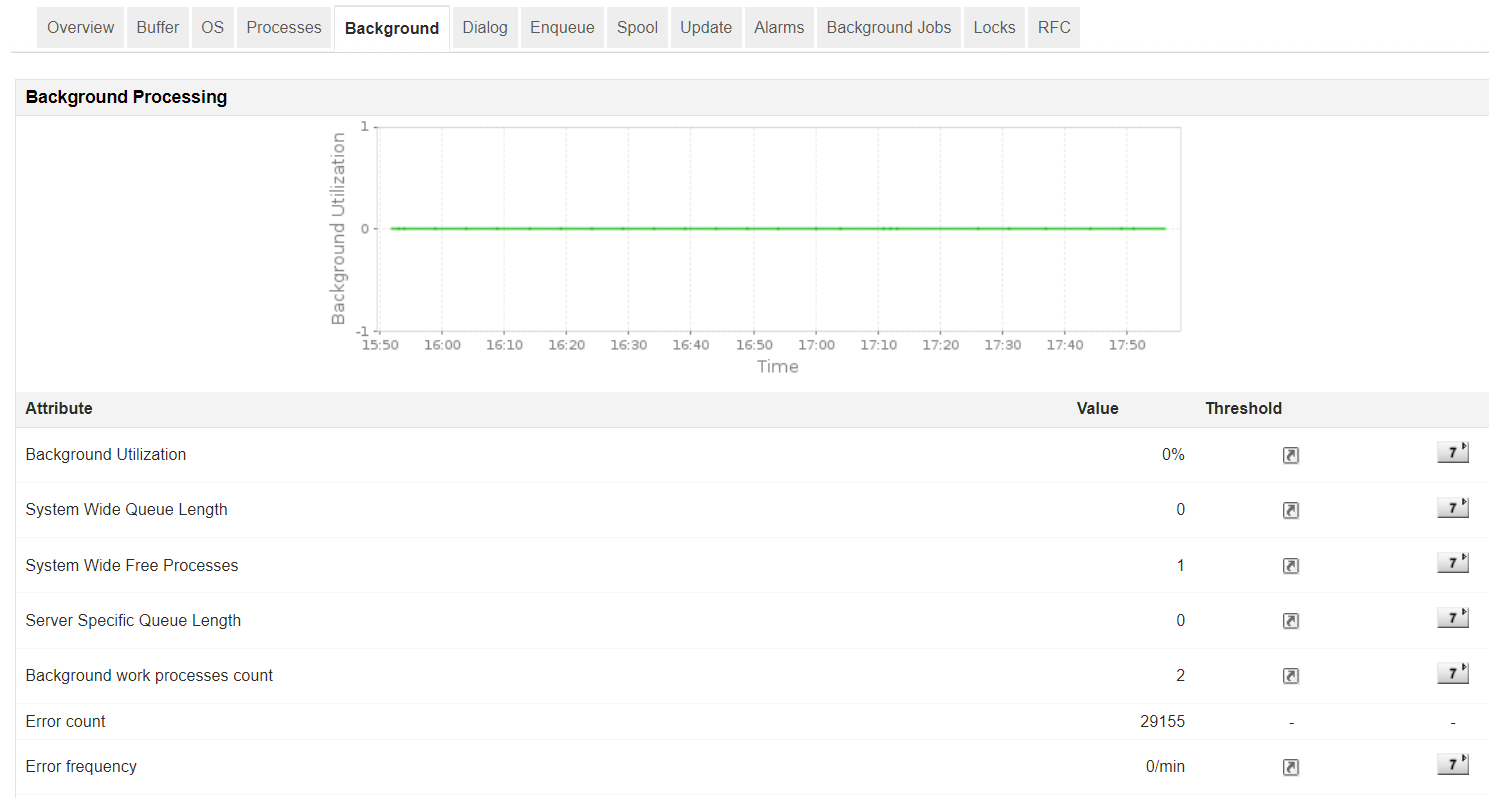
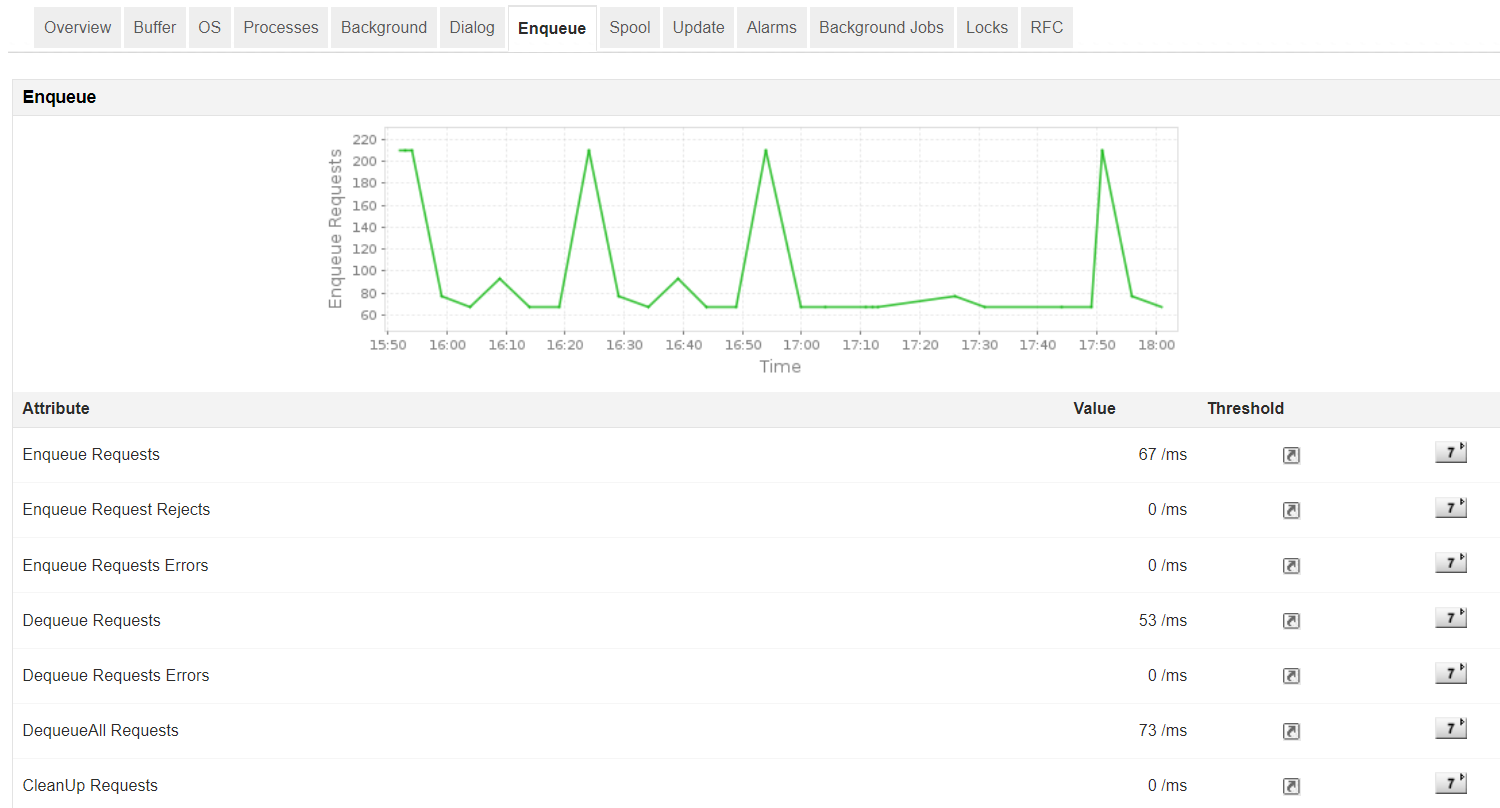
3. Detect system failures with Enqueue feature
With Applications Manager's SAP performance monitoring, monitor the values of the Enqueue service and measure the lock wait time to optimize the application.
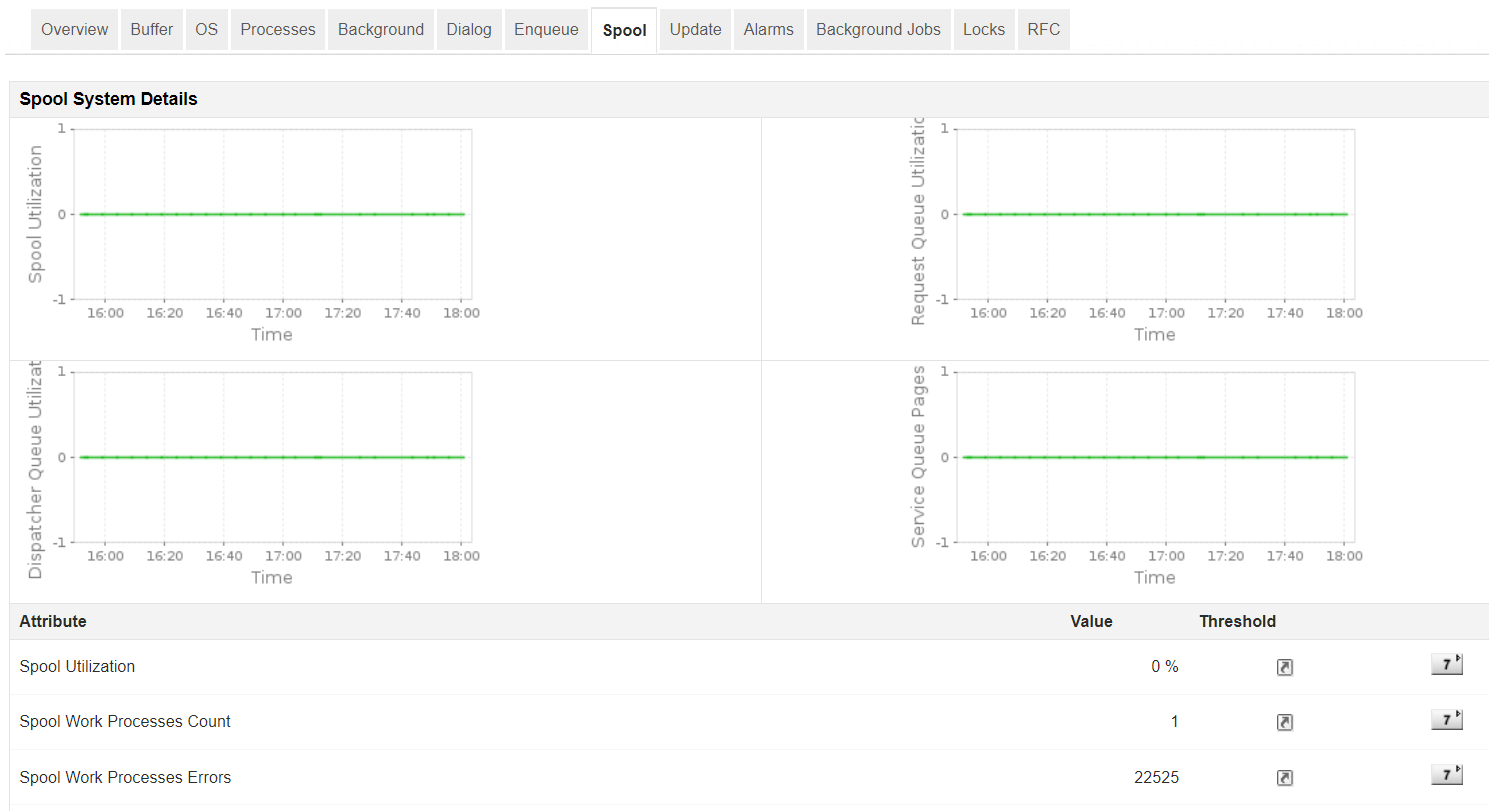
4. Detect failures in Spool Requests
Using the spool utilization metric, our SAP monitoring software will measure the efficiency involved in queuing jobs which helps react quickly on alert messages.
5. Perform capacity planning based on user load
Our SAP monitoring capability enables you to monitor SAP performance metrics of servers, databases, VMs and public cloud services such as Amazon EC2 and identify over utilized and underutilized resources and plan capacity accordingly.
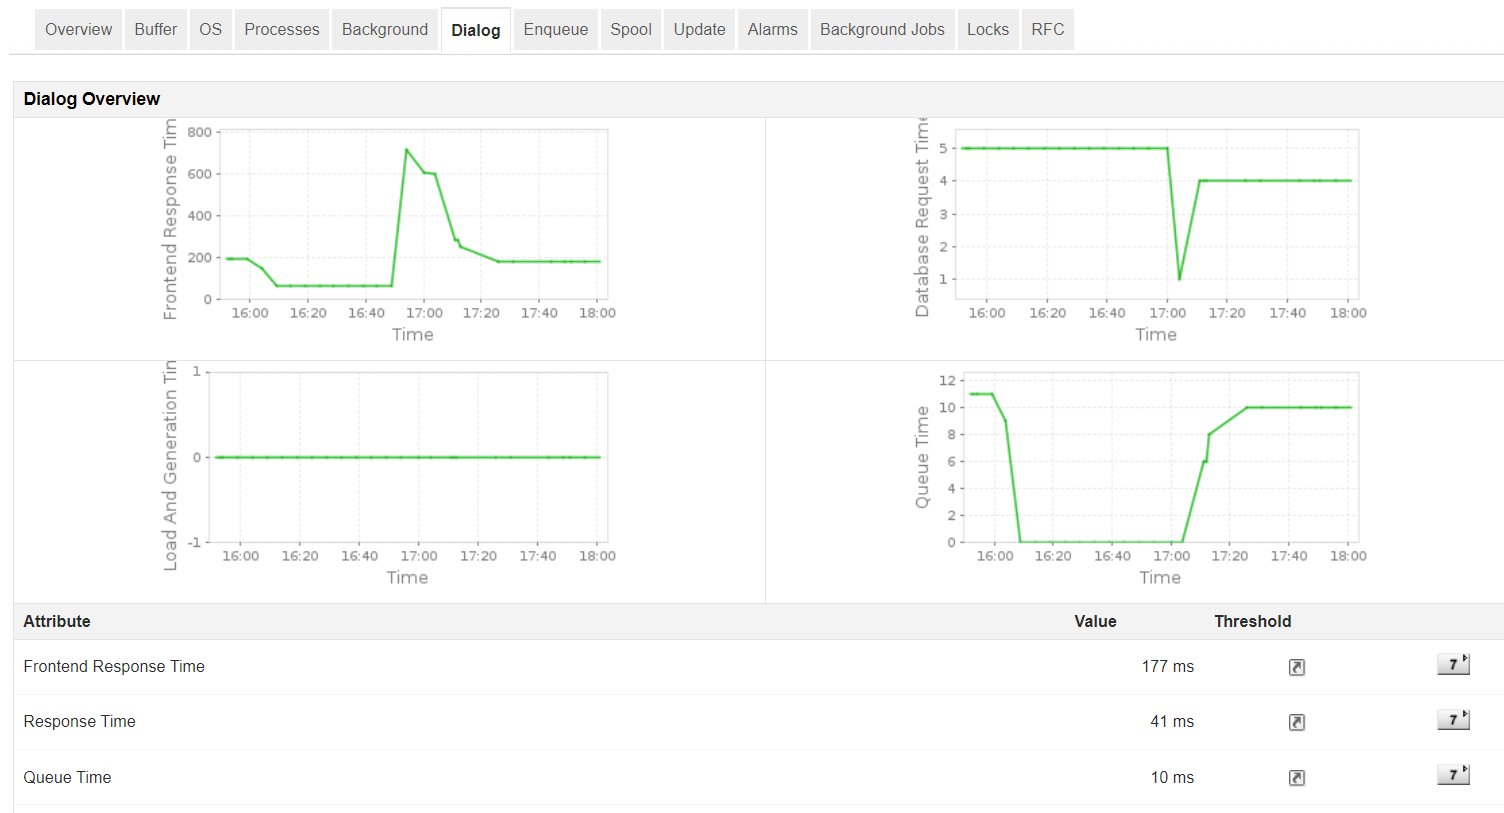
6. Proactively detect failed background jobs
The SAP monitor makes sure that these jobs can be run without interfering with routine work and troubleshoots the root cause with the generated trace from a single console.

7. Quick troubleshooting with RFC T-code monitoring
When there are dependent modules running in different SAP systems, the RFC ( remote function call ) enables communication between them. Perform SAP performance analysis and ascertain (transactional, queued) RFC failures due to system failure or communication error. View all RFC related T-codes on a single console to detect any possible errors. Proactively configure thresholds to receive alerts for states like SYSFAIL, CPICERR or INACTIVE and prevent delays in troubleshooting, with the help of our tool for SAP system monitoring.

8. Intelligent alerting on SAP system errors
Our SAP system monitoring tool's fault management feature enables you to view and troubleshoot SAP system errors comprising of ABAP dumps, aborted Jobs, update errors and other syslog errors.
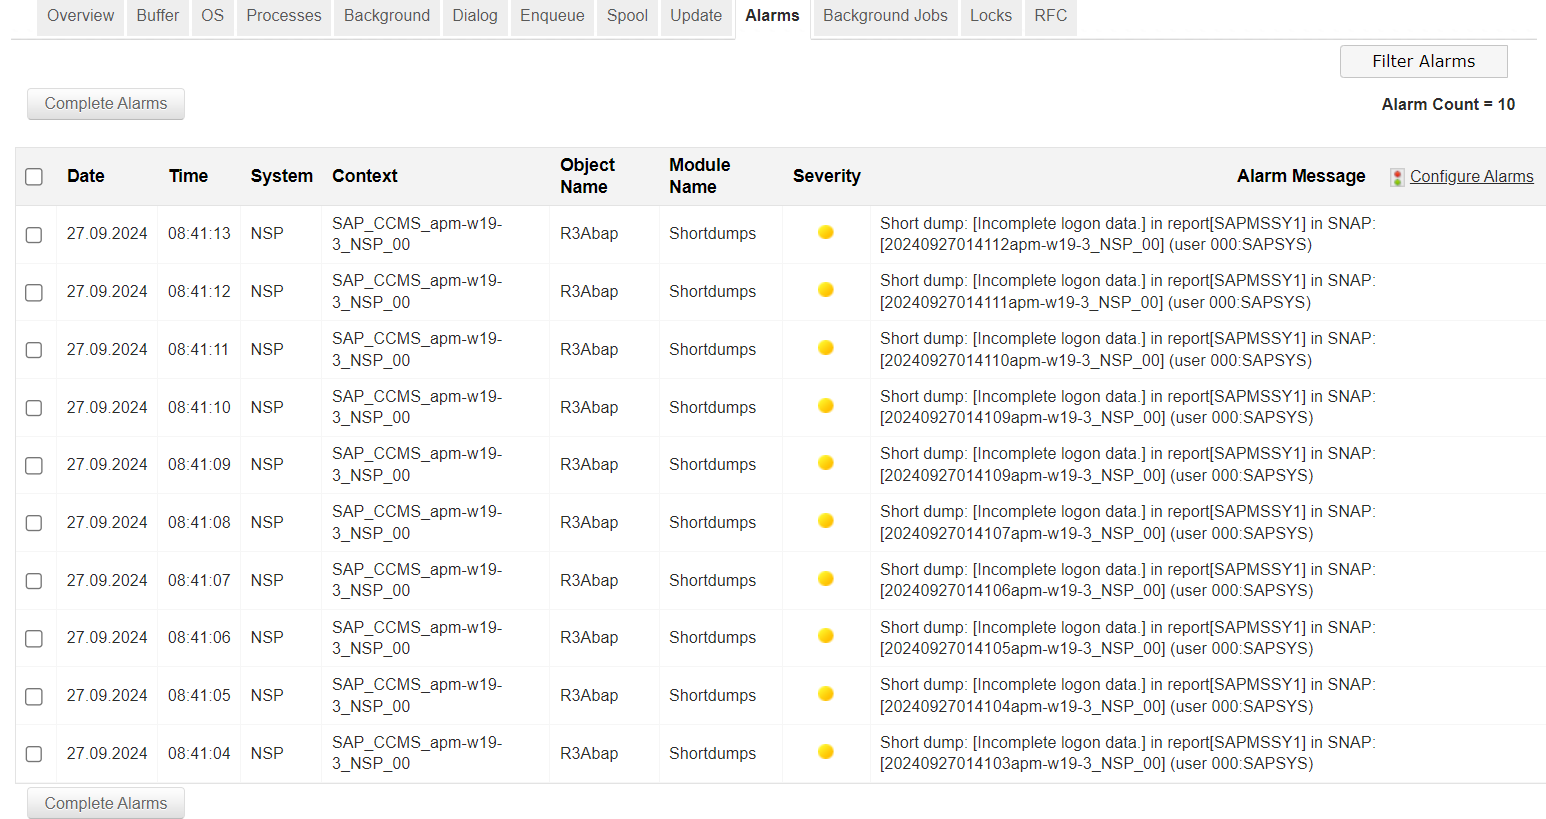
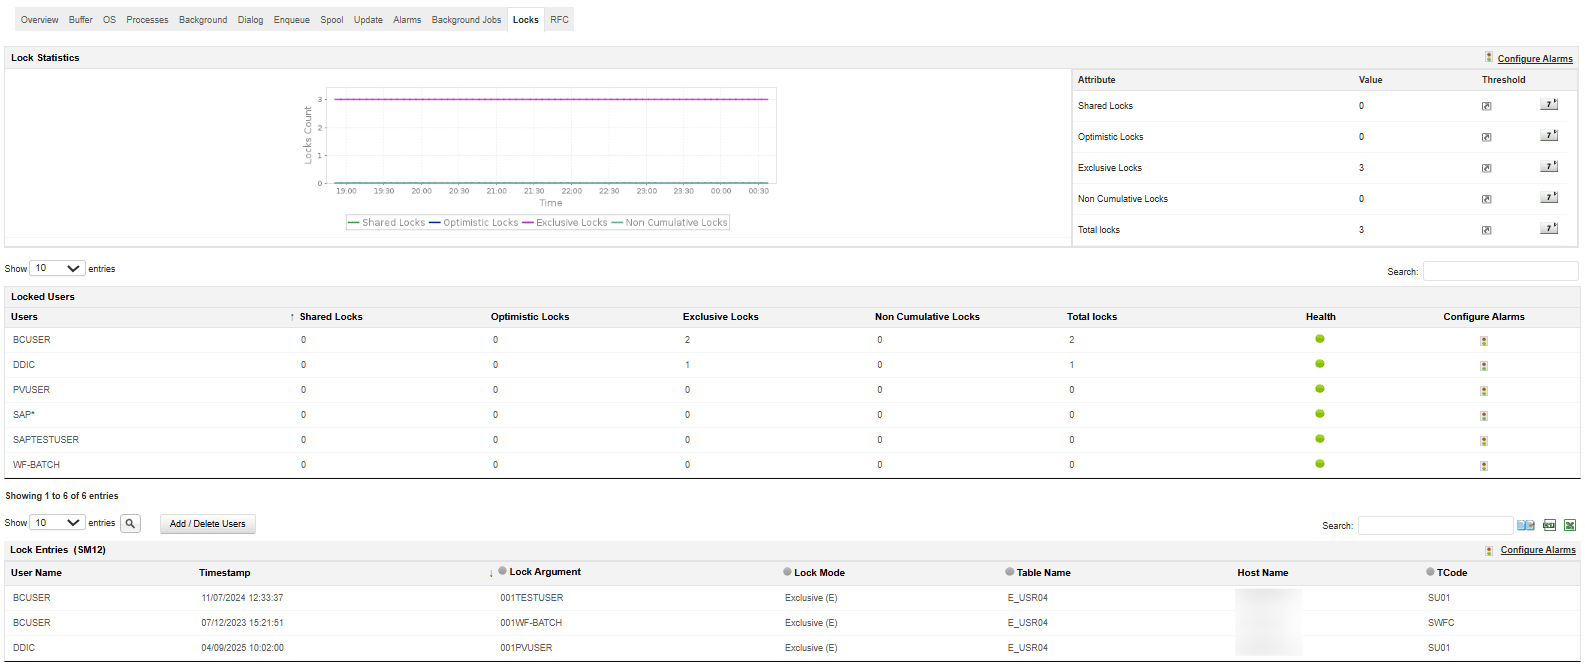
9. Manage and monitor locks
Lock entries manage concurrent access to data in the system, ensuring data integrity and consistency during transactions. They prevent conflicts by controlling access when multiple users or processes attempt to access or modify the same data simultaneously. With our SAP monitoring software, you can view details such as the list of users holding database locks, along with the number of shared, optimistic, exclusive, and non-cumulative locks each user holds, as well as the total locks currently active. You can also configure and monitor critical lock entries and receive notifications when locks exceed predefined thresholds.
10. Track Process Chains for reliable data processing
Ensure the reliable execution of your SAP process chains with Applications Manager by gaining complete visibility into critical data workflows. Track the real-time status of process chains in SAP BW environments—whether they are running, completed, or failed—and analyze key metrics such as execution time, start and end times, and error details. Quickly detect failures, delays, and performance bottlenecks, and take immediate corrective action to keep your data processing on track. Leverage proactive alerts to stay ahead of issues, minimize downtime, and prevent data inconsistencies, ensuring seamless and efficient business operations.

11. SAP reporting and analysis
The reporting facility in Applications Manager's SAP monitoring software displays crucial performance data within a single console to identify potential problems early, and gives an overview of the load and performance of your system. With SAP application monitoring, admins can get detailed information about the health, availability, CPU, memory and disk utilization parameters of the SAP server. Apart from this, detailed reports on the critical metrics like Enqueue requests, response time, Spool utilization rate, etc. can be retrieved as well.
SAP services you can monitor:
SAP CCMS monitor
Applications Manager's SAP management capabilities enable you to proactively monitor the performance of various components and resources in your SAP ERP landscape, like the SAP Business Intelligence (BI), SAP Customer Relationship Management (CRM), SAP Supply Chain Management (SCM), etc. Keep track of key metrics such as connection time, and attributes for performance, status and log.
SAP Business One monitor
Applications Manager monitors SAP's suite of business management solutions which have a dire need to maintain constant uptime and reliability. It tracks your SAP Business One suite to provide information on critical performance parameters of the system, queue, SLD, BizStore, users, scenarios, transactions, errors, and conflicts.
To learn more, visit the SAP Business One monitoring page.
SAP HANA monitor
As part of Applications Manager's SAP monitoring capability, you can also track the performance level of your SAP HANA database system. It gives deeper insight into different database elements such as jobs, services, system load (disk & memory), schema, replications, backups, transactions, statements, cache, and more. The instantaneous alerting feature provides a detailed report on the root cause behind a performance anomaly.
To learn more, visit the SAP HANA monitoring page.
Set up your own SAP monitor in just a few minutes!
Applications Manager is a versatile SAP monitoring tool that has tons of exciting features to keep track of your SAP infrastructure. It is easy and straightforward to setup. Get a personal experience on how Applications Manager can address and solve your SAP monitoring needs. Download FREE 30-day free trial now!

